Free Statistics
of Irreproducible Research!
Description of Statistical Computation | |||||||||||||||||||||||||||||||||||||||||||||||||||||||||||||||||||||||||||||||||||||||||||||||||||||||||||||||||||||||||||||||||||||||||||||||||||||||||||||||||||||||||||||||||||||||||
|---|---|---|---|---|---|---|---|---|---|---|---|---|---|---|---|---|---|---|---|---|---|---|---|---|---|---|---|---|---|---|---|---|---|---|---|---|---|---|---|---|---|---|---|---|---|---|---|---|---|---|---|---|---|---|---|---|---|---|---|---|---|---|---|---|---|---|---|---|---|---|---|---|---|---|---|---|---|---|---|---|---|---|---|---|---|---|---|---|---|---|---|---|---|---|---|---|---|---|---|---|---|---|---|---|---|---|---|---|---|---|---|---|---|---|---|---|---|---|---|---|---|---|---|---|---|---|---|---|---|---|---|---|---|---|---|---|---|---|---|---|---|---|---|---|---|---|---|---|---|---|---|---|---|---|---|---|---|---|---|---|---|---|---|---|---|---|---|---|---|---|---|---|---|---|---|---|---|---|---|---|---|---|---|---|---|
| Author's title | |||||||||||||||||||||||||||||||||||||||||||||||||||||||||||||||||||||||||||||||||||||||||||||||||||||||||||||||||||||||||||||||||||||||||||||||||||||||||||||||||||||||||||||||||||||||||
| Author | *The author of this computation has been verified* | ||||||||||||||||||||||||||||||||||||||||||||||||||||||||||||||||||||||||||||||||||||||||||||||||||||||||||||||||||||||||||||||||||||||||||||||||||||||||||||||||||||||||||||||||||||||||
| R Software Module | rwasp_chi_squared_tests.wasp | ||||||||||||||||||||||||||||||||||||||||||||||||||||||||||||||||||||||||||||||||||||||||||||||||||||||||||||||||||||||||||||||||||||||||||||||||||||||||||||||||||||||||||||||||||||||||
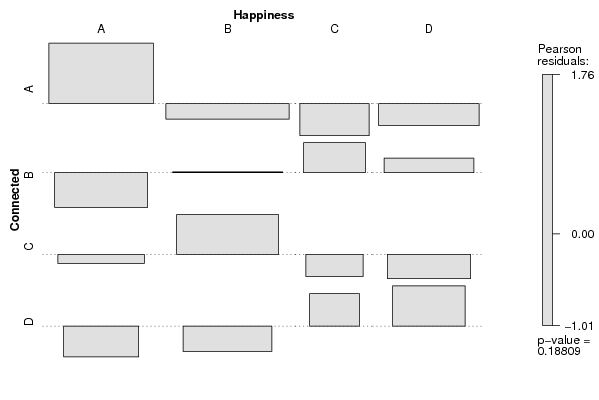
| Title produced by software | Chi-Squared and McNemar Tests | ||||||||||||||||||||||||||||||||||||||||||||||||||||||||||||||||||||||||||||||||||||||||||||||||||||||||||||||||||||||||||||||||||||||||||||||||||||||||||||||||||||||||||||||||||||||||
| Date of computation | Wed, 10 Nov 2010 14:59:11 +0000 | ||||||||||||||||||||||||||||||||||||||||||||||||||||||||||||||||||||||||||||||||||||||||||||||||||||||||||||||||||||||||||||||||||||||||||||||||||||||||||||||||||||||||||||||||||||||||
| Cite this page as follows | Statistical Computations at FreeStatistics.org, Office for Research Development and Education, URL https://freestatistics.org/blog/index.php?v=date/2010/Nov/10/t12894011395kpqpidas3tz2ux.htm/, Retrieved Mon, 29 Apr 2024 09:26:23 +0000 | ||||||||||||||||||||||||||||||||||||||||||||||||||||||||||||||||||||||||||||||||||||||||||||||||||||||||||||||||||||||||||||||||||||||||||||||||||||||||||||||||||||||||||||||||||||||||
| Statistical Computations at FreeStatistics.org, Office for Research Development and Education, URL https://freestatistics.org/blog/index.php?pk=93055, Retrieved Mon, 29 Apr 2024 09:26:23 +0000 | |||||||||||||||||||||||||||||||||||||||||||||||||||||||||||||||||||||||||||||||||||||||||||||||||||||||||||||||||||||||||||||||||||||||||||||||||||||||||||||||||||||||||||||||||||||||||
| QR Codes: | |||||||||||||||||||||||||||||||||||||||||||||||||||||||||||||||||||||||||||||||||||||||||||||||||||||||||||||||||||||||||||||||||||||||||||||||||||||||||||||||||||||||||||||||||||||||||
|
| |||||||||||||||||||||||||||||||||||||||||||||||||||||||||||||||||||||||||||||||||||||||||||||||||||||||||||||||||||||||||||||||||||||||||||||||||||||||||||||||||||||||||||||||||||||||||
| Original text written by user: | |||||||||||||||||||||||||||||||||||||||||||||||||||||||||||||||||||||||||||||||||||||||||||||||||||||||||||||||||||||||||||||||||||||||||||||||||||||||||||||||||||||||||||||||||||||||||
| IsPrivate? | No (this computation is public) | ||||||||||||||||||||||||||||||||||||||||||||||||||||||||||||||||||||||||||||||||||||||||||||||||||||||||||||||||||||||||||||||||||||||||||||||||||||||||||||||||||||||||||||||||||||||||
| User-defined keywords | |||||||||||||||||||||||||||||||||||||||||||||||||||||||||||||||||||||||||||||||||||||||||||||||||||||||||||||||||||||||||||||||||||||||||||||||||||||||||||||||||||||||||||||||||||||||||
| Estimated Impact | 228 | ||||||||||||||||||||||||||||||||||||||||||||||||||||||||||||||||||||||||||||||||||||||||||||||||||||||||||||||||||||||||||||||||||||||||||||||||||||||||||||||||||||||||||||||||||||||||
Tree of Dependent Computations | |||||||||||||||||||||||||||||||||||||||||||||||||||||||||||||||||||||||||||||||||||||||||||||||||||||||||||||||||||||||||||||||||||||||||||||||||||||||||||||||||||||||||||||||||||||||||
| Family? (F = Feedback message, R = changed R code, M = changed R Module, P = changed Parameters, D = changed Data) | |||||||||||||||||||||||||||||||||||||||||||||||||||||||||||||||||||||||||||||||||||||||||||||||||||||||||||||||||||||||||||||||||||||||||||||||||||||||||||||||||||||||||||||||||||||||||
| F [Chi-Squared and McNemar Tests] [Connected - Happi...] [2010-11-10 14:59:11] [61e5ee05de011f44efa37f086a4e2271] [Current] - P [Chi-Squared and McNemar Tests] [Happiness vs conn...] [2010-11-15 12:06:40] [717f3d787904f94c39256c5c1fc72d4c] - [Chi-Squared and McNemar Tests] [happiness vs conn...] [2010-11-16 09:32:46] [3df61981e9f4dafed65341be376c4457] - [Chi-Squared and McNemar Tests] [Happiness versus ...] [2010-11-16 09:37:03] [ff7c1e95cf99a1dae07ec89975494dde] - P [Chi-Squared and McNemar Tests] [] [2010-11-15 12:12:54] [717f3d787904f94c39256c5c1fc72d4c] - P [Chi-Squared and McNemar Tests] [Happiness vs sepe...] [2010-11-15 12:12:54] [717f3d787904f94c39256c5c1fc72d4c] - [Chi-Squared and McNemar Tests] [happiness vs sepe...] [2010-11-16 09:36:03] [3df61981e9f4dafed65341be376c4457] - [Chi-Squared and McNemar Tests] [Happiness vs sepe...] [2010-11-16 09:40:34] [ff7c1e95cf99a1dae07ec89975494dde] - [Chi-Squared and McNemar Tests] [Connected - Happi...] [2010-11-16 16:04:07] [de4adef75375d243bafd27c3fb0ddf4c] - [Chi-Squared and McNemar Tests] [workshop 6 part 1 B] [2010-11-16 19:52:03] [a90833f600c49a37df2affa5b2163a2e] | |||||||||||||||||||||||||||||||||||||||||||||||||||||||||||||||||||||||||||||||||||||||||||||||||||||||||||||||||||||||||||||||||||||||||||||||||||||||||||||||||||||||||||||||||||||||||
| Feedback Forum | |||||||||||||||||||||||||||||||||||||||||||||||||||||||||||||||||||||||||||||||||||||||||||||||||||||||||||||||||||||||||||||||||||||||||||||||||||||||||||||||||||||||||||||||||||||||||
Post a new message | |||||||||||||||||||||||||||||||||||||||||||||||||||||||||||||||||||||||||||||||||||||||||||||||||||||||||||||||||||||||||||||||||||||||||||||||||||||||||||||||||||||||||||||||||||||||||
Dataset | |||||||||||||||||||||||||||||||||||||||||||||||||||||||||||||||||||||||||||||||||||||||||||||||||||||||||||||||||||||||||||||||||||||||||||||||||||||||||||||||||||||||||||||||||||||||||
| Dataseries X: | |||||||||||||||||||||||||||||||||||||||||||||||||||||||||||||||||||||||||||||||||||||||||||||||||||||||||||||||||||||||||||||||||||||||||||||||||||||||||||||||||||||||||||||||||||||||||
'A' 'A' 'B' 'B' 'A' 'C' 'A' 'C' 'D' 'B' 'D' 'A' 'D' 'C' 'D' 'B' 'B' 'A' 'A' 'A' 'B' 'D' 'A' 'B' 'A' 'D' 'B' 'A' 'B' 'B' 'B' 'C' 'B' 'B' 'B' 'D' 'A' 'A' 'B' 'B' 'A' 'D' 'A' 'D' 'B' 'B' 'A' 'D' 'A' 'B' 'D' 'A' 'A' 'A' 'A' 'A' 'C' 'A' 'A' 'D' 'C' 'C' 'B' 'A' 'B' 'C' 'B' 'A' 'A' 'A' 'A' 'C' 'A' 'A' 'B' 'D' 'C' 'C' 'A' 'B' 'C' 'C' 'A' 'D' 'D' 'D' 'D' 'A' 'A' 'A' 'B' 'B' 'A' 'A' 'D' 'A' 'A' 'C' 'A' 'C' 'A' 'C' 'D' 'D' 'B' 'B' 'A' 'C' 'C' 'A' 'B' 'A' 'C' 'C' 'B' 'A' 'B' 'C' 'D' 'B' 'D' 'D' 'A' 'D' 'D' 'C' 'C' 'A' 'A' 'D' 'A' 'D' 'B' 'A' 'B' 'C' 'B' 'D' 'B' 'B' 'C' 'C' 'A' 'D' 'D' 'D' 'D' 'A' 'B' 'C' 'B' 'B' 'D' 'D' 'A' 'D' 'B' 'C' 'C' 'D' 'A' 'C' 'B' 'D' 'B' 'C' 'A' 'A' 'A' 'C' 'A' 'D' 'B' 'C' 'D' 'A' 'A' 'D' 'D' 'C' 'A' 'B' 'D' 'B' 'A' 'A' 'B' 'D' 'C' 'B' 'B' 'C' 'B' 'A' 'A' 'A' 'A' 'C' 'C' 'C' 'C' 'A' 'A' 'D' 'C' 'D' 'B' 'A' 'C' 'C' 'D' 'A' 'B' 'A' 'D' 'A' 'C' 'C' 'D' 'C' 'A' 'C' 'B' 'B' 'A' 'B' 'A' 'B' 'D' 'B' 'B' 'D' 'A' 'B' 'D' 'D' 'B' 'B' 'D' 'A' 'D' 'D' 'D' 'A' 'A' 'B' 'C' 'B' 'B' 'B' 'D' 'B' 'D' 'B' 'B' 'A' 'B' 'D' 'B' 'B' 'B' 'A' 'D' 'C' 'B' 'B' 'D' 'A' 'D' 'D' 'D' 'B' 'A' 'A' 'B' 'B' 'B' 'A' 'B' 'A' 'A' 'B' 'B' 'B' 'D' 'A' 'A' 'A' 'B' 'A' 'B' 'B' 'A' 'A' 'B' 'D' 'B' 'D' 'C' 'C' 'A' 'D' 'D' 'A' 'A' 'A' 'A' 'B' 'B' 'D' 'C' 'A' 'D' 'D' 'B' 'B' 'A' 'D' 'C' 'D' 'C' 'B' 'B' 'C' 'A' 'A' 'A' 'D' 'B' 'A' 'B' 'D' 'A' 'C' 'A' 'B' 'C' 'B' 'B' 'B' 'C' 'D' 'B' 'B' 'A' 'A' 'B' 'B' 'C' 'B' 'B' 'B' 'D' 'C' 'C' 'A' 'C' 'C' 'D' 'A' 'D' 'B' 'A' 'B' 'B' 'C' 'C' 'A' 'B' 'A' 'B' 'B' 'C' 'D' 'B' 'A' 'D' 'D' 'C' 'D' 'A' 'B' 'A' 'C' 'A' 'B' 'D' 'A' 'B' 'D' 'B' 'C' 'A' 'B' 'A' 'C' 'C' 'B' 'B' 'D' 'A' 'B' 'A' 'D' 'A' 'B' 'D' 'A' 'B' 'A' 'A' 'B' 'C' 'D' 'D' 'C' 'C' 'A' 'B' 'A' 'A' 'C' 'D' 'A' 'A' 'B' 'A' 'C' 'A' 'A' 'B' 'A' 'B' 'B' 'D' 'A' 'A' 'A' 'D' 'A' 'D' 'B' 'B' 'A' 'D' 'C' 'D' 'A' 'C' 'A' 'C' 'C' 'C' 'C' 'B' 'A' 'A' 'B' 'A' 'B' 'A' 'C' 'A' 'D' 'C' 'A' 'B' 'A' 'B' 'A' 'B' 'B' 'C' 'B' 'B' 'D' 'A' 'B' 'B' 'A' 'C' 'A' 'D' 'A' 'D' 'D' 'B' 'A' 'A' 'A' 'B' 'C' 'A' 'A' 'B' 'D' 'C' 'D' 'B' 'C' 'D' 'C' 'C' 'C' 'A' 'C' 'A' 'D' 'A' 'A' 'A' 'D' 'C' 'B' 'A' 'C' 'B' 'C' 'B' 'B' 'C' 'C' 'C' 'C' 'D' 'C' 'D' 'A' 'A' 'A' 'B' 'D' 'D' 'D' 'B' 'A' 'A' 'A' 'B' 'B' 'C' 'D' 'A' 'A' 'D' 'D' 'D' 'A' 'B' 'B' 'B' 'A' 'D' 'B' 'D' 'A' 'B' 'B' 'B' 'C' 'D' 'B' 'C' 'B' 'C' 'B' 'B' 'D' 'D' 'B' 'A' 'A' 'D' 'B' 'B' 'B' 'D' 'D' 'B' 'B' 'A' 'D' 'A' 'C' 'C' 'D' 'A' 'B' 'B' 'B' 'D' 'B' 'C' 'D' 'D' 'C' 'B' 'C' 'D' 'A' 'A' 'A' 'A' 'B' 'A' 'A' 'C' 'A' 'B' 'A' 'A' 'D' 'B' 'A' 'D' 'B' 'B' 'B' 'D' 'A' 'C' 'D' 'C' 'A' 'B' 'C' 'C' 'A' 'C' 'A' 'B' 'A' 'C' 'B' 'A' 'C' 'B' 'C' 'C' 'D' 'C' 'B' 'D' 'A' 'B' 'B' 'C' 'A' | |||||||||||||||||||||||||||||||||||||||||||||||||||||||||||||||||||||||||||||||||||||||||||||||||||||||||||||||||||||||||||||||||||||||||||||||||||||||||||||||||||||||||||||||||||||||||
Tables (Output of Computation) | |||||||||||||||||||||||||||||||||||||||||||||||||||||||||||||||||||||||||||||||||||||||||||||||||||||||||||||||||||||||||||||||||||||||||||||||||||||||||||||||||||||||||||||||||||||||||
| |||||||||||||||||||||||||||||||||||||||||||||||||||||||||||||||||||||||||||||||||||||||||||||||||||||||||||||||||||||||||||||||||||||||||||||||||||||||||||||||||||||||||||||||||||||||||
Figures (Output of Computation) | |||||||||||||||||||||||||||||||||||||||||||||||||||||||||||||||||||||||||||||||||||||||||||||||||||||||||||||||||||||||||||||||||||||||||||||||||||||||||||||||||||||||||||||||||||||||||
Input Parameters & R Code | |||||||||||||||||||||||||||||||||||||||||||||||||||||||||||||||||||||||||||||||||||||||||||||||||||||||||||||||||||||||||||||||||||||||||||||||||||||||||||||||||||||||||||||||||||||||||
| Parameters (Session): | |||||||||||||||||||||||||||||||||||||||||||||||||||||||||||||||||||||||||||||||||||||||||||||||||||||||||||||||||||||||||||||||||||||||||||||||||||||||||||||||||||||||||||||||||||||||||
| par1 = 1 ; par2 = 3 ; par3 = Pearson Chi-Squared ; | |||||||||||||||||||||||||||||||||||||||||||||||||||||||||||||||||||||||||||||||||||||||||||||||||||||||||||||||||||||||||||||||||||||||||||||||||||||||||||||||||||||||||||||||||||||||||
| Parameters (R input): | |||||||||||||||||||||||||||||||||||||||||||||||||||||||||||||||||||||||||||||||||||||||||||||||||||||||||||||||||||||||||||||||||||||||||||||||||||||||||||||||||||||||||||||||||||||||||
| par1 = 1 ; par2 = 3 ; par3 = Pearson Chi-Squared ; | |||||||||||||||||||||||||||||||||||||||||||||||||||||||||||||||||||||||||||||||||||||||||||||||||||||||||||||||||||||||||||||||||||||||||||||||||||||||||||||||||||||||||||||||||||||||||
| R code (references can be found in the software module): | |||||||||||||||||||||||||||||||||||||||||||||||||||||||||||||||||||||||||||||||||||||||||||||||||||||||||||||||||||||||||||||||||||||||||||||||||||||||||||||||||||||||||||||||||||||||||
library(vcd) | |||||||||||||||||||||||||||||||||||||||||||||||||||||||||||||||||||||||||||||||||||||||||||||||||||||||||||||||||||||||||||||||||||||||||||||||||||||||||||||||||||||||||||||||||||||||||