| ANOVA Model | ||||||||
| Response ~ Treatment_A * Treatment_B | ||||||||
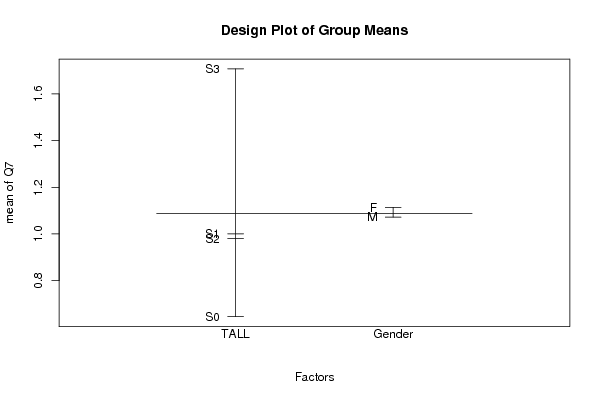
| means | 0 | 1.111 | 1.181 | 1.25 | 0.714 | -0.916 | -1.067 | 0.125 |
| ANOVA Statistics | |||||
| Df | Sum Sq | Mean Sq | F value | Pr(>F) | |
| 3 | |||||
| Treatment_A | 3 | 142.547 | 47.516 | 4.966 | 0.002 |
| Treatment_B | 3 | 2.862 | 2.862 | 0.299 | 0.585 |
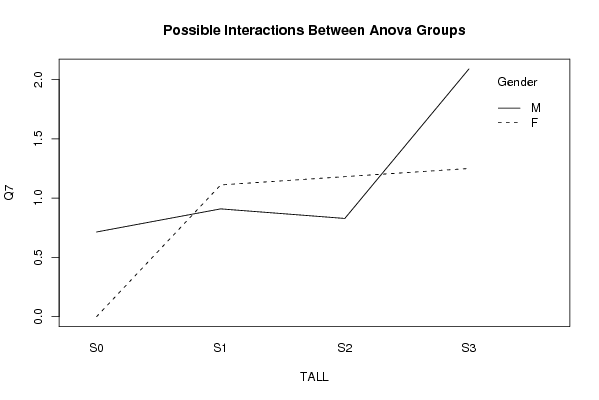
| Treatment_A:Treatment_B | 3 | 61.665 | 20.555 | 2.148 | 0.093 |
| Residuals | 1031 | 9863.955 | 9.567 | ||
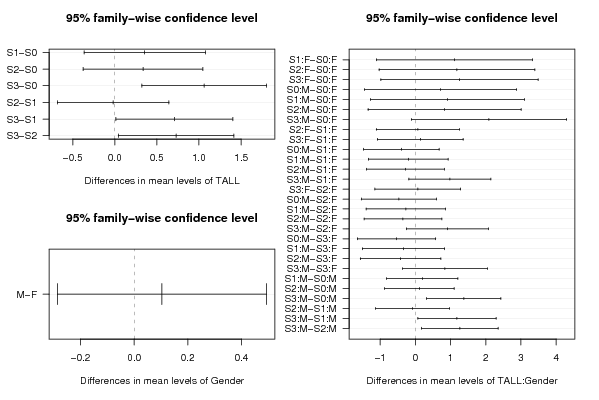
| Tukey Honest Significant Difference Comparisons | ||||
| diff | lwr | upr | p adj | |
| S1-S0 | 0.355 | -0.365 | 1.075 | 0.583 |
| S2-S0 | 0.335 | -0.377 | 1.046 | 0.62 |
| S3-S0 | 1.062 | 0.321 | 1.803 | 0.001 |
| S2-S1 | -0.02 | -0.684 | 0.643 | 1 |
| S3-S1 | 0.707 | 0.012 | 1.403 | 0.045 |
| S3-S2 | 0.728 | 0.041 | 1.414 | 0.033 |
| M-F | 0.104 | -0.286 | 0.494 | 0.601 |
| S1:F-S0:F | 1.111 | -1.103 | 3.325 | 0.794 |
| S2:F-S0:F | 1.181 | -1.032 | 3.394 | 0.738 |
| S3:F-S0:F | 1.25 | -0.984 | 3.484 | 0.688 |
| S0:M-S0:F | 0.714 | -1.443 | 2.871 | 0.974 |
| S1:M-S0:F | 0.909 | -1.276 | 3.094 | 0.912 |
| S2:M-S0:F | 0.828 | -1.345 | 3.002 | 0.944 |
| S3:M-S0:F | 2.09 | -0.115 | 4.294 | 0.078 |
| S2:F-S1:F | 0.07 | -1.111 | 1.251 | 1 |
| S3:F-S1:F | 0.139 | -1.081 | 1.359 | 1 |
| S0:M-S1:F | -0.397 | -1.47 | 0.676 | 0.952 |
| S1:M-S1:F | -0.202 | -1.331 | 0.926 | 0.999 |
| S2:M-S1:F | -0.283 | -1.388 | 0.823 | 0.994 |
| S3:M-S1:F | 0.978 | -0.187 | 2.144 | 0.176 |
| S3:F-S2:F | 0.069 | -1.149 | 1.287 | 1 |
| S0:M-S2:F | -0.467 | -1.537 | 0.603 | 0.889 |
| S1:M-S2:F | -0.272 | -1.398 | 0.854 | 0.996 |
| S2:M-S2:F | -0.353 | -1.456 | 0.751 | 0.978 |
| S3:M-S2:F | 0.908 | -0.255 | 2.072 | 0.257 |
| S0:M-S3:F | -0.536 | -1.648 | 0.577 | 0.827 |
| S1:M-S3:F | -0.341 | -1.508 | 0.826 | 0.987 |
| S2:M-S3:F | -0.422 | -1.566 | 0.723 | 0.953 |
| S3:M-S3:F | 0.84 | -0.363 | 2.042 | 0.403 |
| S1:M-S0:M | 0.195 | -0.817 | 1.206 | 0.999 |
| S2:M-S0:M | 0.114 | -0.872 | 1.1 | 1 |
| S3:M-S0:M | 1.375 | 0.322 | 2.428 | 0.002 |
| S2:M-S1:M | -0.081 | -1.127 | 0.966 | 1 |
| S3:M-S1:M | 1.18 | 0.071 | 2.29 | 0.028 |
| S3:M-S2:M | 1.261 | 0.175 | 2.348 | 0.01 |
| Levenes Test for Homogeneity of Variance | |||
| Df | F value | Pr(>F) | |
| Group | 7 | 3.092 | 0.003 |
| 1031 | |||