| Tabulation of Results | ||
| A x B | ||
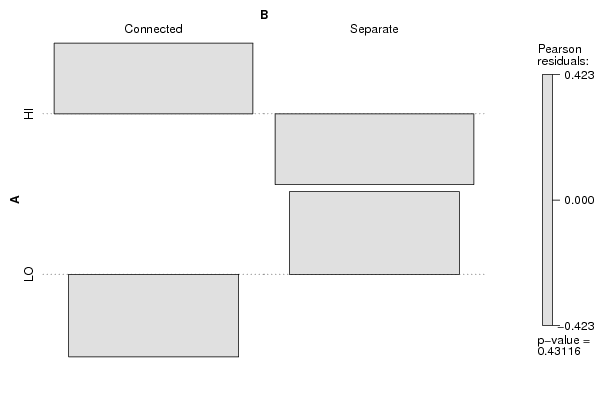
| Connected | Separate | HI | 97 | 90 | LO | 65 | 72 |
| Tabulation of Expected Results | ||
| A x B | ||
| Connected | Separate | HI | 93.5 | 93.5 | LO | 68.5 | 68.5 |
| Statistical Results | |
| Pearson's Chi-squared test with Yates' continuity correction | |
| Chi Square Statistic | 0.46 |
| Degrees of Freedom | 1 |
| P value | 0.5 |