Free Statistics

of Irreproducible Research!

Author's title

Author*Unverified author*
R Software Modulerwasp_univariatedataseries.wasp
Title produced by softwareUnivariate Data Series
Date of computationMon, 31 May 2010 16:32:26 +0000
Cite this page as followsStatistical Computations at FreeStatistics.org, Office for Research Development and Education, URL https://freestatistics.org/blog/index.php?v=date/2010/May/31/t1275323567beai7o1hxrf4f1u.htm/, Retrieved Mon, 29 Apr 2024 16:25:36 +0000
Statistical Computations at FreeStatistics.org, Office for Research Development and Education, URL https://freestatistics.org/blog/index.php?pk=76762, Retrieved Mon, 29 Apr 2024 16:25:36 +0000
QR Codes:

Original text written by user:
IsPrivate?No (this computation is public)
User-defined keywordsKDGP1W1
Estimated Impact130
Family? (F = Feedback message, R = changed R code, M = changed R Module, P = changed Parameters, D = changed Data)
-       [Univariate Data Series] [] [2010-05-31 16:32:26] [f0cd0ad4d4cb2a25864ed1f6cd7bfd87] [Current]
Feedback Forum

Post a new message
Dataseries X:
7089
77102
35123
23109
11115
48105
7896
79102
2494
76101
9484
8183
9092
49109
27127
31116
77120
80115
67117
18110
3099
3105
5786
7387
5089
288
65108
44100
68102
8798
8183
288
3680
9374
2271
4671
3466
8068
2780
9883
6479
3373
6468
460
5553
6157
2345
3744
6144
9948
2049
9549
6049
745
9643
9938
5535
6932
1827
9726
7624
9529
7631
6132
7534
2137
8738
8836
3230
633
9126
123


Summary of computational transaction
Raw Inputview raw input (R code)
Raw Outputview raw output of R engine
Computing time4 seconds
R Server'George Udny Yule' @ 72.249.76.132

\begin{tabular}{lllllllll}
\hline
Summary of computational transaction \tabularnewline
Raw Input & view raw input (R code)  \tabularnewline
Raw Output & view raw output of R engine  \tabularnewline
Computing time & 4 seconds \tabularnewline
R Server & 'George Udny Yule' @ 72.249.76.132 \tabularnewline
\hline
\end{tabular}
%Source: https://freestatistics.org/blog/index.php?pk=76762&T=0

[TABLE]
[ROW][C]Summary of computational transaction[/C][/ROW]
[ROW][C]Raw Input[/C][C]view raw input (R code) [/C][/ROW]
[ROW][C]Raw Output[/C][C]view raw output of R engine [/C][/ROW]
[ROW][C]Computing time[/C][C]4 seconds[/C][/ROW]
[ROW][C]R Server[/C][C]'George Udny Yule' @ 72.249.76.132[/C][/ROW]
[/TABLE]
Source: https://freestatistics.org/blog/index.php?pk=76762&T=0

Globally Unique Identifier (entire table): ba.freestatistics.org/blog/index.php?pk=76762&T=0

As an alternative you can also use a QR Code:  

The GUIDs for individual cells are displayed in the table below:

Summary of computational transaction
Raw Inputview raw input (R code)
Raw Outputview raw output of R engine
Computing time4 seconds
R Server'George Udny Yule' @ 72.249.76.132


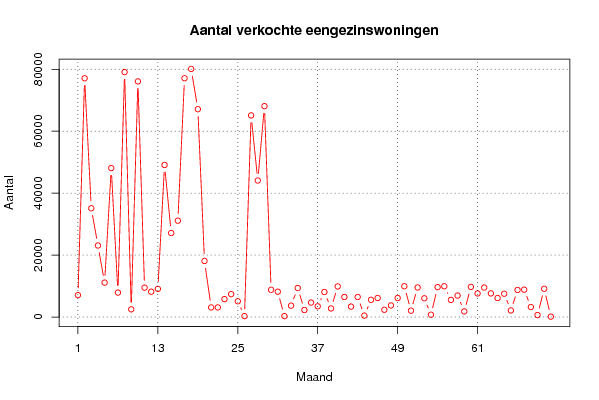
Univariate Dataseries
Name of dataseriesEengezinswoningen
Sourcewww.economagic.com
Descriptionaantal verkochte eengezinswoningen
Number of observations72

\begin{tabular}{lllllllll}
\hline
Univariate Dataseries \tabularnewline
Name of dataseries & Eengezinswoningen \tabularnewline
Source & www.economagic.com \tabularnewline
Description & aantal verkochte eengezinswoningen \tabularnewline
Number of observations & 72 \tabularnewline
\hline
\end{tabular}
%Source: https://freestatistics.org/blog/index.php?pk=76762&T=1

[TABLE]
[ROW][C]Univariate Dataseries[/C][/ROW]
[ROW][C]Name of dataseries[/C][C]Eengezinswoningen[/C][/ROW]
[ROW][C]Source[/C][C]www.economagic.com[/C][/ROW]
[ROW][C]Description[/C][C]aantal verkochte eengezinswoningen[/C][/ROW]
[ROW][C]Number of observations[/C][C]72[/C][/ROW]
[/TABLE]
Source: https://freestatistics.org/blog/index.php?pk=76762&T=1

Globally Unique Identifier (entire table): ba.freestatistics.org/blog/index.php?pk=76762&T=1

As an alternative you can also use a QR Code:  

The GUIDs for individual cells are displayed in the table below:

Univariate Dataseries
Name of dataseriesEengezinswoningen
Sourcewww.economagic.com
Descriptionaantal verkochte eengezinswoningen
Number of observations72


Parameters (Session):
par1 = Eengezinswoningen ; par2 = www.economagic.com ; par3 = aantal verkochte eengezinswoningen ; par4 = 12 ;
Parameters (R input):
par1 = Eengezinswoningen ; par2 = www.economagic.com ; par3 = aantal verkochte eengezinswoningen ; par4 = 12 ;
R code (references can be found in the software module):
if (par4 != 'No season') {
par4 <- as.numeric(par4)
if (par4 < 4) par4 <- 12
}
summary(x)
n <- length(x)
bitmap(file='test1.png')
if (par4=='No season') {
plot(x,col=2,type='b',main=main,xlab=xlab,ylab=ylab,xaxt='n')
axis(1,at=seq(1,n,10))
}
if (par4!='No season') {
plot(x,col=2,type='b',main=main,xlab=xlab,ylab=ylab,xaxt='n')
axis(1,at=seq(1,n,par4))
grid(nx=0,ny=NULL,col='black')
abline(v=seq(1,n,par4),col='black',lty='dotted')
}
dev.off()
load(file='createtable')
a<-table.start()
a<-table.row.start(a)
a<-table.element(a,'Univariate Dataseries',2,TRUE)
a<-table.row.end(a)
a<-table.row.start(a)
a<-table.element(a,'Name of dataseries',header=TRUE)
a<-table.element(a,par1)
a<-table.row.end(a)
a<-table.row.start(a)
a<-table.element(a,'Source',header=TRUE)
a<-table.element(a,par2)
a<-table.row.end(a)
a<-table.row.start(a)
a<-table.element(a,'Description',header=TRUE)
a<-table.element(a,par3)
a<-table.row.end(a)
a<-table.row.start(a)
a<-table.element(a,'Number of observations',header=TRUE)
a<-table.element(a,length(x))
a<-table.row.end(a)
a<-table.end(a)
table.save(a,file='mytable.tab')