Free Statistics

of Irreproducible Research!

Author's title

Author*Unverified author*
R Software Modulerwasp_autocorrelation.wasp
Title produced by software(Partial) Autocorrelation Function
Date of computationSat, 29 May 2010 12:27:12 +0000
Cite this page as followsStatistical Computations at FreeStatistics.org, Office for Research Development and Education, URL https://freestatistics.org/blog/index.php?v=date/2010/May/29/t1275136137apng1fi3xjp6t1v.htm/, Retrieved Sun, 28 Apr 2024 08:04:24 +0000
Statistical Computations at FreeStatistics.org, Office for Research Development and Education, URL https://freestatistics.org/blog/index.php?pk=76665, Retrieved Sun, 28 Apr 2024 08:04:24 +0000
QR Codes:

Original text written by user:
IsPrivate?No (this computation is public)
User-defined keywordsKDGP2W21
Estimated Impact184
Family? (F = Feedback message, R = changed R code, M = changed R Module, P = changed Parameters, D = changed Data)
-       [(Partial) Autocorrelation Function] [] [2010-05-29 12:27:12] [ed2dbf507cd6f620c6fb9fcab91c23a9] [Current]
Feedback Forum

Post a new message
Dataseries X:
1954
2302
3054
2414
2226
2725
2589
3470
2400
3180
4009
3924
2072
2434
2956
2828
2687
2629
3150
4119
3030
3055
3821
4001
2529
2472
3134
2789
2758
2993
3282
3437
2804
3076
3782
3889
2271
2452
3084
2522
2769
3438
2839
3746
2632
2851
3871
3618
2389
2344
2678
2492
2858
2246
2800
3869
3007
3023
3907
4209
2353
2570
2903
2910
3782
2759
2931
3641
2794
3070
3576
4106
2452
2206
2488
2416
2534
2521
3093
3903
2907
3025
3812
4209
2138
2419
2622
2912
2708
2798
3254
2895
3263
3736
4077
4097
2175
3138
2823
2498
2822
2738
4137
3515
3785
3632
4504
4451
2550
2867
3458
2961
3163
2880
3331
3062
3534
3622
4464
5411
2564
2820
3508
3088
3299
2939
3320
3418
3604
3495
4163
4882
2211
3260
2992
2425
2707
3244
3965
3315
3333
3583
4021
4904
2252
2952
3573
3048
3059
2731
3563
3092
3478
3478
4308
5029
2075
3264
3308
3688
3136
2824
3644
4694
2914
3686
4358
5587
2265
3685
3754
3708
3210
3517
3905
3670
4221
4404
5086
5725
2367
3819
4067
4022
3937
4365
4290


Summary of computational transaction
Raw Inputview raw input (R code)
Raw Outputview raw output of R engine
Computing time1 seconds
R Server'George Udny Yule' @ 72.249.76.132

\begin{tabular}{lllllllll}
\hline
Summary of computational transaction \tabularnewline
Raw Input & view raw input (R code)  \tabularnewline
Raw Output & view raw output of R engine  \tabularnewline
Computing time & 1 seconds \tabularnewline
R Server & 'George Udny Yule' @ 72.249.76.132 \tabularnewline
\hline
\end{tabular}
%Source: https://freestatistics.org/blog/index.php?pk=76665&T=0

[TABLE]
[ROW][C]Summary of computational transaction[/C][/ROW]
[ROW][C]Raw Input[/C][C]view raw input (R code) [/C][/ROW]
[ROW][C]Raw Output[/C][C]view raw output of R engine [/C][/ROW]
[ROW][C]Computing time[/C][C]1 seconds[/C][/ROW]
[ROW][C]R Server[/C][C]'George Udny Yule' @ 72.249.76.132[/C][/ROW]
[/TABLE]
Source: https://freestatistics.org/blog/index.php?pk=76665&T=0

Globally Unique Identifier (entire table): ba.freestatistics.org/blog/index.php?pk=76665&T=0

As an alternative you can also use a QR Code:  

The GUIDs for individual cells are displayed in the table below:

Summary of computational transaction
Raw Inputview raw input (R code)
Raw Outputview raw output of R engine
Computing time1 seconds
R Server'George Udny Yule' @ 72.249.76.132


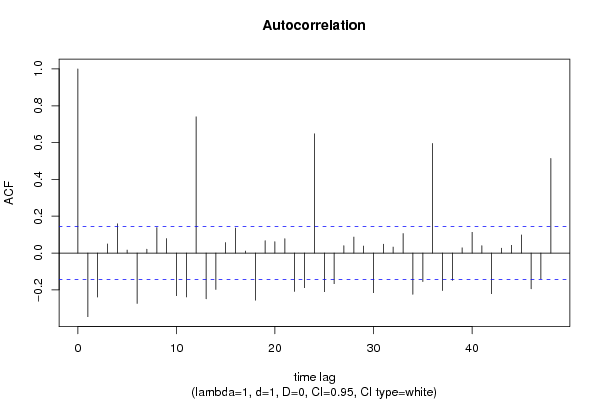
Autocorrelation Function
Time lag kACF(k)T-STATP-value
1-0.345728-4.71512e-06
2-0.23915-3.26160.000659
30.0491750.67070.251636
40.1589952.16840.015699
50.0162310.22140.412526
6-0.273607-3.73150.000126
70.0205540.28030.389773
80.1384991.88890.030232
90.07861.0720.142563
10-0.232159-3.16620.000902
11-0.238476-3.25240.000679
120.74031910.09660
13-0.249138-3.39780.000415
14-0.198222-2.70340.00375
150.0568920.77590.219396
160.1354711.84760.033126
170.0109260.1490.440855
18-0.25638-3.49660.000295
190.0671970.91640.180311
200.0615390.83930.201194
210.0778851.06220.144758
22-0.208444-2.84280.002486
23-0.18832-2.56830.005502
240.6477518.83410
25-0.210286-2.86790.002305
26-0.166532-2.27120.01214
270.0396990.54140.294431
280.0865081.17980.119791
290.0375920.51270.304391
30-0.215488-2.93890.001856
310.0481420.65660.256136
320.0321070.43790.330989
330.1059221.44460.075129
34-0.224695-3.06440.001253
35-0.15526-2.11750.017775
360.5950828.11580
37-0.203901-2.78080.00299
38-0.14848-2.0250.022149
390.0282350.38510.35031
400.1123351.5320.063605
410.0399350.54460.293327
42-0.221144-3.0160.00146
430.0262070.35740.360594
440.0421680.57510.282959
450.097981.33630.091546
46-0.194599-2.6540.004322
47-0.140357-1.91420.028564
480.513777.00690

\begin{tabular}{lllllllll}
\hline
Autocorrelation Function \tabularnewline
Time lag k & ACF(k) & T-STAT & P-value \tabularnewline
1 & -0.345728 & -4.7151 & 2e-06 \tabularnewline
2 & -0.23915 & -3.2616 & 0.000659 \tabularnewline
3 & 0.049175 & 0.6707 & 0.251636 \tabularnewline
4 & 0.158995 & 2.1684 & 0.015699 \tabularnewline
5 & 0.016231 & 0.2214 & 0.412526 \tabularnewline
6 & -0.273607 & -3.7315 & 0.000126 \tabularnewline
7 & 0.020554 & 0.2803 & 0.389773 \tabularnewline
8 & 0.138499 & 1.8889 & 0.030232 \tabularnewline
9 & 0.0786 & 1.072 & 0.142563 \tabularnewline
10 & -0.232159 & -3.1662 & 0.000902 \tabularnewline
11 & -0.238476 & -3.2524 & 0.000679 \tabularnewline
12 & 0.740319 & 10.0966 & 0 \tabularnewline
13 & -0.249138 & -3.3978 & 0.000415 \tabularnewline
14 & -0.198222 & -2.7034 & 0.00375 \tabularnewline
15 & 0.056892 & 0.7759 & 0.219396 \tabularnewline
16 & 0.135471 & 1.8476 & 0.033126 \tabularnewline
17 & 0.010926 & 0.149 & 0.440855 \tabularnewline
18 & -0.25638 & -3.4966 & 0.000295 \tabularnewline
19 & 0.067197 & 0.9164 & 0.180311 \tabularnewline
20 & 0.061539 & 0.8393 & 0.201194 \tabularnewline
21 & 0.077885 & 1.0622 & 0.144758 \tabularnewline
22 & -0.208444 & -2.8428 & 0.002486 \tabularnewline
23 & -0.18832 & -2.5683 & 0.005502 \tabularnewline
24 & 0.647751 & 8.8341 & 0 \tabularnewline
25 & -0.210286 & -2.8679 & 0.002305 \tabularnewline
26 & -0.166532 & -2.2712 & 0.01214 \tabularnewline
27 & 0.039699 & 0.5414 & 0.294431 \tabularnewline
28 & 0.086508 & 1.1798 & 0.119791 \tabularnewline
29 & 0.037592 & 0.5127 & 0.304391 \tabularnewline
30 & -0.215488 & -2.9389 & 0.001856 \tabularnewline
31 & 0.048142 & 0.6566 & 0.256136 \tabularnewline
32 & 0.032107 & 0.4379 & 0.330989 \tabularnewline
33 & 0.105922 & 1.4446 & 0.075129 \tabularnewline
34 & -0.224695 & -3.0644 & 0.001253 \tabularnewline
35 & -0.15526 & -2.1175 & 0.017775 \tabularnewline
36 & 0.595082 & 8.1158 & 0 \tabularnewline
37 & -0.203901 & -2.7808 & 0.00299 \tabularnewline
38 & -0.14848 & -2.025 & 0.022149 \tabularnewline
39 & 0.028235 & 0.3851 & 0.35031 \tabularnewline
40 & 0.112335 & 1.532 & 0.063605 \tabularnewline
41 & 0.039935 & 0.5446 & 0.293327 \tabularnewline
42 & -0.221144 & -3.016 & 0.00146 \tabularnewline
43 & 0.026207 & 0.3574 & 0.360594 \tabularnewline
44 & 0.042168 & 0.5751 & 0.282959 \tabularnewline
45 & 0.09798 & 1.3363 & 0.091546 \tabularnewline
46 & -0.194599 & -2.654 & 0.004322 \tabularnewline
47 & -0.140357 & -1.9142 & 0.028564 \tabularnewline
48 & 0.51377 & 7.0069 & 0 \tabularnewline
\hline
\end{tabular}
%Source: https://freestatistics.org/blog/index.php?pk=76665&T=1

[TABLE]
[ROW][C]Autocorrelation Function[/C][/ROW]
[ROW][C]Time lag k[/C][C]ACF(k)[/C][C]T-STAT[/C][C]P-value[/C][/ROW]
[ROW][C]1[/C][C]-0.345728[/C][C]-4.7151[/C][C]2e-06[/C][/ROW]
[ROW][C]2[/C][C]-0.23915[/C][C]-3.2616[/C][C]0.000659[/C][/ROW]
[ROW][C]3[/C][C]0.049175[/C][C]0.6707[/C][C]0.251636[/C][/ROW]
[ROW][C]4[/C][C]0.158995[/C][C]2.1684[/C][C]0.015699[/C][/ROW]
[ROW][C]5[/C][C]0.016231[/C][C]0.2214[/C][C]0.412526[/C][/ROW]
[ROW][C]6[/C][C]-0.273607[/C][C]-3.7315[/C][C]0.000126[/C][/ROW]
[ROW][C]7[/C][C]0.020554[/C][C]0.2803[/C][C]0.389773[/C][/ROW]
[ROW][C]8[/C][C]0.138499[/C][C]1.8889[/C][C]0.030232[/C][/ROW]
[ROW][C]9[/C][C]0.0786[/C][C]1.072[/C][C]0.142563[/C][/ROW]
[ROW][C]10[/C][C]-0.232159[/C][C]-3.1662[/C][C]0.000902[/C][/ROW]
[ROW][C]11[/C][C]-0.238476[/C][C]-3.2524[/C][C]0.000679[/C][/ROW]
[ROW][C]12[/C][C]0.740319[/C][C]10.0966[/C][C]0[/C][/ROW]
[ROW][C]13[/C][C]-0.249138[/C][C]-3.3978[/C][C]0.000415[/C][/ROW]
[ROW][C]14[/C][C]-0.198222[/C][C]-2.7034[/C][C]0.00375[/C][/ROW]
[ROW][C]15[/C][C]0.056892[/C][C]0.7759[/C][C]0.219396[/C][/ROW]
[ROW][C]16[/C][C]0.135471[/C][C]1.8476[/C][C]0.033126[/C][/ROW]
[ROW][C]17[/C][C]0.010926[/C][C]0.149[/C][C]0.440855[/C][/ROW]
[ROW][C]18[/C][C]-0.25638[/C][C]-3.4966[/C][C]0.000295[/C][/ROW]
[ROW][C]19[/C][C]0.067197[/C][C]0.9164[/C][C]0.180311[/C][/ROW]
[ROW][C]20[/C][C]0.061539[/C][C]0.8393[/C][C]0.201194[/C][/ROW]
[ROW][C]21[/C][C]0.077885[/C][C]1.0622[/C][C]0.144758[/C][/ROW]
[ROW][C]22[/C][C]-0.208444[/C][C]-2.8428[/C][C]0.002486[/C][/ROW]
[ROW][C]23[/C][C]-0.18832[/C][C]-2.5683[/C][C]0.005502[/C][/ROW]
[ROW][C]24[/C][C]0.647751[/C][C]8.8341[/C][C]0[/C][/ROW]
[ROW][C]25[/C][C]-0.210286[/C][C]-2.8679[/C][C]0.002305[/C][/ROW]
[ROW][C]26[/C][C]-0.166532[/C][C]-2.2712[/C][C]0.01214[/C][/ROW]
[ROW][C]27[/C][C]0.039699[/C][C]0.5414[/C][C]0.294431[/C][/ROW]
[ROW][C]28[/C][C]0.086508[/C][C]1.1798[/C][C]0.119791[/C][/ROW]
[ROW][C]29[/C][C]0.037592[/C][C]0.5127[/C][C]0.304391[/C][/ROW]
[ROW][C]30[/C][C]-0.215488[/C][C]-2.9389[/C][C]0.001856[/C][/ROW]
[ROW][C]31[/C][C]0.048142[/C][C]0.6566[/C][C]0.256136[/C][/ROW]
[ROW][C]32[/C][C]0.032107[/C][C]0.4379[/C][C]0.330989[/C][/ROW]
[ROW][C]33[/C][C]0.105922[/C][C]1.4446[/C][C]0.075129[/C][/ROW]
[ROW][C]34[/C][C]-0.224695[/C][C]-3.0644[/C][C]0.001253[/C][/ROW]
[ROW][C]35[/C][C]-0.15526[/C][C]-2.1175[/C][C]0.017775[/C][/ROW]
[ROW][C]36[/C][C]0.595082[/C][C]8.1158[/C][C]0[/C][/ROW]
[ROW][C]37[/C][C]-0.203901[/C][C]-2.7808[/C][C]0.00299[/C][/ROW]
[ROW][C]38[/C][C]-0.14848[/C][C]-2.025[/C][C]0.022149[/C][/ROW]
[ROW][C]39[/C][C]0.028235[/C][C]0.3851[/C][C]0.35031[/C][/ROW]
[ROW][C]40[/C][C]0.112335[/C][C]1.532[/C][C]0.063605[/C][/ROW]
[ROW][C]41[/C][C]0.039935[/C][C]0.5446[/C][C]0.293327[/C][/ROW]
[ROW][C]42[/C][C]-0.221144[/C][C]-3.016[/C][C]0.00146[/C][/ROW]
[ROW][C]43[/C][C]0.026207[/C][C]0.3574[/C][C]0.360594[/C][/ROW]
[ROW][C]44[/C][C]0.042168[/C][C]0.5751[/C][C]0.282959[/C][/ROW]
[ROW][C]45[/C][C]0.09798[/C][C]1.3363[/C][C]0.091546[/C][/ROW]
[ROW][C]46[/C][C]-0.194599[/C][C]-2.654[/C][C]0.004322[/C][/ROW]
[ROW][C]47[/C][C]-0.140357[/C][C]-1.9142[/C][C]0.028564[/C][/ROW]
[ROW][C]48[/C][C]0.51377[/C][C]7.0069[/C][C]0[/C][/ROW]
[/TABLE]
Source: https://freestatistics.org/blog/index.php?pk=76665&T=1

Globally Unique Identifier (entire table): ba.freestatistics.org/blog/index.php?pk=76665&T=1

As an alternative you can also use a QR Code:  

The GUIDs for individual cells are displayed in the table below:

Autocorrelation Function
Time lag kACF(k)T-STATP-value
1-0.345728-4.71512e-06
2-0.23915-3.26160.000659
30.0491750.67070.251636
40.1589952.16840.015699
50.0162310.22140.412526
6-0.273607-3.73150.000126
70.0205540.28030.389773
80.1384991.88890.030232
90.07861.0720.142563
10-0.232159-3.16620.000902
11-0.238476-3.25240.000679
120.74031910.09660
13-0.249138-3.39780.000415
14-0.198222-2.70340.00375
150.0568920.77590.219396
160.1354711.84760.033126
170.0109260.1490.440855
18-0.25638-3.49660.000295
190.0671970.91640.180311
200.0615390.83930.201194
210.0778851.06220.144758
22-0.208444-2.84280.002486
23-0.18832-2.56830.005502
240.6477518.83410
25-0.210286-2.86790.002305
26-0.166532-2.27120.01214
270.0396990.54140.294431
280.0865081.17980.119791
290.0375920.51270.304391
30-0.215488-2.93890.001856
310.0481420.65660.256136
320.0321070.43790.330989
330.1059221.44460.075129
34-0.224695-3.06440.001253
35-0.15526-2.11750.017775
360.5950828.11580
37-0.203901-2.78080.00299
38-0.14848-2.0250.022149
390.0282350.38510.35031
400.1123351.5320.063605
410.0399350.54460.293327
42-0.221144-3.0160.00146
430.0262070.35740.360594
440.0421680.57510.282959
450.097981.33630.091546
46-0.194599-2.6540.004322
47-0.140357-1.91420.028564
480.513777.00690


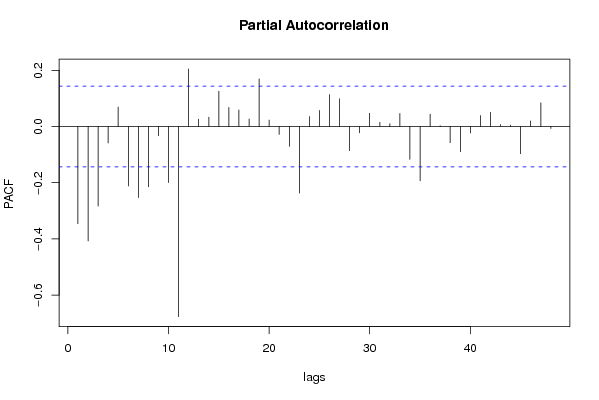
Partial Autocorrelation Function
Time lag kPACF(k)T-STATP-value
1-0.345728-4.71512e-06
2-0.40737-5.55580
3-0.283278-3.86347.7e-05
4-0.058817-0.80220.211743
50.0689790.94070.174027
6-0.211444-2.88370.002197
7-0.253057-3.45120.000345
8-0.214893-2.93070.001903
9-0.032923-0.4490.326976
10-0.199769-2.72450.003527
11-0.676645-9.22820
120.2046622.79120.002899
130.0257250.35080.36305
140.0330670.4510.326268
150.1252131.70770.044682
160.0676750.9230.178611
170.0586610.80.212356
180.0269220.36720.356958
190.1690712.30580.011112
200.0228790.3120.377682
21-0.028323-0.38630.349865
22-0.070716-0.96440.168038
23-0.237135-3.23410.000722
240.0351880.47990.31593
250.0570540.77810.218744
260.1136681.55020.061394
270.0984721.3430.090458
28-0.086193-1.17550.120647
29-0.022751-0.31030.378344
300.0474470.64710.259185
310.014810.2020.420078
320.0097070.13240.44741
330.0460760.62840.265258
34-0.1169-1.59430.056284
35-0.193552-2.63970.004501
360.0436290.5950.276276
370.0027260.03720.485191
38-0.057898-0.78960.215375
39-0.089808-1.22480.111096
40-0.023018-0.31390.376967
410.0389710.53150.297853
420.0501790.68440.247303
430.0065940.08990.464222
440.005160.07040.471988
45-0.097035-1.32340.093666
460.0197440.26930.394007
470.0843311.15010.125785
48-0.006837-0.09320.462904

\begin{tabular}{lllllllll}
\hline
Partial Autocorrelation Function \tabularnewline
Time lag k & PACF(k) & T-STAT & P-value \tabularnewline
1 & -0.345728 & -4.7151 & 2e-06 \tabularnewline
2 & -0.40737 & -5.5558 & 0 \tabularnewline
3 & -0.283278 & -3.8634 & 7.7e-05 \tabularnewline
4 & -0.058817 & -0.8022 & 0.211743 \tabularnewline
5 & 0.068979 & 0.9407 & 0.174027 \tabularnewline
6 & -0.211444 & -2.8837 & 0.002197 \tabularnewline
7 & -0.253057 & -3.4512 & 0.000345 \tabularnewline
8 & -0.214893 & -2.9307 & 0.001903 \tabularnewline
9 & -0.032923 & -0.449 & 0.326976 \tabularnewline
10 & -0.199769 & -2.7245 & 0.003527 \tabularnewline
11 & -0.676645 & -9.2282 & 0 \tabularnewline
12 & 0.204662 & 2.7912 & 0.002899 \tabularnewline
13 & 0.025725 & 0.3508 & 0.36305 \tabularnewline
14 & 0.033067 & 0.451 & 0.326268 \tabularnewline
15 & 0.125213 & 1.7077 & 0.044682 \tabularnewline
16 & 0.067675 & 0.923 & 0.178611 \tabularnewline
17 & 0.058661 & 0.8 & 0.212356 \tabularnewline
18 & 0.026922 & 0.3672 & 0.356958 \tabularnewline
19 & 0.169071 & 2.3058 & 0.011112 \tabularnewline
20 & 0.022879 & 0.312 & 0.377682 \tabularnewline
21 & -0.028323 & -0.3863 & 0.349865 \tabularnewline
22 & -0.070716 & -0.9644 & 0.168038 \tabularnewline
23 & -0.237135 & -3.2341 & 0.000722 \tabularnewline
24 & 0.035188 & 0.4799 & 0.31593 \tabularnewline
25 & 0.057054 & 0.7781 & 0.218744 \tabularnewline
26 & 0.113668 & 1.5502 & 0.061394 \tabularnewline
27 & 0.098472 & 1.343 & 0.090458 \tabularnewline
28 & -0.086193 & -1.1755 & 0.120647 \tabularnewline
29 & -0.022751 & -0.3103 & 0.378344 \tabularnewline
30 & 0.047447 & 0.6471 & 0.259185 \tabularnewline
31 & 0.01481 & 0.202 & 0.420078 \tabularnewline
32 & 0.009707 & 0.1324 & 0.44741 \tabularnewline
33 & 0.046076 & 0.6284 & 0.265258 \tabularnewline
34 & -0.1169 & -1.5943 & 0.056284 \tabularnewline
35 & -0.193552 & -2.6397 & 0.004501 \tabularnewline
36 & 0.043629 & 0.595 & 0.276276 \tabularnewline
37 & 0.002726 & 0.0372 & 0.485191 \tabularnewline
38 & -0.057898 & -0.7896 & 0.215375 \tabularnewline
39 & -0.089808 & -1.2248 & 0.111096 \tabularnewline
40 & -0.023018 & -0.3139 & 0.376967 \tabularnewline
41 & 0.038971 & 0.5315 & 0.297853 \tabularnewline
42 & 0.050179 & 0.6844 & 0.247303 \tabularnewline
43 & 0.006594 & 0.0899 & 0.464222 \tabularnewline
44 & 0.00516 & 0.0704 & 0.471988 \tabularnewline
45 & -0.097035 & -1.3234 & 0.093666 \tabularnewline
46 & 0.019744 & 0.2693 & 0.394007 \tabularnewline
47 & 0.084331 & 1.1501 & 0.125785 \tabularnewline
48 & -0.006837 & -0.0932 & 0.462904 \tabularnewline
\hline
\end{tabular}
%Source: https://freestatistics.org/blog/index.php?pk=76665&T=2

[TABLE]
[ROW][C]Partial Autocorrelation Function[/C][/ROW]
[ROW][C]Time lag k[/C][C]PACF(k)[/C][C]T-STAT[/C][C]P-value[/C][/ROW]
[ROW][C]1[/C][C]-0.345728[/C][C]-4.7151[/C][C]2e-06[/C][/ROW]
[ROW][C]2[/C][C]-0.40737[/C][C]-5.5558[/C][C]0[/C][/ROW]
[ROW][C]3[/C][C]-0.283278[/C][C]-3.8634[/C][C]7.7e-05[/C][/ROW]
[ROW][C]4[/C][C]-0.058817[/C][C]-0.8022[/C][C]0.211743[/C][/ROW]
[ROW][C]5[/C][C]0.068979[/C][C]0.9407[/C][C]0.174027[/C][/ROW]
[ROW][C]6[/C][C]-0.211444[/C][C]-2.8837[/C][C]0.002197[/C][/ROW]
[ROW][C]7[/C][C]-0.253057[/C][C]-3.4512[/C][C]0.000345[/C][/ROW]
[ROW][C]8[/C][C]-0.214893[/C][C]-2.9307[/C][C]0.001903[/C][/ROW]
[ROW][C]9[/C][C]-0.032923[/C][C]-0.449[/C][C]0.326976[/C][/ROW]
[ROW][C]10[/C][C]-0.199769[/C][C]-2.7245[/C][C]0.003527[/C][/ROW]
[ROW][C]11[/C][C]-0.676645[/C][C]-9.2282[/C][C]0[/C][/ROW]
[ROW][C]12[/C][C]0.204662[/C][C]2.7912[/C][C]0.002899[/C][/ROW]
[ROW][C]13[/C][C]0.025725[/C][C]0.3508[/C][C]0.36305[/C][/ROW]
[ROW][C]14[/C][C]0.033067[/C][C]0.451[/C][C]0.326268[/C][/ROW]
[ROW][C]15[/C][C]0.125213[/C][C]1.7077[/C][C]0.044682[/C][/ROW]
[ROW][C]16[/C][C]0.067675[/C][C]0.923[/C][C]0.178611[/C][/ROW]
[ROW][C]17[/C][C]0.058661[/C][C]0.8[/C][C]0.212356[/C][/ROW]
[ROW][C]18[/C][C]0.026922[/C][C]0.3672[/C][C]0.356958[/C][/ROW]
[ROW][C]19[/C][C]0.169071[/C][C]2.3058[/C][C]0.011112[/C][/ROW]
[ROW][C]20[/C][C]0.022879[/C][C]0.312[/C][C]0.377682[/C][/ROW]
[ROW][C]21[/C][C]-0.028323[/C][C]-0.3863[/C][C]0.349865[/C][/ROW]
[ROW][C]22[/C][C]-0.070716[/C][C]-0.9644[/C][C]0.168038[/C][/ROW]
[ROW][C]23[/C][C]-0.237135[/C][C]-3.2341[/C][C]0.000722[/C][/ROW]
[ROW][C]24[/C][C]0.035188[/C][C]0.4799[/C][C]0.31593[/C][/ROW]
[ROW][C]25[/C][C]0.057054[/C][C]0.7781[/C][C]0.218744[/C][/ROW]
[ROW][C]26[/C][C]0.113668[/C][C]1.5502[/C][C]0.061394[/C][/ROW]
[ROW][C]27[/C][C]0.098472[/C][C]1.343[/C][C]0.090458[/C][/ROW]
[ROW][C]28[/C][C]-0.086193[/C][C]-1.1755[/C][C]0.120647[/C][/ROW]
[ROW][C]29[/C][C]-0.022751[/C][C]-0.3103[/C][C]0.378344[/C][/ROW]
[ROW][C]30[/C][C]0.047447[/C][C]0.6471[/C][C]0.259185[/C][/ROW]
[ROW][C]31[/C][C]0.01481[/C][C]0.202[/C][C]0.420078[/C][/ROW]
[ROW][C]32[/C][C]0.009707[/C][C]0.1324[/C][C]0.44741[/C][/ROW]
[ROW][C]33[/C][C]0.046076[/C][C]0.6284[/C][C]0.265258[/C][/ROW]
[ROW][C]34[/C][C]-0.1169[/C][C]-1.5943[/C][C]0.056284[/C][/ROW]
[ROW][C]35[/C][C]-0.193552[/C][C]-2.6397[/C][C]0.004501[/C][/ROW]
[ROW][C]36[/C][C]0.043629[/C][C]0.595[/C][C]0.276276[/C][/ROW]
[ROW][C]37[/C][C]0.002726[/C][C]0.0372[/C][C]0.485191[/C][/ROW]
[ROW][C]38[/C][C]-0.057898[/C][C]-0.7896[/C][C]0.215375[/C][/ROW]
[ROW][C]39[/C][C]-0.089808[/C][C]-1.2248[/C][C]0.111096[/C][/ROW]
[ROW][C]40[/C][C]-0.023018[/C][C]-0.3139[/C][C]0.376967[/C][/ROW]
[ROW][C]41[/C][C]0.038971[/C][C]0.5315[/C][C]0.297853[/C][/ROW]
[ROW][C]42[/C][C]0.050179[/C][C]0.6844[/C][C]0.247303[/C][/ROW]
[ROW][C]43[/C][C]0.006594[/C][C]0.0899[/C][C]0.464222[/C][/ROW]
[ROW][C]44[/C][C]0.00516[/C][C]0.0704[/C][C]0.471988[/C][/ROW]
[ROW][C]45[/C][C]-0.097035[/C][C]-1.3234[/C][C]0.093666[/C][/ROW]
[ROW][C]46[/C][C]0.019744[/C][C]0.2693[/C][C]0.394007[/C][/ROW]
[ROW][C]47[/C][C]0.084331[/C][C]1.1501[/C][C]0.125785[/C][/ROW]
[ROW][C]48[/C][C]-0.006837[/C][C]-0.0932[/C][C]0.462904[/C][/ROW]
[/TABLE]
Source: https://freestatistics.org/blog/index.php?pk=76665&T=2

Globally Unique Identifier (entire table): ba.freestatistics.org/blog/index.php?pk=76665&T=2

As an alternative you can also use a QR Code:  

The GUIDs for individual cells are displayed in the table below:

Partial Autocorrelation Function
Time lag kPACF(k)T-STATP-value
1-0.345728-4.71512e-06
2-0.40737-5.55580
3-0.283278-3.86347.7e-05
4-0.058817-0.80220.211743
50.0689790.94070.174027
6-0.211444-2.88370.002197
7-0.253057-3.45120.000345
8-0.214893-2.93070.001903
9-0.032923-0.4490.326976
10-0.199769-2.72450.003527
11-0.676645-9.22820
120.2046622.79120.002899
130.0257250.35080.36305
140.0330670.4510.326268
150.1252131.70770.044682
160.0676750.9230.178611
170.0586610.80.212356
180.0269220.36720.356958
190.1690712.30580.011112
200.0228790.3120.377682
21-0.028323-0.38630.349865
22-0.070716-0.96440.168038
23-0.237135-3.23410.000722
240.0351880.47990.31593
250.0570540.77810.218744
260.1136681.55020.061394
270.0984721.3430.090458
28-0.086193-1.17550.120647
29-0.022751-0.31030.378344
300.0474470.64710.259185
310.014810.2020.420078
320.0097070.13240.44741
330.0460760.62840.265258
34-0.1169-1.59430.056284
35-0.193552-2.63970.004501
360.0436290.5950.276276
370.0027260.03720.485191
38-0.057898-0.78960.215375
39-0.089808-1.22480.111096
40-0.023018-0.31390.376967
410.0389710.53150.297853
420.0501790.68440.247303
430.0065940.08990.464222
440.005160.07040.471988
45-0.097035-1.32340.093666
460.0197440.26930.394007
470.0843311.15010.125785
48-0.006837-0.09320.462904


Parameters (Session):
par1 = 48 ; par2 = 1 ; par3 = 1 ; par4 = 0 ; par5 = 12 ; par6 = White Noise ; par7 = 0.95 ;
Parameters (R input):
par1 = 48 ; par2 = 1 ; par3 = 1 ; par4 = 0 ; par5 = 12 ; par6 = White Noise ; par7 = 0.95 ;
R code (references can be found in the software module):
if (par1 == 'Default') {
par1 = 10*log10(length(x))
} else {
par1 <- as.numeric(par1)
}
par2 <- as.numeric(par2)
par3 <- as.numeric(par3)
par4 <- as.numeric(par4)
par5 <- as.numeric(par5)
if (par6 == 'White Noise') par6 <- 'white' else par6 <- 'ma'
par7 <- as.numeric(par7)
if (par2 == 0) {
x <- log(x)
} else {
x <- (x ^ par2 - 1) / par2
}
if (par3 > 0) x <- diff(x,lag=1,difference=par3)
if (par4 > 0) x <- diff(x,lag=par5,difference=par4)
bitmap(file='pic1.png')
racf <- acf(x, par1, main='Autocorrelation', xlab='time lag', ylab='ACF', ci.type=par6, ci=par7, sub=paste('(lambda=',par2,', d=',par3,', D=',par4,', CI=', par7, ', CI type=',par6,')',sep=''))
dev.off()
bitmap(file='pic2.png')
rpacf <- pacf(x,par1,main='Partial Autocorrelation',xlab='lags',ylab='PACF')
dev.off()
(myacf <- c(racf$acf))
(mypacf <- c(rpacf$acf))
lengthx <- length(x)
sqrtn <- sqrt(lengthx)
load(file='createtable')
a<-table.start()
a<-table.row.start(a)
a<-table.element(a,'Autocorrelation Function',4,TRUE)
a<-table.row.end(a)
a<-table.row.start(a)
a<-table.element(a,'Time lag k',header=TRUE)
a<-table.element(a,hyperlink('basics.htm','ACF(k)','click here for more information about the Autocorrelation Function'),header=TRUE)
a<-table.element(a,'T-STAT',header=TRUE)
a<-table.element(a,'P-value',header=TRUE)
a<-table.row.end(a)
for (i in 2:(par1+1)) {
a<-table.row.start(a)
a<-table.element(a,i-1,header=TRUE)
a<-table.element(a,round(myacf[i],6))
mytstat <- myacf[i]*sqrtn
a<-table.element(a,round(mytstat,4))
a<-table.element(a,round(1-pt(abs(mytstat),lengthx),6))
a<-table.row.end(a)
}
a<-table.end(a)
table.save(a,file='mytable.tab')
a<-table.start()
a<-table.row.start(a)
a<-table.element(a,'Partial Autocorrelation Function',4,TRUE)
a<-table.row.end(a)
a<-table.row.start(a)
a<-table.element(a,'Time lag k',header=TRUE)
a<-table.element(a,hyperlink('basics.htm','PACF(k)','click here for more information about the Partial Autocorrelation Function'),header=TRUE)
a<-table.element(a,'T-STAT',header=TRUE)
a<-table.element(a,'P-value',header=TRUE)
a<-table.row.end(a)
for (i in 1:par1) {
a<-table.row.start(a)
a<-table.element(a,i,header=TRUE)
a<-table.element(a,round(mypacf[i],6))
mytstat <- mypacf[i]*sqrtn
a<-table.element(a,round(mytstat,4))
a<-table.element(a,round(1-pt(abs(mytstat),lengthx),6))
a<-table.row.end(a)
}
a<-table.end(a)
table.save(a,file='mytable1.tab')