Free Statistics

of Irreproducible Research!

Author's title

Author*Unverified author*
R Software Modulerwasp_autocorrelation.wasp
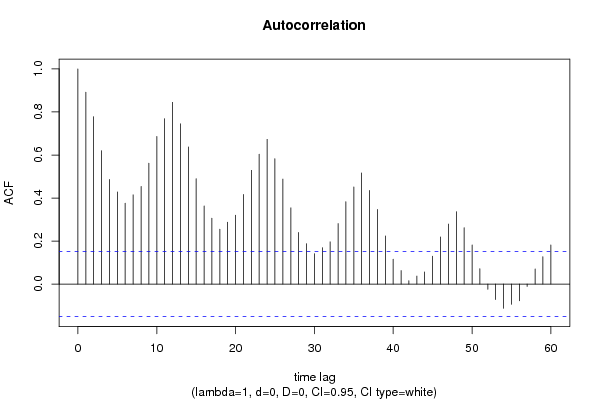
Title produced by software(Partial) Autocorrelation Function
Date of computationSat, 29 May 2010 11:08:03 +0000
Cite this page as followsStatistical Computations at FreeStatistics.org, Office for Research Development and Education, URL https://freestatistics.org/blog/index.php?v=date/2010/May/29/t1275131323jd0m0kctvrxbg9t.htm/, Retrieved Sat, 27 Apr 2024 21:03:49 +0000
Statistical Computations at FreeStatistics.org, Office for Research Development and Education, URL https://freestatistics.org/blog/index.php?pk=76656, Retrieved Sat, 27 Apr 2024 21:03:49 +0000
QR Codes:

Original text written by user:
IsPrivate?No (this computation is public)
User-defined keywordsKDGP2W21
Estimated Impact208
Family? (F = Feedback message, R = changed R code, M = changed R Module, P = changed Parameters, D = changed Data)
-       [(Partial) Autocorrelation Function] [Maandelijkse melk...] [2010-05-29 11:08:03] [5e13855820c5420788a37eb4bc7648e0] [Current]
Feedback Forum

Post a new message
Dataseries X:
589
561
640
656
727
697
640
599
568
577
553
582
600
566
653
673
742
716
660
617
583
587
565
598
628
618
688
705
770
736
678
639
604
611
594
634
658
622
709
722
782
756
702
653
615
621
602
635
677
635
736
755
811
798
735
697
661
667
645
688
713
667
762
784
837
817
767
722
681
687
660
698
717
696
775
796
858
826
783
740
701
706
677
711
734
690
785
805
871
845
801
764
725
723
690
734
750
707
807
824
886
859
819
783
740
747
711
751
804
756
860
878
942
913
869
834
790
800
763
800
826
799
890
900
961
935
894
855
809
810
766
805
821
773
883
898
957
924
881
837
784
791
760
802
828
778
889
902
969
947
908
867
815
812
773
813
834
782
892
903
966
937
896
858
817
827
797
843


Summary of computational transaction
Raw Inputview raw input (R code)
Raw Outputview raw output of R engine
Computing time2 seconds
R Server'RServer@AstonUniversity' @ vre.aston.ac.uk

\begin{tabular}{lllllllll}
\hline
Summary of computational transaction \tabularnewline
Raw Input & view raw input (R code)  \tabularnewline
Raw Output & view raw output of R engine  \tabularnewline
Computing time & 2 seconds \tabularnewline
R Server & 'RServer@AstonUniversity' @ vre.aston.ac.uk \tabularnewline
\hline
\end{tabular}
%Source: https://freestatistics.org/blog/index.php?pk=76656&T=0

[TABLE]
[ROW][C]Summary of computational transaction[/C][/ROW]
[ROW][C]Raw Input[/C][C]view raw input (R code) [/C][/ROW]
[ROW][C]Raw Output[/C][C]view raw output of R engine [/C][/ROW]
[ROW][C]Computing time[/C][C]2 seconds[/C][/ROW]
[ROW][C]R Server[/C][C]'RServer@AstonUniversity' @ vre.aston.ac.uk[/C][/ROW]
[/TABLE]
Source: https://freestatistics.org/blog/index.php?pk=76656&T=0

Globally Unique Identifier (entire table): ba.freestatistics.org/blog/index.php?pk=76656&T=0

As an alternative you can also use a QR Code:  

The GUIDs for individual cells are displayed in the table below:

Summary of computational transaction
Raw Inputview raw input (R code)
Raw Outputview raw output of R engine
Computing time2 seconds
R Server'RServer@AstonUniversity' @ vre.aston.ac.uk


Autocorrelation Function
Time lag kACF(k)T-STATP-value
10.89157411.55610
20.77817910.08640
30.6202718.03960
40.4866646.30790
50.4281485.54940
60.3760644.87431e-06
70.4147735.37610
80.4542525.88780
90.5618157.2820
100.6865598.89880
110.7685539.96160
120.84491410.95130
130.7449879.65610
140.6376678.26510
150.4896796.3470
160.3635554.71223e-06
170.3059493.96565.4e-05
180.2549083.3040.000583
190.2874213.72540.000133
200.3205694.15512.6e-05
210.4165165.39870
220.5287136.85290
230.6033597.82040
240.6728018.72050
250.5827017.55270
260.4879616.32470
270.3545384.59534e-06
280.2399233.10980.0011
290.1877162.43310.00801
300.1409741.82720.034719
310.1692542.19380.014812
320.1963572.54510.005913
330.2811893.64460.000178
340.3827514.9611e-06
350.4510945.84680
360.5163556.69270
370.4348175.63590
380.3468264.49546e-06
390.2237112.89960.002118
400.1157261.50.067748
410.0629250.81560.207941
420.0160220.20770.417867
430.0372240.48250.315047
440.056470.73190.232614
450.1296521.68050.047361
460.2192742.84210.002519
470.2788293.6140.000199
480.3367264.36451.1e-05
490.2624643.40190.000418
500.1821922.36150.009674
510.0712850.9240.178415
52-0.024318-0.31520.376499
53-0.071651-0.92870.177187
54-0.112416-1.45710.07348
55-0.093422-1.21090.113819
56-0.077271-1.00160.159
57-0.010521-0.13640.445845
580.0708090.91780.180021
590.1276621.65470.049927
600.1820332.35940.009726

\begin{tabular}{lllllllll}
\hline
Autocorrelation Function \tabularnewline
Time lag k & ACF(k) & T-STAT & P-value \tabularnewline
1 & 0.891574 & 11.5561 & 0 \tabularnewline
2 & 0.778179 & 10.0864 & 0 \tabularnewline
3 & 0.620271 & 8.0396 & 0 \tabularnewline
4 & 0.486664 & 6.3079 & 0 \tabularnewline
5 & 0.428148 & 5.5494 & 0 \tabularnewline
6 & 0.376064 & 4.8743 & 1e-06 \tabularnewline
7 & 0.414773 & 5.3761 & 0 \tabularnewline
8 & 0.454252 & 5.8878 & 0 \tabularnewline
9 & 0.561815 & 7.282 & 0 \tabularnewline
10 & 0.686559 & 8.8988 & 0 \tabularnewline
11 & 0.768553 & 9.9616 & 0 \tabularnewline
12 & 0.844914 & 10.9513 & 0 \tabularnewline
13 & 0.744987 & 9.6561 & 0 \tabularnewline
14 & 0.637667 & 8.2651 & 0 \tabularnewline
15 & 0.489679 & 6.347 & 0 \tabularnewline
16 & 0.363555 & 4.7122 & 3e-06 \tabularnewline
17 & 0.305949 & 3.9656 & 5.4e-05 \tabularnewline
18 & 0.254908 & 3.304 & 0.000583 \tabularnewline
19 & 0.287421 & 3.7254 & 0.000133 \tabularnewline
20 & 0.320569 & 4.1551 & 2.6e-05 \tabularnewline
21 & 0.416516 & 5.3987 & 0 \tabularnewline
22 & 0.528713 & 6.8529 & 0 \tabularnewline
23 & 0.603359 & 7.8204 & 0 \tabularnewline
24 & 0.672801 & 8.7205 & 0 \tabularnewline
25 & 0.582701 & 7.5527 & 0 \tabularnewline
26 & 0.487961 & 6.3247 & 0 \tabularnewline
27 & 0.354538 & 4.5953 & 4e-06 \tabularnewline
28 & 0.239923 & 3.1098 & 0.0011 \tabularnewline
29 & 0.187716 & 2.4331 & 0.00801 \tabularnewline
30 & 0.140974 & 1.8272 & 0.034719 \tabularnewline
31 & 0.169254 & 2.1938 & 0.014812 \tabularnewline
32 & 0.196357 & 2.5451 & 0.005913 \tabularnewline
33 & 0.281189 & 3.6446 & 0.000178 \tabularnewline
34 & 0.382751 & 4.961 & 1e-06 \tabularnewline
35 & 0.451094 & 5.8468 & 0 \tabularnewline
36 & 0.516355 & 6.6927 & 0 \tabularnewline
37 & 0.434817 & 5.6359 & 0 \tabularnewline
38 & 0.346826 & 4.4954 & 6e-06 \tabularnewline
39 & 0.223711 & 2.8996 & 0.002118 \tabularnewline
40 & 0.115726 & 1.5 & 0.067748 \tabularnewline
41 & 0.062925 & 0.8156 & 0.207941 \tabularnewline
42 & 0.016022 & 0.2077 & 0.417867 \tabularnewline
43 & 0.037224 & 0.4825 & 0.315047 \tabularnewline
44 & 0.05647 & 0.7319 & 0.232614 \tabularnewline
45 & 0.129652 & 1.6805 & 0.047361 \tabularnewline
46 & 0.219274 & 2.8421 & 0.002519 \tabularnewline
47 & 0.278829 & 3.614 & 0.000199 \tabularnewline
48 & 0.336726 & 4.3645 & 1.1e-05 \tabularnewline
49 & 0.262464 & 3.4019 & 0.000418 \tabularnewline
50 & 0.182192 & 2.3615 & 0.009674 \tabularnewline
51 & 0.071285 & 0.924 & 0.178415 \tabularnewline
52 & -0.024318 & -0.3152 & 0.376499 \tabularnewline
53 & -0.071651 & -0.9287 & 0.177187 \tabularnewline
54 & -0.112416 & -1.4571 & 0.07348 \tabularnewline
55 & -0.093422 & -1.2109 & 0.113819 \tabularnewline
56 & -0.077271 & -1.0016 & 0.159 \tabularnewline
57 & -0.010521 & -0.1364 & 0.445845 \tabularnewline
58 & 0.070809 & 0.9178 & 0.180021 \tabularnewline
59 & 0.127662 & 1.6547 & 0.049927 \tabularnewline
60 & 0.182033 & 2.3594 & 0.009726 \tabularnewline
\hline
\end{tabular}
%Source: https://freestatistics.org/blog/index.php?pk=76656&T=1

[TABLE]
[ROW][C]Autocorrelation Function[/C][/ROW]
[ROW][C]Time lag k[/C][C]ACF(k)[/C][C]T-STAT[/C][C]P-value[/C][/ROW]
[ROW][C]1[/C][C]0.891574[/C][C]11.5561[/C][C]0[/C][/ROW]
[ROW][C]2[/C][C]0.778179[/C][C]10.0864[/C][C]0[/C][/ROW]
[ROW][C]3[/C][C]0.620271[/C][C]8.0396[/C][C]0[/C][/ROW]
[ROW][C]4[/C][C]0.486664[/C][C]6.3079[/C][C]0[/C][/ROW]
[ROW][C]5[/C][C]0.428148[/C][C]5.5494[/C][C]0[/C][/ROW]
[ROW][C]6[/C][C]0.376064[/C][C]4.8743[/C][C]1e-06[/C][/ROW]
[ROW][C]7[/C][C]0.414773[/C][C]5.3761[/C][C]0[/C][/ROW]
[ROW][C]8[/C][C]0.454252[/C][C]5.8878[/C][C]0[/C][/ROW]
[ROW][C]9[/C][C]0.561815[/C][C]7.282[/C][C]0[/C][/ROW]
[ROW][C]10[/C][C]0.686559[/C][C]8.8988[/C][C]0[/C][/ROW]
[ROW][C]11[/C][C]0.768553[/C][C]9.9616[/C][C]0[/C][/ROW]
[ROW][C]12[/C][C]0.844914[/C][C]10.9513[/C][C]0[/C][/ROW]
[ROW][C]13[/C][C]0.744987[/C][C]9.6561[/C][C]0[/C][/ROW]
[ROW][C]14[/C][C]0.637667[/C][C]8.2651[/C][C]0[/C][/ROW]
[ROW][C]15[/C][C]0.489679[/C][C]6.347[/C][C]0[/C][/ROW]
[ROW][C]16[/C][C]0.363555[/C][C]4.7122[/C][C]3e-06[/C][/ROW]
[ROW][C]17[/C][C]0.305949[/C][C]3.9656[/C][C]5.4e-05[/C][/ROW]
[ROW][C]18[/C][C]0.254908[/C][C]3.304[/C][C]0.000583[/C][/ROW]
[ROW][C]19[/C][C]0.287421[/C][C]3.7254[/C][C]0.000133[/C][/ROW]
[ROW][C]20[/C][C]0.320569[/C][C]4.1551[/C][C]2.6e-05[/C][/ROW]
[ROW][C]21[/C][C]0.416516[/C][C]5.3987[/C][C]0[/C][/ROW]
[ROW][C]22[/C][C]0.528713[/C][C]6.8529[/C][C]0[/C][/ROW]
[ROW][C]23[/C][C]0.603359[/C][C]7.8204[/C][C]0[/C][/ROW]
[ROW][C]24[/C][C]0.672801[/C][C]8.7205[/C][C]0[/C][/ROW]
[ROW][C]25[/C][C]0.582701[/C][C]7.5527[/C][C]0[/C][/ROW]
[ROW][C]26[/C][C]0.487961[/C][C]6.3247[/C][C]0[/C][/ROW]
[ROW][C]27[/C][C]0.354538[/C][C]4.5953[/C][C]4e-06[/C][/ROW]
[ROW][C]28[/C][C]0.239923[/C][C]3.1098[/C][C]0.0011[/C][/ROW]
[ROW][C]29[/C][C]0.187716[/C][C]2.4331[/C][C]0.00801[/C][/ROW]
[ROW][C]30[/C][C]0.140974[/C][C]1.8272[/C][C]0.034719[/C][/ROW]
[ROW][C]31[/C][C]0.169254[/C][C]2.1938[/C][C]0.014812[/C][/ROW]
[ROW][C]32[/C][C]0.196357[/C][C]2.5451[/C][C]0.005913[/C][/ROW]
[ROW][C]33[/C][C]0.281189[/C][C]3.6446[/C][C]0.000178[/C][/ROW]
[ROW][C]34[/C][C]0.382751[/C][C]4.961[/C][C]1e-06[/C][/ROW]
[ROW][C]35[/C][C]0.451094[/C][C]5.8468[/C][C]0[/C][/ROW]
[ROW][C]36[/C][C]0.516355[/C][C]6.6927[/C][C]0[/C][/ROW]
[ROW][C]37[/C][C]0.434817[/C][C]5.6359[/C][C]0[/C][/ROW]
[ROW][C]38[/C][C]0.346826[/C][C]4.4954[/C][C]6e-06[/C][/ROW]
[ROW][C]39[/C][C]0.223711[/C][C]2.8996[/C][C]0.002118[/C][/ROW]
[ROW][C]40[/C][C]0.115726[/C][C]1.5[/C][C]0.067748[/C][/ROW]
[ROW][C]41[/C][C]0.062925[/C][C]0.8156[/C][C]0.207941[/C][/ROW]
[ROW][C]42[/C][C]0.016022[/C][C]0.2077[/C][C]0.417867[/C][/ROW]
[ROW][C]43[/C][C]0.037224[/C][C]0.4825[/C][C]0.315047[/C][/ROW]
[ROW][C]44[/C][C]0.05647[/C][C]0.7319[/C][C]0.232614[/C][/ROW]
[ROW][C]45[/C][C]0.129652[/C][C]1.6805[/C][C]0.047361[/C][/ROW]
[ROW][C]46[/C][C]0.219274[/C][C]2.8421[/C][C]0.002519[/C][/ROW]
[ROW][C]47[/C][C]0.278829[/C][C]3.614[/C][C]0.000199[/C][/ROW]
[ROW][C]48[/C][C]0.336726[/C][C]4.3645[/C][C]1.1e-05[/C][/ROW]
[ROW][C]49[/C][C]0.262464[/C][C]3.4019[/C][C]0.000418[/C][/ROW]
[ROW][C]50[/C][C]0.182192[/C][C]2.3615[/C][C]0.009674[/C][/ROW]
[ROW][C]51[/C][C]0.071285[/C][C]0.924[/C][C]0.178415[/C][/ROW]
[ROW][C]52[/C][C]-0.024318[/C][C]-0.3152[/C][C]0.376499[/C][/ROW]
[ROW][C]53[/C][C]-0.071651[/C][C]-0.9287[/C][C]0.177187[/C][/ROW]
[ROW][C]54[/C][C]-0.112416[/C][C]-1.4571[/C][C]0.07348[/C][/ROW]
[ROW][C]55[/C][C]-0.093422[/C][C]-1.2109[/C][C]0.113819[/C][/ROW]
[ROW][C]56[/C][C]-0.077271[/C][C]-1.0016[/C][C]0.159[/C][/ROW]
[ROW][C]57[/C][C]-0.010521[/C][C]-0.1364[/C][C]0.445845[/C][/ROW]
[ROW][C]58[/C][C]0.070809[/C][C]0.9178[/C][C]0.180021[/C][/ROW]
[ROW][C]59[/C][C]0.127662[/C][C]1.6547[/C][C]0.049927[/C][/ROW]
[ROW][C]60[/C][C]0.182033[/C][C]2.3594[/C][C]0.009726[/C][/ROW]
[/TABLE]
Source: https://freestatistics.org/blog/index.php?pk=76656&T=1

Globally Unique Identifier (entire table): ba.freestatistics.org/blog/index.php?pk=76656&T=1

As an alternative you can also use a QR Code:  

The GUIDs for individual cells are displayed in the table below:

Autocorrelation Function
Time lag kACF(k)T-STATP-value
10.89157411.55610
20.77817910.08640
30.6202718.03960
40.4866646.30790
50.4281485.54940
60.3760644.87431e-06
70.4147735.37610
80.4542525.88780
90.5618157.2820
100.6865598.89880
110.7685539.96160
120.84491410.95130
130.7449879.65610
140.6376678.26510
150.4896796.3470
160.3635554.71223e-06
170.3059493.96565.4e-05
180.2549083.3040.000583
190.2874213.72540.000133
200.3205694.15512.6e-05
210.4165165.39870
220.5287136.85290
230.6033597.82040
240.6728018.72050
250.5827017.55270
260.4879616.32470
270.3545384.59534e-06
280.2399233.10980.0011
290.1877162.43310.00801
300.1409741.82720.034719
310.1692542.19380.014812
320.1963572.54510.005913
330.2811893.64460.000178
340.3827514.9611e-06
350.4510945.84680
360.5163556.69270
370.4348175.63590
380.3468264.49546e-06
390.2237112.89960.002118
400.1157261.50.067748
410.0629250.81560.207941
420.0160220.20770.417867
430.0372240.48250.315047
440.056470.73190.232614
450.1296521.68050.047361
460.2192742.84210.002519
470.2788293.6140.000199
480.3367264.36451.1e-05
490.2624643.40190.000418
500.1821922.36150.009674
510.0712850.9240.178415
52-0.024318-0.31520.376499
53-0.071651-0.92870.177187
54-0.112416-1.45710.07348
55-0.093422-1.21090.113819
56-0.077271-1.00160.159
57-0.010521-0.13640.445845
580.0708090.91780.180021
590.1276621.65470.049927
600.1820332.35940.009726


Partial Autocorrelation Function
Time lag kPACF(k)T-STATP-value
10.89157411.55610
2-0.081546-1.0570.146024
3-0.281767-3.65210.000174
40.0322160.41760.338399
50.350264.53995e-06
6-0.082228-1.06580.144023
70.2834823.67430.00016
80.0918761.19080.117697
90.3990915.17280
100.3044743.94645.8e-05
110.0627320.81310.208656
120.2223652.88220.002233
13-0.631849-8.18970
14-0.016037-0.20790.417795
150.0729120.9450.172996
16-0.040095-0.51970.301981
17-0.086777-1.12480.131149
18-0.037424-0.48510.314129
19-0.046171-0.59840.275175
200.0290330.37630.353583
210.0358330.46440.321464
220.0519510.67340.250823
230.0465630.60350.273484
240.0458990.59490.27635
25-0.182006-2.35910.009735
260.0819661.06240.144789
270.0561230.72740.233985
28-0.03423-0.44370.328927
29-0.036461-0.47260.318561
300.0016470.02140.491495
31-0.055693-0.72190.23569
32-0.008491-0.11010.456249
33-0.013836-0.17930.428943
340.0291640.3780.35295
350.0025330.03280.486922
360.0072520.0940.462612
37-0.105765-1.37090.086121
38-0.017088-0.22150.412491
390.0391840.50790.306099
40-0.03226-0.41810.338192
41-0.081586-1.05750.145908
420.0062180.08060.467929
43-0.031591-0.40950.341361
44-0.032538-0.42170.336875
45-0.017695-0.22940.409437
46-0.013028-0.16890.433056
47-0.033005-0.42780.334672
48-0.009453-0.12250.451313
49-0.028985-0.37570.353811
500.003650.04730.481159
510.0373930.48470.314269
520.0257240.33340.369615
53-0.046758-0.6060.27265
540.0293430.38030.352092
55-0.015944-0.20670.418264
56-0.010164-0.13170.447676
570.0146130.18940.425
58-0.018843-0.24420.403672
590.0070770.09170.463513
60-0.01856-0.24060.405094

\begin{tabular}{lllllllll}
\hline
Partial Autocorrelation Function \tabularnewline
Time lag k & PACF(k) & T-STAT & P-value \tabularnewline
1 & 0.891574 & 11.5561 & 0 \tabularnewline
2 & -0.081546 & -1.057 & 0.146024 \tabularnewline
3 & -0.281767 & -3.6521 & 0.000174 \tabularnewline
4 & 0.032216 & 0.4176 & 0.338399 \tabularnewline
5 & 0.35026 & 4.5399 & 5e-06 \tabularnewline
6 & -0.082228 & -1.0658 & 0.144023 \tabularnewline
7 & 0.283482 & 3.6743 & 0.00016 \tabularnewline
8 & 0.091876 & 1.1908 & 0.117697 \tabularnewline
9 & 0.399091 & 5.1728 & 0 \tabularnewline
10 & 0.304474 & 3.9464 & 5.8e-05 \tabularnewline
11 & 0.062732 & 0.8131 & 0.208656 \tabularnewline
12 & 0.222365 & 2.8822 & 0.002233 \tabularnewline
13 & -0.631849 & -8.1897 & 0 \tabularnewline
14 & -0.016037 & -0.2079 & 0.417795 \tabularnewline
15 & 0.072912 & 0.945 & 0.172996 \tabularnewline
16 & -0.040095 & -0.5197 & 0.301981 \tabularnewline
17 & -0.086777 & -1.1248 & 0.131149 \tabularnewline
18 & -0.037424 & -0.4851 & 0.314129 \tabularnewline
19 & -0.046171 & -0.5984 & 0.275175 \tabularnewline
20 & 0.029033 & 0.3763 & 0.353583 \tabularnewline
21 & 0.035833 & 0.4644 & 0.321464 \tabularnewline
22 & 0.051951 & 0.6734 & 0.250823 \tabularnewline
23 & 0.046563 & 0.6035 & 0.273484 \tabularnewline
24 & 0.045899 & 0.5949 & 0.27635 \tabularnewline
25 & -0.182006 & -2.3591 & 0.009735 \tabularnewline
26 & 0.081966 & 1.0624 & 0.144789 \tabularnewline
27 & 0.056123 & 0.7274 & 0.233985 \tabularnewline
28 & -0.03423 & -0.4437 & 0.328927 \tabularnewline
29 & -0.036461 & -0.4726 & 0.318561 \tabularnewline
30 & 0.001647 & 0.0214 & 0.491495 \tabularnewline
31 & -0.055693 & -0.7219 & 0.23569 \tabularnewline
32 & -0.008491 & -0.1101 & 0.456249 \tabularnewline
33 & -0.013836 & -0.1793 & 0.428943 \tabularnewline
34 & 0.029164 & 0.378 & 0.35295 \tabularnewline
35 & 0.002533 & 0.0328 & 0.486922 \tabularnewline
36 & 0.007252 & 0.094 & 0.462612 \tabularnewline
37 & -0.105765 & -1.3709 & 0.086121 \tabularnewline
38 & -0.017088 & -0.2215 & 0.412491 \tabularnewline
39 & 0.039184 & 0.5079 & 0.306099 \tabularnewline
40 & -0.03226 & -0.4181 & 0.338192 \tabularnewline
41 & -0.081586 & -1.0575 & 0.145908 \tabularnewline
42 & 0.006218 & 0.0806 & 0.467929 \tabularnewline
43 & -0.031591 & -0.4095 & 0.341361 \tabularnewline
44 & -0.032538 & -0.4217 & 0.336875 \tabularnewline
45 & -0.017695 & -0.2294 & 0.409437 \tabularnewline
46 & -0.013028 & -0.1689 & 0.433056 \tabularnewline
47 & -0.033005 & -0.4278 & 0.334672 \tabularnewline
48 & -0.009453 & -0.1225 & 0.451313 \tabularnewline
49 & -0.028985 & -0.3757 & 0.353811 \tabularnewline
50 & 0.00365 & 0.0473 & 0.481159 \tabularnewline
51 & 0.037393 & 0.4847 & 0.314269 \tabularnewline
52 & 0.025724 & 0.3334 & 0.369615 \tabularnewline
53 & -0.046758 & -0.606 & 0.27265 \tabularnewline
54 & 0.029343 & 0.3803 & 0.352092 \tabularnewline
55 & -0.015944 & -0.2067 & 0.418264 \tabularnewline
56 & -0.010164 & -0.1317 & 0.447676 \tabularnewline
57 & 0.014613 & 0.1894 & 0.425 \tabularnewline
58 & -0.018843 & -0.2442 & 0.403672 \tabularnewline
59 & 0.007077 & 0.0917 & 0.463513 \tabularnewline
60 & -0.01856 & -0.2406 & 0.405094 \tabularnewline
\hline
\end{tabular}
%Source: https://freestatistics.org/blog/index.php?pk=76656&T=2

[TABLE]
[ROW][C]Partial Autocorrelation Function[/C][/ROW]
[ROW][C]Time lag k[/C][C]PACF(k)[/C][C]T-STAT[/C][C]P-value[/C][/ROW]
[ROW][C]1[/C][C]0.891574[/C][C]11.5561[/C][C]0[/C][/ROW]
[ROW][C]2[/C][C]-0.081546[/C][C]-1.057[/C][C]0.146024[/C][/ROW]
[ROW][C]3[/C][C]-0.281767[/C][C]-3.6521[/C][C]0.000174[/C][/ROW]
[ROW][C]4[/C][C]0.032216[/C][C]0.4176[/C][C]0.338399[/C][/ROW]
[ROW][C]5[/C][C]0.35026[/C][C]4.5399[/C][C]5e-06[/C][/ROW]
[ROW][C]6[/C][C]-0.082228[/C][C]-1.0658[/C][C]0.144023[/C][/ROW]
[ROW][C]7[/C][C]0.283482[/C][C]3.6743[/C][C]0.00016[/C][/ROW]
[ROW][C]8[/C][C]0.091876[/C][C]1.1908[/C][C]0.117697[/C][/ROW]
[ROW][C]9[/C][C]0.399091[/C][C]5.1728[/C][C]0[/C][/ROW]
[ROW][C]10[/C][C]0.304474[/C][C]3.9464[/C][C]5.8e-05[/C][/ROW]
[ROW][C]11[/C][C]0.062732[/C][C]0.8131[/C][C]0.208656[/C][/ROW]
[ROW][C]12[/C][C]0.222365[/C][C]2.8822[/C][C]0.002233[/C][/ROW]
[ROW][C]13[/C][C]-0.631849[/C][C]-8.1897[/C][C]0[/C][/ROW]
[ROW][C]14[/C][C]-0.016037[/C][C]-0.2079[/C][C]0.417795[/C][/ROW]
[ROW][C]15[/C][C]0.072912[/C][C]0.945[/C][C]0.172996[/C][/ROW]
[ROW][C]16[/C][C]-0.040095[/C][C]-0.5197[/C][C]0.301981[/C][/ROW]
[ROW][C]17[/C][C]-0.086777[/C][C]-1.1248[/C][C]0.131149[/C][/ROW]
[ROW][C]18[/C][C]-0.037424[/C][C]-0.4851[/C][C]0.314129[/C][/ROW]
[ROW][C]19[/C][C]-0.046171[/C][C]-0.5984[/C][C]0.275175[/C][/ROW]
[ROW][C]20[/C][C]0.029033[/C][C]0.3763[/C][C]0.353583[/C][/ROW]
[ROW][C]21[/C][C]0.035833[/C][C]0.4644[/C][C]0.321464[/C][/ROW]
[ROW][C]22[/C][C]0.051951[/C][C]0.6734[/C][C]0.250823[/C][/ROW]
[ROW][C]23[/C][C]0.046563[/C][C]0.6035[/C][C]0.273484[/C][/ROW]
[ROW][C]24[/C][C]0.045899[/C][C]0.5949[/C][C]0.27635[/C][/ROW]
[ROW][C]25[/C][C]-0.182006[/C][C]-2.3591[/C][C]0.009735[/C][/ROW]
[ROW][C]26[/C][C]0.081966[/C][C]1.0624[/C][C]0.144789[/C][/ROW]
[ROW][C]27[/C][C]0.056123[/C][C]0.7274[/C][C]0.233985[/C][/ROW]
[ROW][C]28[/C][C]-0.03423[/C][C]-0.4437[/C][C]0.328927[/C][/ROW]
[ROW][C]29[/C][C]-0.036461[/C][C]-0.4726[/C][C]0.318561[/C][/ROW]
[ROW][C]30[/C][C]0.001647[/C][C]0.0214[/C][C]0.491495[/C][/ROW]
[ROW][C]31[/C][C]-0.055693[/C][C]-0.7219[/C][C]0.23569[/C][/ROW]
[ROW][C]32[/C][C]-0.008491[/C][C]-0.1101[/C][C]0.456249[/C][/ROW]
[ROW][C]33[/C][C]-0.013836[/C][C]-0.1793[/C][C]0.428943[/C][/ROW]
[ROW][C]34[/C][C]0.029164[/C][C]0.378[/C][C]0.35295[/C][/ROW]
[ROW][C]35[/C][C]0.002533[/C][C]0.0328[/C][C]0.486922[/C][/ROW]
[ROW][C]36[/C][C]0.007252[/C][C]0.094[/C][C]0.462612[/C][/ROW]
[ROW][C]37[/C][C]-0.105765[/C][C]-1.3709[/C][C]0.086121[/C][/ROW]
[ROW][C]38[/C][C]-0.017088[/C][C]-0.2215[/C][C]0.412491[/C][/ROW]
[ROW][C]39[/C][C]0.039184[/C][C]0.5079[/C][C]0.306099[/C][/ROW]
[ROW][C]40[/C][C]-0.03226[/C][C]-0.4181[/C][C]0.338192[/C][/ROW]
[ROW][C]41[/C][C]-0.081586[/C][C]-1.0575[/C][C]0.145908[/C][/ROW]
[ROW][C]42[/C][C]0.006218[/C][C]0.0806[/C][C]0.467929[/C][/ROW]
[ROW][C]43[/C][C]-0.031591[/C][C]-0.4095[/C][C]0.341361[/C][/ROW]
[ROW][C]44[/C][C]-0.032538[/C][C]-0.4217[/C][C]0.336875[/C][/ROW]
[ROW][C]45[/C][C]-0.017695[/C][C]-0.2294[/C][C]0.409437[/C][/ROW]
[ROW][C]46[/C][C]-0.013028[/C][C]-0.1689[/C][C]0.433056[/C][/ROW]
[ROW][C]47[/C][C]-0.033005[/C][C]-0.4278[/C][C]0.334672[/C][/ROW]
[ROW][C]48[/C][C]-0.009453[/C][C]-0.1225[/C][C]0.451313[/C][/ROW]
[ROW][C]49[/C][C]-0.028985[/C][C]-0.3757[/C][C]0.353811[/C][/ROW]
[ROW][C]50[/C][C]0.00365[/C][C]0.0473[/C][C]0.481159[/C][/ROW]
[ROW][C]51[/C][C]0.037393[/C][C]0.4847[/C][C]0.314269[/C][/ROW]
[ROW][C]52[/C][C]0.025724[/C][C]0.3334[/C][C]0.369615[/C][/ROW]
[ROW][C]53[/C][C]-0.046758[/C][C]-0.606[/C][C]0.27265[/C][/ROW]
[ROW][C]54[/C][C]0.029343[/C][C]0.3803[/C][C]0.352092[/C][/ROW]
[ROW][C]55[/C][C]-0.015944[/C][C]-0.2067[/C][C]0.418264[/C][/ROW]
[ROW][C]56[/C][C]-0.010164[/C][C]-0.1317[/C][C]0.447676[/C][/ROW]
[ROW][C]57[/C][C]0.014613[/C][C]0.1894[/C][C]0.425[/C][/ROW]
[ROW][C]58[/C][C]-0.018843[/C][C]-0.2442[/C][C]0.403672[/C][/ROW]
[ROW][C]59[/C][C]0.007077[/C][C]0.0917[/C][C]0.463513[/C][/ROW]
[ROW][C]60[/C][C]-0.01856[/C][C]-0.2406[/C][C]0.405094[/C][/ROW]
[/TABLE]
Source: https://freestatistics.org/blog/index.php?pk=76656&T=2

Globally Unique Identifier (entire table): ba.freestatistics.org/blog/index.php?pk=76656&T=2

As an alternative you can also use a QR Code:  

The GUIDs for individual cells are displayed in the table below:

Partial Autocorrelation Function
Time lag kPACF(k)T-STATP-value
10.89157411.55610
2-0.081546-1.0570.146024
3-0.281767-3.65210.000174
40.0322160.41760.338399
50.350264.53995e-06
6-0.082228-1.06580.144023
70.2834823.67430.00016
80.0918761.19080.117697
90.3990915.17280
100.3044743.94645.8e-05
110.0627320.81310.208656
120.2223652.88220.002233
13-0.631849-8.18970
14-0.016037-0.20790.417795
150.0729120.9450.172996
16-0.040095-0.51970.301981
17-0.086777-1.12480.131149
18-0.037424-0.48510.314129
19-0.046171-0.59840.275175
200.0290330.37630.353583
210.0358330.46440.321464
220.0519510.67340.250823
230.0465630.60350.273484
240.0458990.59490.27635
25-0.182006-2.35910.009735
260.0819661.06240.144789
270.0561230.72740.233985
28-0.03423-0.44370.328927
29-0.036461-0.47260.318561
300.0016470.02140.491495
31-0.055693-0.72190.23569
32-0.008491-0.11010.456249
33-0.013836-0.17930.428943
340.0291640.3780.35295
350.0025330.03280.486922
360.0072520.0940.462612
37-0.105765-1.37090.086121
38-0.017088-0.22150.412491
390.0391840.50790.306099
40-0.03226-0.41810.338192
41-0.081586-1.05750.145908
420.0062180.08060.467929
43-0.031591-0.40950.341361
44-0.032538-0.42170.336875
45-0.017695-0.22940.409437
46-0.013028-0.16890.433056
47-0.033005-0.42780.334672
48-0.009453-0.12250.451313
49-0.028985-0.37570.353811
500.003650.04730.481159
510.0373930.48470.314269
520.0257240.33340.369615
53-0.046758-0.6060.27265
540.0293430.38030.352092
55-0.015944-0.20670.418264
56-0.010164-0.13170.447676
570.0146130.18940.425
58-0.018843-0.24420.403672
590.0070770.09170.463513
60-0.01856-0.24060.405094


Parameters (Session):
par1 = 60 ; par2 = 1 ; par3 = 0 ; par4 = 0 ; par5 = 12 ; par6 = White Noise ; par7 = 0.95 ;
Parameters (R input):
par1 = 60 ; par2 = 1 ; par3 = 0 ; par4 = 0 ; par5 = 12 ; par6 = White Noise ; par7 = 0.95 ;
R code (references can be found in the software module):
if (par1 == 'Default') {
par1 = 10*log10(length(x))
} else {
par1 <- as.numeric(par1)
}
par2 <- as.numeric(par2)
par3 <- as.numeric(par3)
par4 <- as.numeric(par4)
par5 <- as.numeric(par5)
if (par6 == 'White Noise') par6 <- 'white' else par6 <- 'ma'
par7 <- as.numeric(par7)
if (par2 == 0) {
x <- log(x)
} else {
x <- (x ^ par2 - 1) / par2
}
if (par3 > 0) x <- diff(x,lag=1,difference=par3)
if (par4 > 0) x <- diff(x,lag=par5,difference=par4)
bitmap(file='pic1.png')
racf <- acf(x, par1, main='Autocorrelation', xlab='time lag', ylab='ACF', ci.type=par6, ci=par7, sub=paste('(lambda=',par2,', d=',par3,', D=',par4,', CI=', par7, ', CI type=',par6,')',sep=''))
dev.off()
bitmap(file='pic2.png')
rpacf <- pacf(x,par1,main='Partial Autocorrelation',xlab='lags',ylab='PACF')
dev.off()
(myacf <- c(racf$acf))
(mypacf <- c(rpacf$acf))
lengthx <- length(x)
sqrtn <- sqrt(lengthx)
load(file='createtable')
a<-table.start()
a<-table.row.start(a)
a<-table.element(a,'Autocorrelation Function',4,TRUE)
a<-table.row.end(a)
a<-table.row.start(a)
a<-table.element(a,'Time lag k',header=TRUE)
a<-table.element(a,hyperlink('basics.htm','ACF(k)','click here for more information about the Autocorrelation Function'),header=TRUE)
a<-table.element(a,'T-STAT',header=TRUE)
a<-table.element(a,'P-value',header=TRUE)
a<-table.row.end(a)
for (i in 2:(par1+1)) {
a<-table.row.start(a)
a<-table.element(a,i-1,header=TRUE)
a<-table.element(a,round(myacf[i],6))
mytstat <- myacf[i]*sqrtn
a<-table.element(a,round(mytstat,4))
a<-table.element(a,round(1-pt(abs(mytstat),lengthx),6))
a<-table.row.end(a)
}
a<-table.end(a)
table.save(a,file='mytable.tab')
a<-table.start()
a<-table.row.start(a)
a<-table.element(a,'Partial Autocorrelation Function',4,TRUE)
a<-table.row.end(a)
a<-table.row.start(a)
a<-table.element(a,'Time lag k',header=TRUE)
a<-table.element(a,hyperlink('basics.htm','PACF(k)','click here for more information about the Partial Autocorrelation Function'),header=TRUE)
a<-table.element(a,'T-STAT',header=TRUE)
a<-table.element(a,'P-value',header=TRUE)
a<-table.row.end(a)
for (i in 1:par1) {
a<-table.row.start(a)
a<-table.element(a,i,header=TRUE)
a<-table.element(a,round(mypacf[i],6))
mytstat <- mypacf[i]*sqrtn
a<-table.element(a,round(mytstat,4))
a<-table.element(a,round(1-pt(abs(mytstat),lengthx),6))
a<-table.row.end(a)
}
a<-table.end(a)
table.save(a,file='mytable1.tab')