Free Statistics
of Irreproducible Research!
Description of Statistical Computation | |||||||||||||||||||||||||||||||||||||||||
|---|---|---|---|---|---|---|---|---|---|---|---|---|---|---|---|---|---|---|---|---|---|---|---|---|---|---|---|---|---|---|---|---|---|---|---|---|---|---|---|---|---|
| Author's title | |||||||||||||||||||||||||||||||||||||||||
| Author | *Unverified author* | ||||||||||||||||||||||||||||||||||||||||
| R Software Module | rwasp_univariatedataseries.wasp | ||||||||||||||||||||||||||||||||||||||||
| Title produced by software | Univariate Data Series | ||||||||||||||||||||||||||||||||||||||||
| Date of computation | Sat, 29 May 2010 10:35:37 +0000 | ||||||||||||||||||||||||||||||||||||||||
| Cite this page as follows | Statistical Computations at FreeStatistics.org, Office for Research Development and Education, URL https://freestatistics.org/blog/index.php?v=date/2010/May/29/t127512944929b66si4o2se1pg.htm/, Retrieved Sun, 28 Apr 2024 00:01:23 +0000 | ||||||||||||||||||||||||||||||||||||||||
| Statistical Computations at FreeStatistics.org, Office for Research Development and Education, URL https://freestatistics.org/blog/index.php?pk=76651, Retrieved Sun, 28 Apr 2024 00:01:23 +0000 | |||||||||||||||||||||||||||||||||||||||||
| QR Codes: | |||||||||||||||||||||||||||||||||||||||||
|
| |||||||||||||||||||||||||||||||||||||||||
| Original text written by user: | |||||||||||||||||||||||||||||||||||||||||
| IsPrivate? | No (this computation is public) | ||||||||||||||||||||||||||||||||||||||||
| User-defined keywords | KDGP2W12 | ||||||||||||||||||||||||||||||||||||||||
| Estimated Impact | 200 | ||||||||||||||||||||||||||||||||||||||||
Tree of Dependent Computations | |||||||||||||||||||||||||||||||||||||||||
| Family? (F = Feedback message, R = changed R code, M = changed R Module, P = changed Parameters, D = changed Data) | |||||||||||||||||||||||||||||||||||||||||
| - [Univariate Data Series] [Maandelijkse melk...] [2010-05-29 10:35:37] [5e13855820c5420788a37eb4bc7648e0] [Current] | |||||||||||||||||||||||||||||||||||||||||
| Feedback Forum | |||||||||||||||||||||||||||||||||||||||||
Post a new message | |||||||||||||||||||||||||||||||||||||||||
Dataset | |||||||||||||||||||||||||||||||||||||||||
| Dataseries X: | |||||||||||||||||||||||||||||||||||||||||
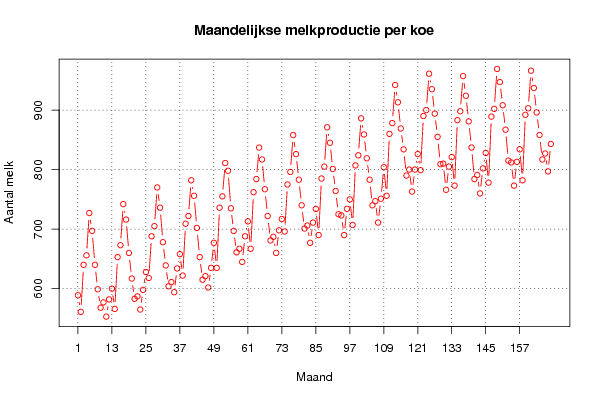
589 561 640 656 727 697 640 599 568 577 553 582 600 566 653 673 742 716 660 617 583 587 565 598 628 618 688 705 770 736 678 639 604 611 594 634 658 622 709 722 782 756 702 653 615 621 602 635 677 635 736 755 811 798 735 697 661 667 645 688 713 667 762 784 837 817 767 722 681 687 660 698 717 696 775 796 858 826 783 740 701 706 677 711 734 690 785 805 871 845 801 764 725 723 690 734 750 707 807 824 886 859 819 783 740 747 711 751 804 756 860 878 942 913 869 834 790 800 763 800 826 799 890 900 961 935 894 855 809 810 766 805 821 773 883 898 957 924 881 837 784 791 760 802 828 778 889 902 969 947 908 867 815 812 773 813 834 782 892 903 966 937 896 858 817 827 797 843 | |||||||||||||||||||||||||||||||||||||||||
Tables (Output of Computation) | |||||||||||||||||||||||||||||||||||||||||
| |||||||||||||||||||||||||||||||||||||||||
Figures (Output of Computation) | |||||||||||||||||||||||||||||||||||||||||
Input Parameters & R Code | |||||||||||||||||||||||||||||||||||||||||
| Parameters (Session): | |||||||||||||||||||||||||||||||||||||||||
| par1 = Maandelijkse melkproductie per koe ; par2 = http://www.robjhyndman.com/TSDL/index.htm ; par3 = Maandelijkse melkproductie ; par4 = 12 ; | |||||||||||||||||||||||||||||||||||||||||
| Parameters (R input): | |||||||||||||||||||||||||||||||||||||||||
| par1 = Maandelijkse melkproductie per koe ; par2 = http://www.robjhyndman.com/TSDL/index.htm ; par3 = Maandelijkse melkproductie ; par4 = 12 ; | |||||||||||||||||||||||||||||||||||||||||
| R code (references can be found in the software module): | |||||||||||||||||||||||||||||||||||||||||
if (par4 != 'No season') { | |||||||||||||||||||||||||||||||||||||||||