Free Statistics

of Irreproducible Research!

Author's title

Author*Unverified author*
R Software Modulerwasp_regression_trees.wasp
Title produced by softwareRecursive Partitioning (Regression Trees)
Date of computationWed, 26 May 2010 11:23:18 +0000
Cite this page as followsStatistical Computations at FreeStatistics.org, Office for Research Development and Education, URL https://freestatistics.org/blog/index.php?v=date/2010/May/26/t1274873074q8lr4sa72leqmhy.htm/, Retrieved Fri, 03 May 2024 07:51:58 +0000
Statistical Computations at FreeStatistics.org, Office for Research Development and Education, URL https://freestatistics.org/blog/index.php?pk=76457, Retrieved Fri, 03 May 2024 07:51:58 +0000
QR Codes:

Original text written by user:
IsPrivate?No (this computation is public)
User-defined keywordsB511,regression tree,steven,coomans,thesis,per2maand
Estimated Impact163
Family? (F = Feedback message, R = changed R code, M = changed R Module, P = changed Parameters, D = changed Data)
-       [Recursive Partitioning (Regression Trees)] [B511,regression t...] [2010-05-26 11:23:18] [d41d8cd98f00b204e9800998ecf8427e] [Current]
Feedback Forum

Post a new message
Dataseries X:
66	NA	65.9293366525043	65.9340000655022	55
71	66	70.8680320462113	67.4510134015007	77
50	66.5	50.2163309228226	65.1096772035754	66,4
66	64.85	65.9827164753333	63.3900574001068	66
66	64.965	65.9993404862515	65.7651067120978	55
44	65.0685	44.3436189251445	56.7231840728576	44
76.75	62.96165	76.6231024714092	61.0647320143803	55
66	64.340485	66.0460290529034	64.1024412875046	33
65.75	64.5064365	65.8141920877573	55.3499659970663	77
76.75	64.63079285	76.674093729902	72.1767781103031	66
65	65.842713565	65.1023563693362	68.3625842416714	77
76	65.7584422085	75.9657948158125	67.7363072850427	66
88	66.78259798765	87.819777379446	74.280295689305	88
75.5	68.904338188885	75.5018569541544	72.3141534058821	88
97.5	69.5639043699965	97.2291009532818	78.2382585173593	77,75
98	72.3575139329969	97.7403340016694	87.6827804286996	88
88.0115	74.9217625396972	87.8957556168923	84.8565432816706	99
55.25	76.2307362857275	55.5590661695737	95.469375671624	77
88.25	74.1326626571547	88.1610477971363	86.4534430561582	88
87	75.5443963914393	86.940601684571	81.6480522907467	120
75.5	76.6899567522953	75.592583208209	68.8361541965404	88
88	76.5709610770658	87.955890234155	85.1449520700068	77
74.5	77.7138649693592	74.6272559913572	84.9718409849175	101,25
63.5	77.3924784724233	63.7653950698418	77.7240276566534	77
94	76.003230625181	93.9259056838178	79.8596794457166	88


Summary of computational transaction
Raw Inputview raw input (R code)
Raw Outputview raw output of R engine
Computing time3 seconds
R Server'Sir Ronald Aylmer Fisher' @ 193.190.124.24
R Framework error message
Warning: there are blank lines in the 'Data X' field.
Please, use NA for missing data - blank lines are simply
 deleted and are NOT treated as missing values.

\begin{tabular}{lllllllll}
\hline
Summary of computational transaction \tabularnewline
Raw Input & view raw input (R code)  \tabularnewline
Raw Output & view raw output of R engine  \tabularnewline
Computing time & 3 seconds \tabularnewline
R Server & 'Sir Ronald Aylmer Fisher' @ 193.190.124.24 \tabularnewline
R Framework error message & 
Warning: there are blank lines in the 'Data X' field.
Please, use NA for missing data - blank lines are simply
 deleted and are NOT treated as missing values.
\tabularnewline \hline \end{tabular} %Source: https://freestatistics.org/blog/index.php?pk=76457&T=0

[TABLE]
[ROW][C]Summary of computational transaction[/C][/ROW]
[ROW][C]Raw Input[/C][C]view raw input (R code) [/C][/ROW]
[ROW][C]Raw Output[/C][C]view raw output of R engine [/C][/ROW]
[ROW][C]Computing time[/C][C]3 seconds[/C][/ROW]
[ROW][C]R Server[/C][C]'Sir Ronald Aylmer Fisher' @ 193.190.124.24[/C][/ROW]
[ROW][C]R Framework error message[/C][C]
Warning: there are blank lines in the 'Data X' field.
Please, use NA for missing data - blank lines are simply
 deleted and are NOT treated as missing values.
[/C][/ROW] [/TABLE] Source: https://freestatistics.org/blog/index.php?pk=76457&T=0

Globally Unique Identifier (entire table): ba.freestatistics.org/blog/index.php?pk=76457&T=0

As an alternative you can also use a QR Code:  

The GUIDs for individual cells are displayed in the table below:

Summary of computational transaction
Raw Inputview raw input (R code)
Raw Outputview raw output of R engine
Computing time3 seconds
R Server'Sir Ronald Aylmer Fisher' @ 193.190.124.24
R Framework error message
Warning: there are blank lines in the 'Data X' field.
Please, use NA for missing data - blank lines are simply
 deleted and are NOT treated as missing values.


Model Performance
#Complexitysplitrelative errorCV errorCV S.D.
10.668011.0940.261
20.0110.3320.5320.126

\begin{tabular}{lllllllll}
\hline
Model Performance \tabularnewline
# & Complexity & split & relative error & CV error & CV S.D. \tabularnewline
1 & 0.668 & 0 & 1 & 1.094 & 0.261 \tabularnewline
2 & 0.01 & 1 & 0.332 & 0.532 & 0.126 \tabularnewline
\hline
\end{tabular}
%Source: https://freestatistics.org/blog/index.php?pk=76457&T=1

[TABLE]
[ROW][C]Model Performance[/C][/ROW]
[ROW][C]#[/C][C]Complexity[/C][C]split[/C][C]relative error[/C][C]CV error[/C][C]CV S.D.[/C][/ROW]
[ROW][C]1[/C][C]0.668[/C][C]0[/C][C]1[/C][C]1.094[/C][C]0.261[/C][/ROW]
[ROW][C]2[/C][C]0.01[/C][C]1[/C][C]0.332[/C][C]0.532[/C][C]0.126[/C][/ROW]
[/TABLE]
Source: https://freestatistics.org/blog/index.php?pk=76457&T=1

Globally Unique Identifier (entire table): ba.freestatistics.org/blog/index.php?pk=76457&T=1

As an alternative you can also use a QR Code:  

The GUIDs for individual cells are displayed in the table below:

Model Performance
#Complexitysplitrelative errorCV errorCV S.D.
10.668011.0940.261
20.0110.3320.5320.126


Parameters (Session):
par1 = 1 ; par2 = No ;
Parameters (R input):
par1 = 1 ; par2 = No ;
R code (references can be found in the software module):
library(rpart)
library(partykit)
par1 <- as.numeric(par1)
autoprune <- function ( tree, method='Minimum CV'){
xerr <- tree$cptable[,'xerror']
cpmin.id <- which.min(xerr)
if (method == 'Minimum CV Error plus 1 SD'){
xstd <- tree$cptable[,'xstd']
errt <- xerr[cpmin.id] + xstd[cpmin.id]
cpSE1.min <- which.min( errt < xerr )
mycp <- (tree$cptable[,'CP'])[cpSE1.min]
}
if (method == 'Minimum CV') {
mycp <- (tree$cptable[,'CP'])[cpmin.id]
}
return (mycp)
}
conf.multi.mat <- function(true, new)
{
if ( all( is.na(match( levels(true),levels(new) ) )) )
stop ( 'conflict of vector levels')
multi.t <- list()
for (mylev in levels(true) ) {
true.tmp <- true
new.tmp <- new
left.lev <- levels (true.tmp)[- match(mylev,levels(true) ) ]
levels(true.tmp) <- list ( mylev = mylev, all = left.lev )
levels(new.tmp) <- list ( mylev = mylev, all = left.lev )
curr.t <- conf.mat ( true.tmp , new.tmp )
multi.t[[mylev]] <- curr.t
multi.t[[mylev]]$precision <-
round( curr.t$conf[1,1] / sum( curr.t$conf[1,] ), 2 )
}
return (multi.t)
}
x <- t(y)
k <- length(x[1,])
n <- length(x[,1])
x1 <- cbind(x[,par1], x[,1:k!=par1])
mycolnames <- c(colnames(x)[par1], colnames(x)[1:k!=par1])
colnames(x1) <- mycolnames #colnames(x)[par1]
m <- rpart(as.data.frame(x1))
par2
if (par2 != 'No') {
mincp <- autoprune(m,method=par2)
print(mincp)
m <- prune(m,cp=mincp)
}
m$cptable
bitmap(file='test1.png')
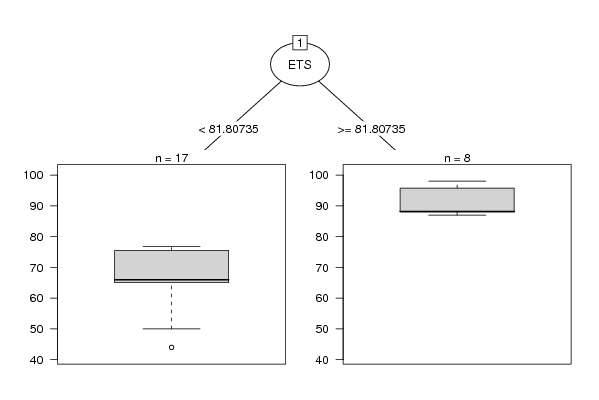
plot(as.party(m),tp_args=list(id=FALSE))
dev.off()
bitmap(file='test2.png')
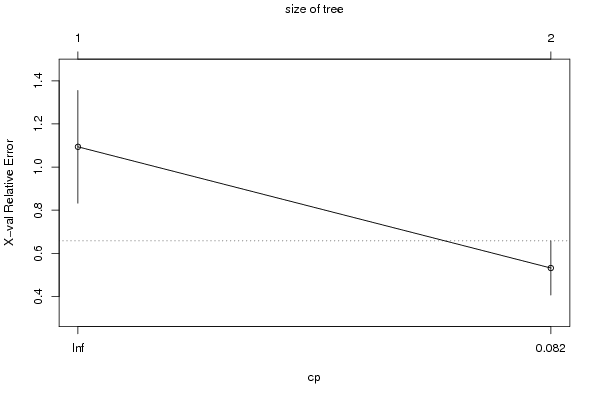
plotcp(m)
dev.off()
cbind(y=m$y,pred=predict(m),res=residuals(m))
myr <- residuals(m)
myp <- predict(m)
bitmap(file='test4.png')
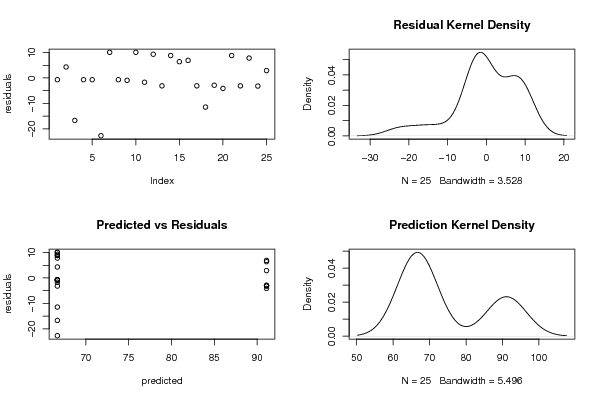
op <- par(mfrow=c(2,2))
plot(myr,ylab='residuals')
plot(density(myr),main='Residual Kernel Density')
plot(myp,myr,xlab='predicted',ylab='residuals',main='Predicted vs Residuals')
plot(density(myp),main='Prediction Kernel Density')
par(op)
dev.off()
load(file='createtable')
a<-table.start()
a<-table.row.start(a)
a<-table.element(a,'Model Performance',6,TRUE)
a<-table.row.end(a)
a<-table.row.start(a)
a<-table.element(a,'#',header=TRUE)
a<-table.element(a,'Complexity',header=TRUE)
a<-table.element(a,'split',header=TRUE)
a<-table.element(a,'relative error',header=TRUE)
a<-table.element(a,'CV error',header=TRUE)
a<-table.element(a,'CV S.D.',header=TRUE)
a<-table.row.end(a)
for (i in 1:length(m$cptable[,1])) {
a<-table.row.start(a)
a<-table.element(a,i,header=TRUE)
a<-table.element(a,round(m$cptable[i,'CP'],3))
a<-table.element(a,m$cptable[i,'nsplit'])
a<-table.element(a,round(m$cptable[i,'rel error'],3))
a<-table.element(a,round(m$cptable[i,'xerror'],3))
a<-table.element(a,round(m$cptable[i,'xstd'],3))
a<-table.row.end(a)
}
a<-table.end(a)
table.save(a,file='mytable.tab')