Free Statistics

of Irreproducible Research!

Author's title

Author*Unverified author*
R Software Modulerwasp_regression_trees.wasp
Title produced by softwareRecursive Partitioning (Regression Trees)
Date of computationWed, 26 May 2010 11:18:08 +0000
Cite this page as followsStatistical Computations at FreeStatistics.org, Office for Research Development and Education, URL https://freestatistics.org/blog/index.php?v=date/2010/May/26/t1274872737alncyl67vx7xnpc.htm/, Retrieved Fri, 03 May 2024 12:35:28 +0000
Statistical Computations at FreeStatistics.org, Office for Research Development and Education, URL https://freestatistics.org/blog/index.php?pk=76455, Retrieved Fri, 03 May 2024 12:35:28 +0000
QR Codes:

Original text written by user:
IsPrivate?No (this computation is public)
User-defined keywordsB28A,regression tree,steven,coomans,thesis,per2maand
Estimated Impact170
Family? (F = Feedback message, R = changed R code, M = changed R Module, P = changed Parameters, D = changed Data)
-       [Recursive Partitioning (Regression Trees)] [B28A,regression t...] [2010-05-26 11:18:08] [d41d8cd98f00b204e9800998ecf8427e] [Current]
Feedback Forum

Post a new message
Dataseries X:
250.75	NA	250.850152884021	251.27004	336,675
314.5125	250.75	314.369477869004	251.27004	352,25
449.3885	257.12625	448.784077969190	251.27004	392,025
305.7	276.352475	305.685475232751	251.27004	435,275
162.375	279.2872275	162.837106781298	251.27004	148,75
352.025	267.59600475	351.787128034443	251.27004	388,875
379.125	276.038904275	378.830448248692	251.27004	359,65
327.125	286.3475138475	327.047794937283	251.27004	139,9
423.6625	290.42526246275	423.280779333534	251.27004	440,5
152.25	303.748986216475	152.776138996337	251.27004	220,875
183.8125	288.599087594828	184.199992170458	251.27004	234,5
153.8875	278.120428835345	154.348519548268	251.27004	161,9
245.625	265.697135951810	245.711928676033	251.27004	258,25
108.9	263.689922356629	109.490720296634	251.27004	222,5
291.625	248.210930120966	291.441298968799	251.27004	279,35
284.875	252.552337108870	284.744734135499	251.27004	415,8
192.25	255.784603397983	192.499491581822	251.27004	168,9
45.2625	249.431143058184	46.0800968454689	251.27004	67,125
205.375	229.014278752366	205.452810842879	251.27004	170,5
301.25	226.650350877129	300.883977236240	251.27004	176,25
165.375	234.110315789416	165.658013776605	251.27004	175,25
281.6375	227.236784210475	281.371526167842	251.27004	262,625
140.5875	232.676855789427	140.975949750512	251.27004	263,3
331.75	223.467920210485	331.23300462894	251.27004	212,275
232.625	234.296128189436	232.626038312863	251.27004	171,775


Summary of computational transaction
Raw Inputview raw input (R code)
Raw Outputview raw output of R engine
Computing time3 seconds
R Server'Sir Ronald Aylmer Fisher' @ 193.190.124.24
R Framework error message
Warning: there are blank lines in the 'Data X' field.
Please, use NA for missing data - blank lines are simply
 deleted and are NOT treated as missing values.

\begin{tabular}{lllllllll}
\hline
Summary of computational transaction \tabularnewline
Raw Input & view raw input (R code)  \tabularnewline
Raw Output & view raw output of R engine  \tabularnewline
Computing time & 3 seconds \tabularnewline
R Server & 'Sir Ronald Aylmer Fisher' @ 193.190.124.24 \tabularnewline
R Framework error message & 
Warning: there are blank lines in the 'Data X' field.
Please, use NA for missing data - blank lines are simply
 deleted and are NOT treated as missing values.
\tabularnewline \hline \end{tabular} %Source: https://freestatistics.org/blog/index.php?pk=76455&T=0

[TABLE]
[ROW][C]Summary of computational transaction[/C][/ROW]
[ROW][C]Raw Input[/C][C]view raw input (R code) [/C][/ROW]
[ROW][C]Raw Output[/C][C]view raw output of R engine [/C][/ROW]
[ROW][C]Computing time[/C][C]3 seconds[/C][/ROW]
[ROW][C]R Server[/C][C]'Sir Ronald Aylmer Fisher' @ 193.190.124.24[/C][/ROW]
[ROW][C]R Framework error message[/C][C]
Warning: there are blank lines in the 'Data X' field.
Please, use NA for missing data - blank lines are simply
 deleted and are NOT treated as missing values.
[/C][/ROW] [/TABLE] Source: https://freestatistics.org/blog/index.php?pk=76455&T=0

Globally Unique Identifier (entire table): ba.freestatistics.org/blog/index.php?pk=76455&T=0

As an alternative you can also use a QR Code:  

The GUIDs for individual cells are displayed in the table below:

Summary of computational transaction
Raw Inputview raw input (R code)
Raw Outputview raw output of R engine
Computing time3 seconds
R Server'Sir Ronald Aylmer Fisher' @ 193.190.124.24
R Framework error message
Warning: there are blank lines in the 'Data X' field.
Please, use NA for missing data - blank lines are simply
 deleted and are NOT treated as missing values.


Model Performance
#Complexitysplitrelative errorCV errorCV S.D.
10.703011.0730.258
20.0110.2970.4010.107

\begin{tabular}{lllllllll}
\hline
Model Performance \tabularnewline
# & Complexity & split & relative error & CV error & CV S.D. \tabularnewline
1 & 0.703 & 0 & 1 & 1.073 & 0.258 \tabularnewline
2 & 0.01 & 1 & 0.297 & 0.401 & 0.107 \tabularnewline
\hline
\end{tabular}
%Source: https://freestatistics.org/blog/index.php?pk=76455&T=1

[TABLE]
[ROW][C]Model Performance[/C][/ROW]
[ROW][C]#[/C][C]Complexity[/C][C]split[/C][C]relative error[/C][C]CV error[/C][C]CV S.D.[/C][/ROW]
[ROW][C]1[/C][C]0.703[/C][C]0[/C][C]1[/C][C]1.073[/C][C]0.258[/C][/ROW]
[ROW][C]2[/C][C]0.01[/C][C]1[/C][C]0.297[/C][C]0.401[/C][C]0.107[/C][/ROW]
[/TABLE]
Source: https://freestatistics.org/blog/index.php?pk=76455&T=1

Globally Unique Identifier (entire table): ba.freestatistics.org/blog/index.php?pk=76455&T=1

As an alternative you can also use a QR Code:  

The GUIDs for individual cells are displayed in the table below:

Model Performance
#Complexitysplitrelative errorCV errorCV S.D.
10.703011.0730.258
20.0110.2970.4010.107


Parameters (Session):
par1 = 1 ; par2 = No ;
Parameters (R input):
par1 = 1 ; par2 = No ;
R code (references can be found in the software module):
library(rpart)
library(partykit)
par1 <- as.numeric(par1)
autoprune <- function ( tree, method='Minimum CV'){
xerr <- tree$cptable[,'xerror']
cpmin.id <- which.min(xerr)
if (method == 'Minimum CV Error plus 1 SD'){
xstd <- tree$cptable[,'xstd']
errt <- xerr[cpmin.id] + xstd[cpmin.id]
cpSE1.min <- which.min( errt < xerr )
mycp <- (tree$cptable[,'CP'])[cpSE1.min]
}
if (method == 'Minimum CV') {
mycp <- (tree$cptable[,'CP'])[cpmin.id]
}
return (mycp)
}
conf.multi.mat <- function(true, new)
{
if ( all( is.na(match( levels(true),levels(new) ) )) )
stop ( 'conflict of vector levels')
multi.t <- list()
for (mylev in levels(true) ) {
true.tmp <- true
new.tmp <- new
left.lev <- levels (true.tmp)[- match(mylev,levels(true) ) ]
levels(true.tmp) <- list ( mylev = mylev, all = left.lev )
levels(new.tmp) <- list ( mylev = mylev, all = left.lev )
curr.t <- conf.mat ( true.tmp , new.tmp )
multi.t[[mylev]] <- curr.t
multi.t[[mylev]]$precision <-
round( curr.t$conf[1,1] / sum( curr.t$conf[1,] ), 2 )
}
return (multi.t)
}
x <- t(y)
k <- length(x[1,])
n <- length(x[,1])
x1 <- cbind(x[,par1], x[,1:k!=par1])
mycolnames <- c(colnames(x)[par1], colnames(x)[1:k!=par1])
colnames(x1) <- mycolnames #colnames(x)[par1]
m <- rpart(as.data.frame(x1))
par2
if (par2 != 'No') {
mincp <- autoprune(m,method=par2)
print(mincp)
m <- prune(m,cp=mincp)
}
m$cptable
bitmap(file='test1.png')
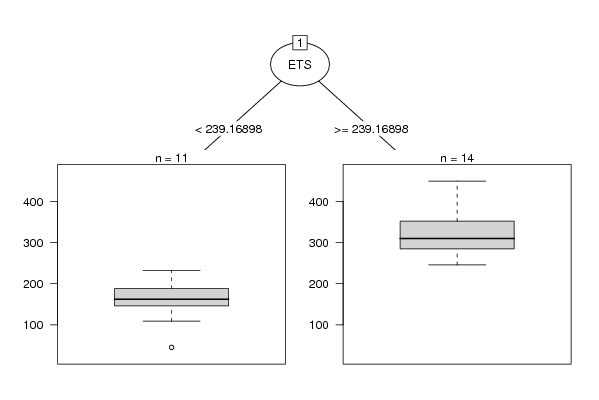
plot(as.party(m),tp_args=list(id=FALSE))
dev.off()
bitmap(file='test2.png')
plotcp(m)
dev.off()
cbind(y=m$y,pred=predict(m),res=residuals(m))
myr <- residuals(m)
myp <- predict(m)
bitmap(file='test4.png')
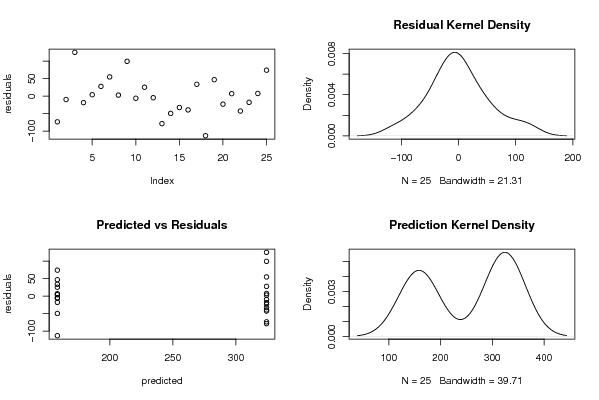
op <- par(mfrow=c(2,2))
plot(myr,ylab='residuals')
plot(density(myr),main='Residual Kernel Density')
plot(myp,myr,xlab='predicted',ylab='residuals',main='Predicted vs Residuals')
plot(density(myp),main='Prediction Kernel Density')
par(op)
dev.off()
load(file='createtable')
a<-table.start()
a<-table.row.start(a)
a<-table.element(a,'Model Performance',6,TRUE)
a<-table.row.end(a)
a<-table.row.start(a)
a<-table.element(a,'#',header=TRUE)
a<-table.element(a,'Complexity',header=TRUE)
a<-table.element(a,'split',header=TRUE)
a<-table.element(a,'relative error',header=TRUE)
a<-table.element(a,'CV error',header=TRUE)
a<-table.element(a,'CV S.D.',header=TRUE)
a<-table.row.end(a)
for (i in 1:length(m$cptable[,1])) {
a<-table.row.start(a)
a<-table.element(a,i,header=TRUE)
a<-table.element(a,round(m$cptable[i,'CP'],3))
a<-table.element(a,m$cptable[i,'nsplit'])
a<-table.element(a,round(m$cptable[i,'rel error'],3))
a<-table.element(a,round(m$cptable[i,'xerror'],3))
a<-table.element(a,round(m$cptable[i,'xstd'],3))
a<-table.row.end(a)
}
a<-table.end(a)
table.save(a,file='mytable.tab')