Free Statistics

of Irreproducible Research!

Author's title

Author*Unverified author*
R Software Modulerwasp_smp.wasp
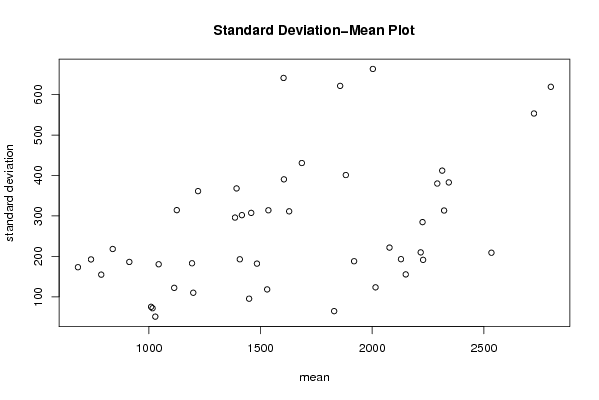
Title produced by softwareStandard Deviation-Mean Plot
Date of computationTue, 25 May 2010 20:11:09 +0000
Cite this page as followsStatistical Computations at FreeStatistics.org, Office for Research Development and Education, URL https://freestatistics.org/blog/index.php?v=date/2010/May/25/t127481856076x4q5a5e5igsqz.htm/, Retrieved Thu, 02 May 2024 06:42:48 +0000
Statistical Computations at FreeStatistics.org, Office for Research Development and Education, URL https://freestatistics.org/blog/index.php?pk=76434, Retrieved Thu, 02 May 2024 06:42:48 +0000
QR Codes:

Original text written by user:
IsPrivate?No (this computation is public)
User-defined keywordsKDGP2W83
Estimated Impact151
Family? (F = Feedback message, R = changed R code, M = changed R Module, P = changed Parameters, D = changed Data)
-       [Standard Deviation-Mean Plot] [] [2010-05-25 20:11:09] [13e54f0739946d6dee34031af09f7a3a] [Current]
-   P     [Standard Deviation-Mean Plot] [] [2010-06-06 11:21:20] [2fbaf5ccc70c33c9f381ff70d4cbb0a5]
Feedback Forum

Post a new message
Dataseries X:
464
675
703
887
1139
1077
1318
1260
1120
963
996
960
530
883
894
1045
1199
1287
1565
1577
1076
918
1008
1063
544
635
804
980
1018
1064
1404
1286
1104
999
996
1015
615
722
832
977
1270
1437
1520
1708
1151
934
1159
1209
699
830
996
1124
1458
1270
1753
2258
1208
1241
1265
1828
809
997
1164
1205
1538
1513
1378
2083
1357
1536
1526
1376
779
1005
1193
1522
1539
1546
2116
2326
1596
1356
1553
1613
814
1150
1225
1691
1759
1754
2100
2062
2012
1897
1964
2186
966
1549
1538
1612
2078
2137
2907
2249
1883
1739
1828
1868
1138
1430
1809
1763
2200
2067
2503
2141
2103
1972
2181
2344
970
1199
1718
1683
2025
2051
2439
2353
2230
1852
2147
2286
1007
1665
1642
1518
1831
2207
2822
2393
2306
1785
2047
2171
1212
1335
2011
1860
1954
2152
2835
2224
2182
1992
2389
2724
891
1247
2017
2257
2255
2255
3057
3330
1896
2096
2374
2535
1041
1728
2201
2455
2204
2660
3670
2665
2639
2226
2586
2684
1185
1749
2459
2618
2585
3310
3923


Summary of computational transaction
Raw Inputview raw input (R code)
Raw Outputview raw output of R engine
Computing time4 seconds
R Server'George Udny Yule' @ 72.249.76.132

\begin{tabular}{lllllllll}
\hline
Summary of computational transaction \tabularnewline
Raw Input & view raw input (R code)  \tabularnewline
Raw Output & view raw output of R engine  \tabularnewline
Computing time & 4 seconds \tabularnewline
R Server & 'George Udny Yule' @ 72.249.76.132 \tabularnewline
\hline
\end{tabular}
%Source: https://freestatistics.org/blog/index.php?pk=76434&T=0

[TABLE]
[ROW][C]Summary of computational transaction[/C][/ROW]
[ROW][C]Raw Input[/C][C]view raw input (R code) [/C][/ROW]
[ROW][C]Raw Output[/C][C]view raw output of R engine [/C][/ROW]
[ROW][C]Computing time[/C][C]4 seconds[/C][/ROW]
[ROW][C]R Server[/C][C]'George Udny Yule' @ 72.249.76.132[/C][/ROW]
[/TABLE]
Source: https://freestatistics.org/blog/index.php?pk=76434&T=0

Globally Unique Identifier (entire table): ba.freestatistics.org/blog/index.php?pk=76434&T=0

As an alternative you can also use a QR Code:  

The GUIDs for individual cells are displayed in the table below:

Summary of computational transaction
Raw Inputview raw input (R code)
Raw Outputview raw output of R engine
Computing time4 seconds
R Server'George Udny Yule' @ 72.249.76.132


Standard Deviation-Mean Plot
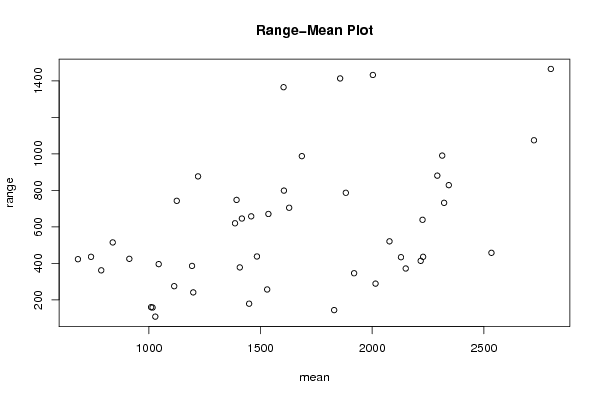
SectionMeanStandard DeviationRange
1682.25173.242363949083423
21198.5110.098440800343241
31009.7575.2877812131557160
4838218.230764711730515
51407192.810788079920378
61016.2571.8255989649002158
7740.75192.470560519438436
81193182.971764670582386
91028.551.0196040752964108
10786.5154.847236548369362
111483.75182.095899642652438
121113.25122.224861082624275
13912.25186.272873315825425
141684.75430.777107872118988
151385.5295.923976723753620
161043.75180.512926591606396
171628311.367949538805705
181448.7595.377757714609179
191124.75314.2974970735743
201881.75401.014027186082787
211529.5118.390596473425257
221220361.294893404266877
231918.75188.002437927455346
242014.75123.524289109470289
251416.25301.931973574623646
262342.75382.793569259812829
271829.564.645185435576144
281535313.950102192477671
292227.75191.397274449420436
302150155.445596056412372
311392.5368.007699194822748
322217209.920619917784414
332128.75193.134452303743434
341458307.520189039137658
352313.25411.922626229733991
362077.25221.691038760403521
371604.5390.388268266350799
382291.25380.050325614911881
392321.75313.364936349511732
401603641.0387403789781366
412724.25553.1867526733931075
422225.25284.711988975994639
431856.25621.4055975501561414
442799.75619.1232375975991466
452533.75209.039669281535458
462002.75663.2748927355331433

\begin{tabular}{lllllllll}
\hline
Standard Deviation-Mean Plot \tabularnewline
Section & Mean & Standard Deviation & Range \tabularnewline
1 & 682.25 & 173.242363949083 & 423 \tabularnewline
2 & 1198.5 & 110.098440800343 & 241 \tabularnewline
3 & 1009.75 & 75.2877812131557 & 160 \tabularnewline
4 & 838 & 218.230764711730 & 515 \tabularnewline
5 & 1407 & 192.810788079920 & 378 \tabularnewline
6 & 1016.25 & 71.8255989649002 & 158 \tabularnewline
7 & 740.75 & 192.470560519438 & 436 \tabularnewline
8 & 1193 & 182.971764670582 & 386 \tabularnewline
9 & 1028.5 & 51.0196040752964 & 108 \tabularnewline
10 & 786.5 & 154.847236548369 & 362 \tabularnewline
11 & 1483.75 & 182.095899642652 & 438 \tabularnewline
12 & 1113.25 & 122.224861082624 & 275 \tabularnewline
13 & 912.25 & 186.272873315825 & 425 \tabularnewline
14 & 1684.75 & 430.777107872118 & 988 \tabularnewline
15 & 1385.5 & 295.923976723753 & 620 \tabularnewline
16 & 1043.75 & 180.512926591606 & 396 \tabularnewline
17 & 1628 & 311.367949538805 & 705 \tabularnewline
18 & 1448.75 & 95.377757714609 & 179 \tabularnewline
19 & 1124.75 & 314.2974970735 & 743 \tabularnewline
20 & 1881.75 & 401.014027186082 & 787 \tabularnewline
21 & 1529.5 & 118.390596473425 & 257 \tabularnewline
22 & 1220 & 361.294893404266 & 877 \tabularnewline
23 & 1918.75 & 188.002437927455 & 346 \tabularnewline
24 & 2014.75 & 123.524289109470 & 289 \tabularnewline
25 & 1416.25 & 301.931973574623 & 646 \tabularnewline
26 & 2342.75 & 382.793569259812 & 829 \tabularnewline
27 & 1829.5 & 64.645185435576 & 144 \tabularnewline
28 & 1535 & 313.950102192477 & 671 \tabularnewline
29 & 2227.75 & 191.397274449420 & 436 \tabularnewline
30 & 2150 & 155.445596056412 & 372 \tabularnewline
31 & 1392.5 & 368.007699194822 & 748 \tabularnewline
32 & 2217 & 209.920619917784 & 414 \tabularnewline
33 & 2128.75 & 193.134452303743 & 434 \tabularnewline
34 & 1458 & 307.520189039137 & 658 \tabularnewline
35 & 2313.25 & 411.922626229733 & 991 \tabularnewline
36 & 2077.25 & 221.691038760403 & 521 \tabularnewline
37 & 1604.5 & 390.388268266350 & 799 \tabularnewline
38 & 2291.25 & 380.050325614911 & 881 \tabularnewline
39 & 2321.75 & 313.364936349511 & 732 \tabularnewline
40 & 1603 & 641.038740378978 & 1366 \tabularnewline
41 & 2724.25 & 553.186752673393 & 1075 \tabularnewline
42 & 2225.25 & 284.711988975994 & 639 \tabularnewline
43 & 1856.25 & 621.405597550156 & 1414 \tabularnewline
44 & 2799.75 & 619.123237597599 & 1466 \tabularnewline
45 & 2533.75 & 209.039669281535 & 458 \tabularnewline
46 & 2002.75 & 663.274892735533 & 1433 \tabularnewline
\hline
\end{tabular}
%Source: https://freestatistics.org/blog/index.php?pk=76434&T=1

[TABLE]
[ROW][C]Standard Deviation-Mean Plot[/C][/ROW]
[ROW][C]Section[/C][C]Mean[/C][C]Standard Deviation[/C][C]Range[/C][/ROW]
[ROW][C]1[/C][C]682.25[/C][C]173.242363949083[/C][C]423[/C][/ROW]
[ROW][C]2[/C][C]1198.5[/C][C]110.098440800343[/C][C]241[/C][/ROW]
[ROW][C]3[/C][C]1009.75[/C][C]75.2877812131557[/C][C]160[/C][/ROW]
[ROW][C]4[/C][C]838[/C][C]218.230764711730[/C][C]515[/C][/ROW]
[ROW][C]5[/C][C]1407[/C][C]192.810788079920[/C][C]378[/C][/ROW]
[ROW][C]6[/C][C]1016.25[/C][C]71.8255989649002[/C][C]158[/C][/ROW]
[ROW][C]7[/C][C]740.75[/C][C]192.470560519438[/C][C]436[/C][/ROW]
[ROW][C]8[/C][C]1193[/C][C]182.971764670582[/C][C]386[/C][/ROW]
[ROW][C]9[/C][C]1028.5[/C][C]51.0196040752964[/C][C]108[/C][/ROW]
[ROW][C]10[/C][C]786.5[/C][C]154.847236548369[/C][C]362[/C][/ROW]
[ROW][C]11[/C][C]1483.75[/C][C]182.095899642652[/C][C]438[/C][/ROW]
[ROW][C]12[/C][C]1113.25[/C][C]122.224861082624[/C][C]275[/C][/ROW]
[ROW][C]13[/C][C]912.25[/C][C]186.272873315825[/C][C]425[/C][/ROW]
[ROW][C]14[/C][C]1684.75[/C][C]430.777107872118[/C][C]988[/C][/ROW]
[ROW][C]15[/C][C]1385.5[/C][C]295.923976723753[/C][C]620[/C][/ROW]
[ROW][C]16[/C][C]1043.75[/C][C]180.512926591606[/C][C]396[/C][/ROW]
[ROW][C]17[/C][C]1628[/C][C]311.367949538805[/C][C]705[/C][/ROW]
[ROW][C]18[/C][C]1448.75[/C][C]95.377757714609[/C][C]179[/C][/ROW]
[ROW][C]19[/C][C]1124.75[/C][C]314.2974970735[/C][C]743[/C][/ROW]
[ROW][C]20[/C][C]1881.75[/C][C]401.014027186082[/C][C]787[/C][/ROW]
[ROW][C]21[/C][C]1529.5[/C][C]118.390596473425[/C][C]257[/C][/ROW]
[ROW][C]22[/C][C]1220[/C][C]361.294893404266[/C][C]877[/C][/ROW]
[ROW][C]23[/C][C]1918.75[/C][C]188.002437927455[/C][C]346[/C][/ROW]
[ROW][C]24[/C][C]2014.75[/C][C]123.524289109470[/C][C]289[/C][/ROW]
[ROW][C]25[/C][C]1416.25[/C][C]301.931973574623[/C][C]646[/C][/ROW]
[ROW][C]26[/C][C]2342.75[/C][C]382.793569259812[/C][C]829[/C][/ROW]
[ROW][C]27[/C][C]1829.5[/C][C]64.645185435576[/C][C]144[/C][/ROW]
[ROW][C]28[/C][C]1535[/C][C]313.950102192477[/C][C]671[/C][/ROW]
[ROW][C]29[/C][C]2227.75[/C][C]191.397274449420[/C][C]436[/C][/ROW]
[ROW][C]30[/C][C]2150[/C][C]155.445596056412[/C][C]372[/C][/ROW]
[ROW][C]31[/C][C]1392.5[/C][C]368.007699194822[/C][C]748[/C][/ROW]
[ROW][C]32[/C][C]2217[/C][C]209.920619917784[/C][C]414[/C][/ROW]
[ROW][C]33[/C][C]2128.75[/C][C]193.134452303743[/C][C]434[/C][/ROW]
[ROW][C]34[/C][C]1458[/C][C]307.520189039137[/C][C]658[/C][/ROW]
[ROW][C]35[/C][C]2313.25[/C][C]411.922626229733[/C][C]991[/C][/ROW]
[ROW][C]36[/C][C]2077.25[/C][C]221.691038760403[/C][C]521[/C][/ROW]
[ROW][C]37[/C][C]1604.5[/C][C]390.388268266350[/C][C]799[/C][/ROW]
[ROW][C]38[/C][C]2291.25[/C][C]380.050325614911[/C][C]881[/C][/ROW]
[ROW][C]39[/C][C]2321.75[/C][C]313.364936349511[/C][C]732[/C][/ROW]
[ROW][C]40[/C][C]1603[/C][C]641.038740378978[/C][C]1366[/C][/ROW]
[ROW][C]41[/C][C]2724.25[/C][C]553.186752673393[/C][C]1075[/C][/ROW]
[ROW][C]42[/C][C]2225.25[/C][C]284.711988975994[/C][C]639[/C][/ROW]
[ROW][C]43[/C][C]1856.25[/C][C]621.405597550156[/C][C]1414[/C][/ROW]
[ROW][C]44[/C][C]2799.75[/C][C]619.123237597599[/C][C]1466[/C][/ROW]
[ROW][C]45[/C][C]2533.75[/C][C]209.039669281535[/C][C]458[/C][/ROW]
[ROW][C]46[/C][C]2002.75[/C][C]663.274892735533[/C][C]1433[/C][/ROW]
[/TABLE]
Source: https://freestatistics.org/blog/index.php?pk=76434&T=1

Globally Unique Identifier (entire table): ba.freestatistics.org/blog/index.php?pk=76434&T=1

As an alternative you can also use a QR Code:  

The GUIDs for individual cells are displayed in the table below:

Standard Deviation-Mean Plot
SectionMeanStandard DeviationRange
1682.25173.242363949083423
21198.5110.098440800343241
31009.7575.2877812131557160
4838218.230764711730515
51407192.810788079920378
61016.2571.8255989649002158
7740.75192.470560519438436
81193182.971764670582386
91028.551.0196040752964108
10786.5154.847236548369362
111483.75182.095899642652438
121113.25122.224861082624275
13912.25186.272873315825425
141684.75430.777107872118988
151385.5295.923976723753620
161043.75180.512926591606396
171628311.367949538805705
181448.7595.377757714609179
191124.75314.2974970735743
201881.75401.014027186082787
211529.5118.390596473425257
221220361.294893404266877
231918.75188.002437927455346
242014.75123.524289109470289
251416.25301.931973574623646
262342.75382.793569259812829
271829.564.645185435576144
281535313.950102192477671
292227.75191.397274449420436
302150155.445596056412372
311392.5368.007699194822748
322217209.920619917784414
332128.75193.134452303743434
341458307.520189039137658
352313.25411.922626229733991
362077.25221.691038760403521
371604.5390.388268266350799
382291.25380.050325614911881
392321.75313.364936349511732
401603641.0387403789781366
412724.25553.1867526733931075
422225.25284.711988975994639
431856.25621.4055975501561414
442799.75619.1232375975991466
452533.75209.039669281535458
462002.75663.2748927355331433


Regression: S.E.(k) = alpha + beta * Mean(k)
alpha58.7636524402465
beta0.130457041309463
S.D.0.0384808876757312
T-STAT3.39017754498782
p-value0.00148424514323930

\begin{tabular}{lllllllll}
\hline
Regression: S.E.(k) = alpha + beta * Mean(k) \tabularnewline
alpha & 58.7636524402465 \tabularnewline
beta & 0.130457041309463 \tabularnewline
S.D. & 0.0384808876757312 \tabularnewline
T-STAT & 3.39017754498782 \tabularnewline
p-value & 0.00148424514323930 \tabularnewline
\hline
\end{tabular}
%Source: https://freestatistics.org/blog/index.php?pk=76434&T=2

[TABLE]
[ROW][C]Regression: S.E.(k) = alpha + beta * Mean(k)[/C][/ROW]
[ROW][C]alpha[/C][C]58.7636524402465[/C][/ROW]
[ROW][C]beta[/C][C]0.130457041309463[/C][/ROW]
[ROW][C]S.D.[/C][C]0.0384808876757312[/C][/ROW]
[ROW][C]T-STAT[/C][C]3.39017754498782[/C][/ROW]
[ROW][C]p-value[/C][C]0.00148424514323930[/C][/ROW]
[/TABLE]
Source: https://freestatistics.org/blog/index.php?pk=76434&T=2

Globally Unique Identifier (entire table): ba.freestatistics.org/blog/index.php?pk=76434&T=2

As an alternative you can also use a QR Code:  

The GUIDs for individual cells are displayed in the table below:

Regression: S.E.(k) = alpha + beta * Mean(k)
alpha58.7636524402465
beta0.130457041309463
S.D.0.0384808876757312
T-STAT3.39017754498782
p-value0.00148424514323930


Regression: ln S.E.(k) = alpha + beta * ln Mean(k)
alpha-0.094764780481324
beta0.752877620469946
S.D.0.231972428531877
T-STAT3.24554786633399
p-value0.0022435109704844
Lambda0.247122379530054

\begin{tabular}{lllllllll}
\hline
Regression: ln S.E.(k) = alpha + beta * ln Mean(k) \tabularnewline
alpha & -0.094764780481324 \tabularnewline
beta & 0.752877620469946 \tabularnewline
S.D. & 0.231972428531877 \tabularnewline
T-STAT & 3.24554786633399 \tabularnewline
p-value & 0.0022435109704844 \tabularnewline
Lambda & 0.247122379530054 \tabularnewline
\hline
\end{tabular}
%Source: https://freestatistics.org/blog/index.php?pk=76434&T=3

[TABLE]
[ROW][C]Regression: ln S.E.(k) = alpha + beta * ln Mean(k)[/C][/ROW]
[ROW][C]alpha[/C][C]-0.094764780481324[/C][/ROW]
[ROW][C]beta[/C][C]0.752877620469946[/C][/ROW]
[ROW][C]S.D.[/C][C]0.231972428531877[/C][/ROW]
[ROW][C]T-STAT[/C][C]3.24554786633399[/C][/ROW]
[ROW][C]p-value[/C][C]0.0022435109704844[/C][/ROW]
[ROW][C]Lambda[/C][C]0.247122379530054[/C][/ROW]
[/TABLE]
Source: https://freestatistics.org/blog/index.php?pk=76434&T=3

Globally Unique Identifier (entire table): ba.freestatistics.org/blog/index.php?pk=76434&T=3

As an alternative you can also use a QR Code:  

The GUIDs for individual cells are displayed in the table below:

Regression: ln S.E.(k) = alpha + beta * ln Mean(k)
alpha-0.094764780481324
beta0.752877620469946
S.D.0.231972428531877
T-STAT3.24554786633399
p-value0.0022435109704844
Lambda0.247122379530054


Parameters (Session):
par1 = 4 ;
Parameters (R input):
par1 = 4 ;
R code (references can be found in the software module):
par1 <- as.numeric(par1)
(n <- length(x))
(np <- floor(n / par1))
arr <- array(NA,dim=c(par1,np))
j <- 0
k <- 1
for (i in 1:(np*par1))
{
j = j + 1
arr[j,k] <- x[i]
if (j == par1) {
j = 0
k=k+1
}
}
arr
arr.mean <- array(NA,dim=np)
arr.sd <- array(NA,dim=np)
arr.range <- array(NA,dim=np)
for (j in 1:np)
{
arr.mean[j] <- mean(arr[,j],na.rm=TRUE)
arr.sd[j] <- sd(arr[,j],na.rm=TRUE)
arr.range[j] <- max(arr[,j],na.rm=TRUE) - min(arr[,j],na.rm=TRUE)
}
arr.mean
arr.sd
arr.range
(lm1 <- lm(arr.sd~arr.mean))
(lnlm1 <- lm(log(arr.sd)~log(arr.mean)))
(lm2 <- lm(arr.range~arr.mean))
bitmap(file='test1.png')
plot(arr.mean,arr.sd,main='Standard Deviation-Mean Plot',xlab='mean',ylab='standard deviation')
dev.off()
bitmap(file='test2.png')
plot(arr.mean,arr.range,main='Range-Mean Plot',xlab='mean',ylab='range')
dev.off()
load(file='createtable')
a<-table.start()
a<-table.row.start(a)
a<-table.element(a,'Standard Deviation-Mean Plot',4,TRUE)
a<-table.row.end(a)
a<-table.row.start(a)
a<-table.element(a,'Section',header=TRUE)
a<-table.element(a,'Mean',header=TRUE)
a<-table.element(a,'Standard Deviation',header=TRUE)
a<-table.element(a,'Range',header=TRUE)
a<-table.row.end(a)
for (j in 1:np) {
a<-table.row.start(a)
a<-table.element(a,j,header=TRUE)
a<-table.element(a,arr.mean[j])
a<-table.element(a,arr.sd[j] )
a<-table.element(a,arr.range[j] )
a<-table.row.end(a)
}
a<-table.end(a)
table.save(a,file='mytable.tab')
a<-table.start()
a<-table.row.start(a)
a<-table.element(a,'Regression: S.E.(k) = alpha + beta * Mean(k)',2,TRUE)
a<-table.row.end(a)
a<-table.row.start(a)
a<-table.element(a,'alpha',header=TRUE)
a<-table.element(a,lm1$coefficients[[1]])
a<-table.row.end(a)
a<-table.row.start(a)
a<-table.element(a,'beta',header=TRUE)
a<-table.element(a,lm1$coefficients[[2]])
a<-table.row.end(a)
a<-table.row.start(a)
a<-table.element(a,'S.D.',header=TRUE)
a<-table.element(a,summary(lm1)$coefficients[2,2])
a<-table.row.end(a)
a<-table.row.start(a)
a<-table.element(a,'T-STAT',header=TRUE)
a<-table.element(a,summary(lm1)$coefficients[2,3])
a<-table.row.end(a)
a<-table.row.start(a)
a<-table.element(a,'p-value',header=TRUE)
a<-table.element(a,summary(lm1)$coefficients[2,4])
a<-table.row.end(a)
a<-table.end(a)
table.save(a,file='mytable1.tab')
a<-table.start()
a<-table.row.start(a)
a<-table.element(a,'Regression: ln S.E.(k) = alpha + beta * ln Mean(k)',2,TRUE)
a<-table.row.end(a)
a<-table.row.start(a)
a<-table.element(a,'alpha',header=TRUE)
a<-table.element(a,lnlm1$coefficients[[1]])
a<-table.row.end(a)
a<-table.row.start(a)
a<-table.element(a,'beta',header=TRUE)
a<-table.element(a,lnlm1$coefficients[[2]])
a<-table.row.end(a)
a<-table.row.start(a)
a<-table.element(a,'S.D.',header=TRUE)
a<-table.element(a,summary(lnlm1)$coefficients[2,2])
a<-table.row.end(a)
a<-table.row.start(a)
a<-table.element(a,'T-STAT',header=TRUE)
a<-table.element(a,summary(lnlm1)$coefficients[2,3])
a<-table.row.end(a)
a<-table.row.start(a)
a<-table.element(a,'p-value',header=TRUE)
a<-table.element(a,summary(lnlm1)$coefficients[2,4])
a<-table.row.end(a)
a<-table.row.start(a)
a<-table.element(a,'Lambda',header=TRUE)
a<-table.element(a,1-lnlm1$coefficients[[2]])
a<-table.row.end(a)
a<-table.end(a)
table.save(a,file='mytable2.tab')