Free Statistics

of Irreproducible Research!

Author's title

Author*Unverified author*
R Software Modulerwasp_smp.wasp
Title produced by softwareStandard Deviation-Mean Plot
Date of computationTue, 25 May 2010 15:10:51 +0000
Cite this page as followsStatistical Computations at FreeStatistics.org, Office for Research Development and Education, URL https://freestatistics.org/blog/index.php?v=date/2010/May/25/t1274800382prc3vgcbxjzt747.htm/, Retrieved Thu, 02 May 2024 10:27:30 +0000
Statistical Computations at FreeStatistics.org, Office for Research Development and Education, URL https://freestatistics.org/blog/index.php?pk=76406, Retrieved Thu, 02 May 2024 10:27:30 +0000
QR Codes:

Original text written by user:
IsPrivate?No (this computation is public)
User-defined keywordsKDGP2W83
Estimated Impact152
Family? (F = Feedback message, R = changed R code, M = changed R Module, P = changed Parameters, D = changed Data)
-       [Standard Deviation-Mean Plot] [IKO - Opgave 8 - ...] [2010-05-25 15:10:51] [2156736b6f7843cba1ea73b621b47743] [Current]
Feedback Forum

Post a new message
Dataseries X:
5221.3
5115.9
5107.4
5202.1
5307.5
5266.1
5329.8
5263.4
5177.1
5204.9
5185.2
5189.8
5253.8
5372.3
5478.4
5590.5
5699.8
5797.9
5854.3
5902.4
5956.9
6007.8
6101.7
6148.6
6207.4
6232
6291.7
6323.4
6365
6435
6493.4
6606.8
6639.1
6723.5
6759.4
6848.6
6918.1
6963.5
7013.1
7030.9
7112.1
7130.3
7130.8
7076.9
7040.8
7086.5
7120.7
7154.1
7228.2
7297.9
7369.5
7450.7
7459.7
7497.5
7536
7637.4
7715.1
7815.7
7859.5
7951.6
7973.7
7988
8053.1
8112
8169.2
8303.1
8372.7
8470.6
8536.1
8665.8
8773.7
8838.4
8936.2
8995.3
9098.9
9237.1
9315.5
9392.6
9502.2
9671.1
9695.6
9847.9
9836.6
9887.7
9875.6
9905.9
9871.1
9910
9977.3
10031.6
10090.7
10095.8
10126
10212.7
10398.7
10467
10543.6
10634.2
10728.7
10796.4
10875.8
10946.1
11050
11086.1
11217.3
11291.7
11314.1
11356.4
11357.8
11491.4
11625.7
11620.7


Summary of computational transaction
Raw Inputview raw input (R code)
Raw Outputview raw output of R engine
Computing time2 seconds
R Server'RServer@AstonUniversity' @ vre.aston.ac.uk

\begin{tabular}{lllllllll}
\hline
Summary of computational transaction \tabularnewline
Raw Input & view raw input (R code)  \tabularnewline
Raw Output & view raw output of R engine  \tabularnewline
Computing time & 2 seconds \tabularnewline
R Server & 'RServer@AstonUniversity' @ vre.aston.ac.uk \tabularnewline
\hline
\end{tabular}
%Source: https://freestatistics.org/blog/index.php?pk=76406&T=0

[TABLE]
[ROW][C]Summary of computational transaction[/C][/ROW]
[ROW][C]Raw Input[/C][C]view raw input (R code) [/C][/ROW]
[ROW][C]Raw Output[/C][C]view raw output of R engine [/C][/ROW]
[ROW][C]Computing time[/C][C]2 seconds[/C][/ROW]
[ROW][C]R Server[/C][C]'RServer@AstonUniversity' @ vre.aston.ac.uk[/C][/ROW]
[/TABLE]
Source: https://freestatistics.org/blog/index.php?pk=76406&T=0

Globally Unique Identifier (entire table): ba.freestatistics.org/blog/index.php?pk=76406&T=0

As an alternative you can also use a QR Code:  

The GUIDs for individual cells are displayed in the table below:

Summary of computational transaction
Raw Inputview raw input (R code)
Raw Outputview raw output of R engine
Computing time2 seconds
R Server'RServer@AstonUniversity' @ vre.aston.ac.uk


Standard Deviation-Mean Plot
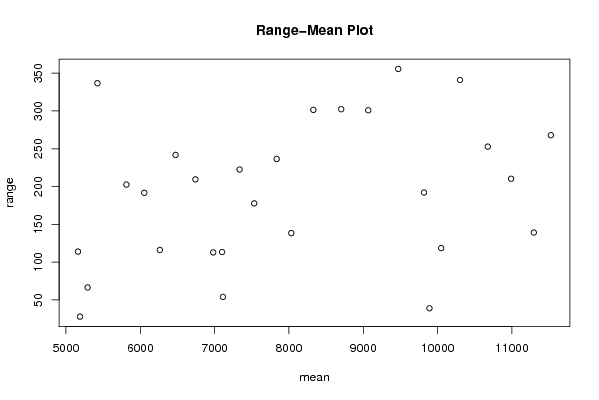
SectionMeanStandard DeviationRange
15161.67558.3964824853921113.900000000001
25291.732.442256395016766.4000000000005
35189.2511.679754563631127.7999999999993
45423.75144.132219391317336.7
55813.687.061013088523202.599999999999
66053.7587.1532175730384191.700000000001
76263.62553.2999296434807116
86475.05102.322675883697241.8
96742.6586.785732314323209.5
106981.450.9327661399481112.799999999999
117112.52525.293263266464453.9000000000005
127100.52548.4461470776229113.3
137336.57595.480307742836222.5
147532.6576.4657003716916177.7
157835.47598.2232279046051236.5
168031.763.7174492061111138.3
178328.9126.71103608868301.400000000001
188703.5132.375853790133302.299999999999
199066.875131.910433628277300.9
209470.35154.206106666803355.6
219816.9583.8160883522171192.1
229890.6520.130325382367538.8999999999996
2310048.8555.8948119238273118.5
2410301.1158.664362728371341
2510675.725110.37836065099252.799999999999
2610989.596.268824998889210.300000000001
2711294.87558.2605855903746139.1
2811523.9126.989422131662267.900000000001

\begin{tabular}{lllllllll}
\hline
Standard Deviation-Mean Plot \tabularnewline
Section & Mean & Standard Deviation & Range \tabularnewline
1 & 5161.675 & 58.3964824853921 & 113.900000000001 \tabularnewline
2 & 5291.7 & 32.4422563950167 & 66.4000000000005 \tabularnewline
3 & 5189.25 & 11.6797545636311 & 27.7999999999993 \tabularnewline
4 & 5423.75 & 144.132219391317 & 336.7 \tabularnewline
5 & 5813.6 & 87.061013088523 & 202.599999999999 \tabularnewline
6 & 6053.75 & 87.1532175730384 & 191.700000000001 \tabularnewline
7 & 6263.625 & 53.2999296434807 & 116 \tabularnewline
8 & 6475.05 & 102.322675883697 & 241.8 \tabularnewline
9 & 6742.65 & 86.785732314323 & 209.5 \tabularnewline
10 & 6981.4 & 50.9327661399481 & 112.799999999999 \tabularnewline
11 & 7112.525 & 25.2932632664644 & 53.9000000000005 \tabularnewline
12 & 7100.525 & 48.4461470776229 & 113.3 \tabularnewline
13 & 7336.575 & 95.480307742836 & 222.5 \tabularnewline
14 & 7532.65 & 76.4657003716916 & 177.7 \tabularnewline
15 & 7835.475 & 98.2232279046051 & 236.5 \tabularnewline
16 & 8031.7 & 63.7174492061111 & 138.3 \tabularnewline
17 & 8328.9 & 126.71103608868 & 301.400000000001 \tabularnewline
18 & 8703.5 & 132.375853790133 & 302.299999999999 \tabularnewline
19 & 9066.875 & 131.910433628277 & 300.9 \tabularnewline
20 & 9470.35 & 154.206106666803 & 355.6 \tabularnewline
21 & 9816.95 & 83.8160883522171 & 192.1 \tabularnewline
22 & 9890.65 & 20.1303253823675 & 38.8999999999996 \tabularnewline
23 & 10048.85 & 55.8948119238273 & 118.5 \tabularnewline
24 & 10301.1 & 158.664362728371 & 341 \tabularnewline
25 & 10675.725 & 110.37836065099 & 252.799999999999 \tabularnewline
26 & 10989.5 & 96.268824998889 & 210.300000000001 \tabularnewline
27 & 11294.875 & 58.2605855903746 & 139.1 \tabularnewline
28 & 11523.9 & 126.989422131662 & 267.900000000001 \tabularnewline
\hline
\end{tabular}
%Source: https://freestatistics.org/blog/index.php?pk=76406&T=1

[TABLE]
[ROW][C]Standard Deviation-Mean Plot[/C][/ROW]
[ROW][C]Section[/C][C]Mean[/C][C]Standard Deviation[/C][C]Range[/C][/ROW]
[ROW][C]1[/C][C]5161.675[/C][C]58.3964824853921[/C][C]113.900000000001[/C][/ROW]
[ROW][C]2[/C][C]5291.7[/C][C]32.4422563950167[/C][C]66.4000000000005[/C][/ROW]
[ROW][C]3[/C][C]5189.25[/C][C]11.6797545636311[/C][C]27.7999999999993[/C][/ROW]
[ROW][C]4[/C][C]5423.75[/C][C]144.132219391317[/C][C]336.7[/C][/ROW]
[ROW][C]5[/C][C]5813.6[/C][C]87.061013088523[/C][C]202.599999999999[/C][/ROW]
[ROW][C]6[/C][C]6053.75[/C][C]87.1532175730384[/C][C]191.700000000001[/C][/ROW]
[ROW][C]7[/C][C]6263.625[/C][C]53.2999296434807[/C][C]116[/C][/ROW]
[ROW][C]8[/C][C]6475.05[/C][C]102.322675883697[/C][C]241.8[/C][/ROW]
[ROW][C]9[/C][C]6742.65[/C][C]86.785732314323[/C][C]209.5[/C][/ROW]
[ROW][C]10[/C][C]6981.4[/C][C]50.9327661399481[/C][C]112.799999999999[/C][/ROW]
[ROW][C]11[/C][C]7112.525[/C][C]25.2932632664644[/C][C]53.9000000000005[/C][/ROW]
[ROW][C]12[/C][C]7100.525[/C][C]48.4461470776229[/C][C]113.3[/C][/ROW]
[ROW][C]13[/C][C]7336.575[/C][C]95.480307742836[/C][C]222.5[/C][/ROW]
[ROW][C]14[/C][C]7532.65[/C][C]76.4657003716916[/C][C]177.7[/C][/ROW]
[ROW][C]15[/C][C]7835.475[/C][C]98.2232279046051[/C][C]236.5[/C][/ROW]
[ROW][C]16[/C][C]8031.7[/C][C]63.7174492061111[/C][C]138.3[/C][/ROW]
[ROW][C]17[/C][C]8328.9[/C][C]126.71103608868[/C][C]301.400000000001[/C][/ROW]
[ROW][C]18[/C][C]8703.5[/C][C]132.375853790133[/C][C]302.299999999999[/C][/ROW]
[ROW][C]19[/C][C]9066.875[/C][C]131.910433628277[/C][C]300.9[/C][/ROW]
[ROW][C]20[/C][C]9470.35[/C][C]154.206106666803[/C][C]355.6[/C][/ROW]
[ROW][C]21[/C][C]9816.95[/C][C]83.8160883522171[/C][C]192.1[/C][/ROW]
[ROW][C]22[/C][C]9890.65[/C][C]20.1303253823675[/C][C]38.8999999999996[/C][/ROW]
[ROW][C]23[/C][C]10048.85[/C][C]55.8948119238273[/C][C]118.5[/C][/ROW]
[ROW][C]24[/C][C]10301.1[/C][C]158.664362728371[/C][C]341[/C][/ROW]
[ROW][C]25[/C][C]10675.725[/C][C]110.37836065099[/C][C]252.799999999999[/C][/ROW]
[ROW][C]26[/C][C]10989.5[/C][C]96.268824998889[/C][C]210.300000000001[/C][/ROW]
[ROW][C]27[/C][C]11294.875[/C][C]58.2605855903746[/C][C]139.1[/C][/ROW]
[ROW][C]28[/C][C]11523.9[/C][C]126.989422131662[/C][C]267.900000000001[/C][/ROW]
[/TABLE]
Source: https://freestatistics.org/blog/index.php?pk=76406&T=1

Globally Unique Identifier (entire table): ba.freestatistics.org/blog/index.php?pk=76406&T=1

As an alternative you can also use a QR Code:  

The GUIDs for individual cells are displayed in the table below:

Standard Deviation-Mean Plot
SectionMeanStandard DeviationRange
15161.67558.3964824853921113.900000000001
25291.732.442256395016766.4000000000005
35189.2511.679754563631127.7999999999993
45423.75144.132219391317336.7
55813.687.061013088523202.599999999999
66053.7587.1532175730384191.700000000001
76263.62553.2999296434807116
86475.05102.322675883697241.8
96742.6586.785732314323209.5
106981.450.9327661399481112.799999999999
117112.52525.293263266464453.9000000000005
127100.52548.4461470776229113.3
137336.57595.480307742836222.5
147532.6576.4657003716916177.7
157835.47598.2232279046051236.5
168031.763.7174492061111138.3
178328.9126.71103608868301.400000000001
188703.5132.375853790133302.299999999999
199066.875131.910433628277300.9
209470.35154.206106666803355.6
219816.9583.8160883522171192.1
229890.6520.130325382367538.8999999999996
2310048.8555.8948119238273118.5
2410301.1158.664362728371341
2510675.725110.37836065099252.799999999999
2610989.596.268824998889210.300000000001
2711294.87558.2605855903746139.1
2811523.9126.989422131662267.900000000001


Regression: S.E.(k) = alpha + beta * Mean(k)
alpha29.4711342663777
beta0.00691556100658316
S.D.0.00377032941549272
T-STAT1.83420604527719
p-value0.0780933742714603

\begin{tabular}{lllllllll}
\hline
Regression: S.E.(k) = alpha + beta * Mean(k) \tabularnewline
alpha & 29.4711342663777 \tabularnewline
beta & 0.00691556100658316 \tabularnewline
S.D. & 0.00377032941549272 \tabularnewline
T-STAT & 1.83420604527719 \tabularnewline
p-value & 0.0780933742714603 \tabularnewline
\hline
\end{tabular}
%Source: https://freestatistics.org/blog/index.php?pk=76406&T=2

[TABLE]
[ROW][C]Regression: S.E.(k) = alpha + beta * Mean(k)[/C][/ROW]
[ROW][C]alpha[/C][C]29.4711342663777[/C][/ROW]
[ROW][C]beta[/C][C]0.00691556100658316[/C][/ROW]
[ROW][C]S.D.[/C][C]0.00377032941549272[/C][/ROW]
[ROW][C]T-STAT[/C][C]1.83420604527719[/C][/ROW]
[ROW][C]p-value[/C][C]0.0780933742714603[/C][/ROW]
[/TABLE]
Source: https://freestatistics.org/blog/index.php?pk=76406&T=2

Globally Unique Identifier (entire table): ba.freestatistics.org/blog/index.php?pk=76406&T=2

As an alternative you can also use a QR Code:  

The GUIDs for individual cells are displayed in the table below:

Regression: S.E.(k) = alpha + beta * Mean(k)
alpha29.4711342663777
beta0.00691556100658316
S.D.0.00377032941549272
T-STAT1.83420604527719
p-value0.0780933742714603


Regression: ln S.E.(k) = alpha + beta * ln Mean(k)
alpha-3.49488699242776
beta0.868534238323616
S.D.0.461540563833099
T-STAT1.88181561141762
p-value0.0711014058992394
Lambda0.131465761676384

\begin{tabular}{lllllllll}
\hline
Regression: ln S.E.(k) = alpha + beta * ln Mean(k) \tabularnewline
alpha & -3.49488699242776 \tabularnewline
beta & 0.868534238323616 \tabularnewline
S.D. & 0.461540563833099 \tabularnewline
T-STAT & 1.88181561141762 \tabularnewline
p-value & 0.0711014058992394 \tabularnewline
Lambda & 0.131465761676384 \tabularnewline
\hline
\end{tabular}
%Source: https://freestatistics.org/blog/index.php?pk=76406&T=3

[TABLE]
[ROW][C]Regression: ln S.E.(k) = alpha + beta * ln Mean(k)[/C][/ROW]
[ROW][C]alpha[/C][C]-3.49488699242776[/C][/ROW]
[ROW][C]beta[/C][C]0.868534238323616[/C][/ROW]
[ROW][C]S.D.[/C][C]0.461540563833099[/C][/ROW]
[ROW][C]T-STAT[/C][C]1.88181561141762[/C][/ROW]
[ROW][C]p-value[/C][C]0.0711014058992394[/C][/ROW]
[ROW][C]Lambda[/C][C]0.131465761676384[/C][/ROW]
[/TABLE]
Source: https://freestatistics.org/blog/index.php?pk=76406&T=3

Globally Unique Identifier (entire table): ba.freestatistics.org/blog/index.php?pk=76406&T=3

As an alternative you can also use a QR Code:  

The GUIDs for individual cells are displayed in the table below:

Regression: ln S.E.(k) = alpha + beta * ln Mean(k)
alpha-3.49488699242776
beta0.868534238323616
S.D.0.461540563833099
T-STAT1.88181561141762
p-value0.0711014058992394
Lambda0.131465761676384


Parameters (Session):
par1 = 4 ;
Parameters (R input):
par1 = 4 ;
R code (references can be found in the software module):
par1 <- as.numeric(par1)
(n <- length(x))
(np <- floor(n / par1))
arr <- array(NA,dim=c(par1,np))
j <- 0
k <- 1
for (i in 1:(np*par1))
{
j = j + 1
arr[j,k] <- x[i]
if (j == par1) {
j = 0
k=k+1
}
}
arr
arr.mean <- array(NA,dim=np)
arr.sd <- array(NA,dim=np)
arr.range <- array(NA,dim=np)
for (j in 1:np)
{
arr.mean[j] <- mean(arr[,j],na.rm=TRUE)
arr.sd[j] <- sd(arr[,j],na.rm=TRUE)
arr.range[j] <- max(arr[,j],na.rm=TRUE) - min(arr[,j],na.rm=TRUE)
}
arr.mean
arr.sd
arr.range
(lm1 <- lm(arr.sd~arr.mean))
(lnlm1 <- lm(log(arr.sd)~log(arr.mean)))
(lm2 <- lm(arr.range~arr.mean))
bitmap(file='test1.png')
plot(arr.mean,arr.sd,main='Standard Deviation-Mean Plot',xlab='mean',ylab='standard deviation')
dev.off()
bitmap(file='test2.png')
plot(arr.mean,arr.range,main='Range-Mean Plot',xlab='mean',ylab='range')
dev.off()
load(file='createtable')
a<-table.start()
a<-table.row.start(a)
a<-table.element(a,'Standard Deviation-Mean Plot',4,TRUE)
a<-table.row.end(a)
a<-table.row.start(a)
a<-table.element(a,'Section',header=TRUE)
a<-table.element(a,'Mean',header=TRUE)
a<-table.element(a,'Standard Deviation',header=TRUE)
a<-table.element(a,'Range',header=TRUE)
a<-table.row.end(a)
for (j in 1:np) {
a<-table.row.start(a)
a<-table.element(a,j,header=TRUE)
a<-table.element(a,arr.mean[j])
a<-table.element(a,arr.sd[j] )
a<-table.element(a,arr.range[j] )
a<-table.row.end(a)
}
a<-table.end(a)
table.save(a,file='mytable.tab')
a<-table.start()
a<-table.row.start(a)
a<-table.element(a,'Regression: S.E.(k) = alpha + beta * Mean(k)',2,TRUE)
a<-table.row.end(a)
a<-table.row.start(a)
a<-table.element(a,'alpha',header=TRUE)
a<-table.element(a,lm1$coefficients[[1]])
a<-table.row.end(a)
a<-table.row.start(a)
a<-table.element(a,'beta',header=TRUE)
a<-table.element(a,lm1$coefficients[[2]])
a<-table.row.end(a)
a<-table.row.start(a)
a<-table.element(a,'S.D.',header=TRUE)
a<-table.element(a,summary(lm1)$coefficients[2,2])
a<-table.row.end(a)
a<-table.row.start(a)
a<-table.element(a,'T-STAT',header=TRUE)
a<-table.element(a,summary(lm1)$coefficients[2,3])
a<-table.row.end(a)
a<-table.row.start(a)
a<-table.element(a,'p-value',header=TRUE)
a<-table.element(a,summary(lm1)$coefficients[2,4])
a<-table.row.end(a)
a<-table.end(a)
table.save(a,file='mytable1.tab')
a<-table.start()
a<-table.row.start(a)
a<-table.element(a,'Regression: ln S.E.(k) = alpha + beta * ln Mean(k)',2,TRUE)
a<-table.row.end(a)
a<-table.row.start(a)
a<-table.element(a,'alpha',header=TRUE)
a<-table.element(a,lnlm1$coefficients[[1]])
a<-table.row.end(a)
a<-table.row.start(a)
a<-table.element(a,'beta',header=TRUE)
a<-table.element(a,lnlm1$coefficients[[2]])
a<-table.row.end(a)
a<-table.row.start(a)
a<-table.element(a,'S.D.',header=TRUE)
a<-table.element(a,summary(lnlm1)$coefficients[2,2])
a<-table.row.end(a)
a<-table.row.start(a)
a<-table.element(a,'T-STAT',header=TRUE)
a<-table.element(a,summary(lnlm1)$coefficients[2,3])
a<-table.row.end(a)
a<-table.row.start(a)
a<-table.element(a,'p-value',header=TRUE)
a<-table.element(a,summary(lnlm1)$coefficients[2,4])
a<-table.row.end(a)
a<-table.row.start(a)
a<-table.element(a,'Lambda',header=TRUE)
a<-table.element(a,1-lnlm1$coefficients[[2]])
a<-table.row.end(a)
a<-table.end(a)
table.save(a,file='mytable2.tab')