Free Statistics
of Irreproducible Research!
Description of Statistical Computation | |
|---|---|
| Author's title | |
| Author | *The author of this computation has been verified* |
| R Software Module | Rscript (source code is shown below) |
| Title produced by software | R console |
| Date of computation | Tue, 25 May 2010 12:54:31 +0000 |
| Cite this page as follows | Statistical Computations at FreeStatistics.org, Office for Research Development and Education, URL https://freestatistics.org/blog/index.php?v=date/2010/May/25/t1274792072iv1ziqxftwtzpso.htm/, Retrieved Tue, 08 Jul 2025 08:58:49 +0000 |
| Statistical Computations at FreeStatistics.org, Office for Research Development and Education, URL https://freestatistics.org/blog/index.php?pk=76382, Retrieved Tue, 08 Jul 2025 08:58:49 +0000 | |
| QR Codes: | |
|
| |
| Original text written by user: | Warning: you must have the RWeka R package installed to reproduce this computation. The RWeka package requires Sun Java on your machine! |
| IsPrivate? | No (this computation is public) |
| User-defined keywords | ICEL 2010, peer review, regression tree, evaluation, social constructivism, reproducible computing, educational technology, e-learning |
| Estimated Impact | 253 |
Tree of Dependent Computations | |
| Family? (F = Feedback message, R = changed R code, M = changed R Module, P = changed Parameters, D = changed Data) | |
| - [R console] [Reviewing Peer Re...] [2010-05-25 12:54:31] [d76b387543b13b5e3afd8ff9e5fdc89f] [Current] | |
| Feedback Forum | |
Post a new message | |
Dataset | |
Tables (Output of Computation) | |
> {
+ library(RWeka)
+ con <- url('https://automated.biganalytics.eu/download/ICEL2010')
+ load(con)
+ close(con)
+ y <- y[!is.na(y$X1), ]
+ .... [TRUNCATED]
Min. 1st Qu. Median Mean 3rd Qu. Max.
0.000 3.000 3.000 3.306 4.000 5.000
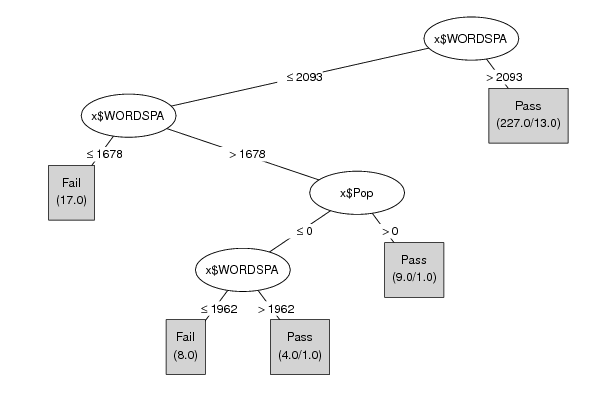
J48 pruned tree
------------------
x$WORDSPA <= 2093
| x$WORDSPA <= 1678: Fail (17.0)
| x$WORDSPA > 1678
| | x$Pop <= 0
| | | x$WORDSPA <= 1962: Fail (8.0)
| | | x$WORDSPA > 1962: Pass (4.0/1.0)
| | x$Pop > 0: Pass (9.0/1.0)
x$WORDSPA > 2093: Pass (227.0/13.0)
Number of Leaves : 5
Size of the tree : 9
=== Summary ===
Correctly Classified Instances 250 94.3396 %
Incorrectly Classified Instances 15 5.6604 %
Kappa statistic 0.7389
Mean absolute error 0.1049
Root mean squared error 0.229
Relative absolute error 40.622 %
Root relative squared error 63.9602 %
Coverage of cases (0.95 level) 100 %
Mean rel. region size (0.95 level) 95.283 %
Total Number of Instances 265
=== Confusion Matrix ===
a b <-- classified as
25 15 | a = Fail
0 225 | b = Pass
=== 10 Fold Cross Validation ===
=== Summary ===
Correctly Classified Instances 241 90.9434 %
Incorrectly Classified Instances 24 9.0566 %
Kappa statistic 0.6234
Mean absolute error 0.115
Root mean squared error 0.2975
Relative absolute error 44.5037 %
Root relative squared error 83.0932 %
Coverage of cases (0.95 level) 92.8302 %
Mean rel. region size (0.95 level) 60 %
Total Number of Instances 265
=== Confusion Matrix ===
a b <-- classified as
25 15 | a = Fail
9 216 | b = Pass
| |
Figures (Output of Computation) | |
Input Parameters & R Code | |
| Parameters (Session): | |
| Parameters (R input): | |
| R code (body of R function): | |
{ | |