Free Statistics
of Irreproducible Research!
Description of Statistical Computation | |
|---|---|
| Author's title | |
| Author | *The author of this computation has been verified* |
| R Software Module | Rscript (source code is shown below) |
| Title produced by software | R console |
| Date of computation | Tue, 25 May 2010 11:52:42 +0000 |
| Cite this page as follows | Statistical Computations at FreeStatistics.org, Office for Research Development and Education, URL https://freestatistics.org/blog/index.php?v=date/2010/May/25/t1274788363lm9zk0g8p12sbaf.htm/, Retrieved Thu, 02 May 2024 08:11:35 +0000 |
| Statistical Computations at FreeStatistics.org, Office for Research Development and Education, URL https://freestatistics.org/blog/index.php?pk=76374, Retrieved Thu, 02 May 2024 08:11:35 +0000 | |
| QR Codes: | |
|
| |
| Original text written by user: | This example is used in the manual files of the RC package. |
| IsPrivate? | No (this computation is public) |
| User-defined keywords | blogtest |
| Estimated Impact | 186 |
Tree of Dependent Computations | |
| Family? (F = Feedback message, R = changed R code, M = changed R Module, P = changed Parameters, D = changed Data) | |
| - [Spectral Analysis] [] [2009-06-19 08:45:25] [b98453cac15ba1066b407e146608df68] - RMPD [R console] [correlation test] [2010-05-25 11:52:42] [256f657a32c6b2b7628dddcfa9a822d0] [Current] | |
| Feedback Forum | |
Post a new message | |
Dataset | |
| Dataseries X: | |
-0.230509046411039 -0.042866718671201 -2.31082192395293 -0.244321407199057 0.732222068842626 -0.655790223556241 2.28283905159608 -0.0640751571452261 2.00782366348172 -1.00751592414554 -0.827672118211085 -0.64707177177761 -1.23887374337283 0.618963935335151 -0.17646936505208 0.324947517468041 0.529560419963756 -0.379845852911057 0.202876458589189 0.450630400351252 -0.0238474906424284 -1.20843383866043 0.53762180401894 0.703154875161168 0.685514609812999 1.77966005701853 -1.34788033021717 -1.6089375775467 -1.27051907578625 0.105551139465803 -3.26194177337972 0.501855410315103 0.803020570880456 -1.43987200455727 1.15231976772956 -1.29821124221559 1.54619332882454 1.81135423552844 -0.497579412429635 -0.151331166160845 -0.758655526719785 -0.248978579819104 -0.28739112691276 -0.762063405191085 0.17291046206872 0.190632924573649 0.84748480536548 1.50435584668708 0.400403585909129 -0.675117793036688 0.144582438785829 -1.0004492201287 0.385810202543451 0.833184267966298 -0.237516878222215 0.910694980863615 1.0454672663579 0.579808723736741 -2.61845825153286 0.280117090323191 -0.626530018793994 1.50868551271527 -0.376420445153667 1.16887450194249 -0.00554110327935942 -0.90736353113176 -0.639426293800777 2.24343919330551 1.69046635027935 0.995050635761575 0.827873825739188 -0.807797247053079 0.598922526505226 -0.932425092951387 0.280986024636217 0.239252447265784 -0.341258314366607 -1.1757833858997 -0.324561872966694 -1.54657339307488 -1.16841288905301 0.730980164361232 -0.353030357884463 -0.454794382828957 0.963196039652825 -0.247456487726979 0.981092231721395 -0.58405933613702 -0.749809670006779 0.57784932242267 -0.204263803333214 -0.635363688066645 0.221001383579793 0.830704745209947 0.492565942706567 -1.25423906100019 -0.0608312234319707 0.296144336400089 0.133946351929447 0.074922028784343 | |
Tables (Output of Computation) | |
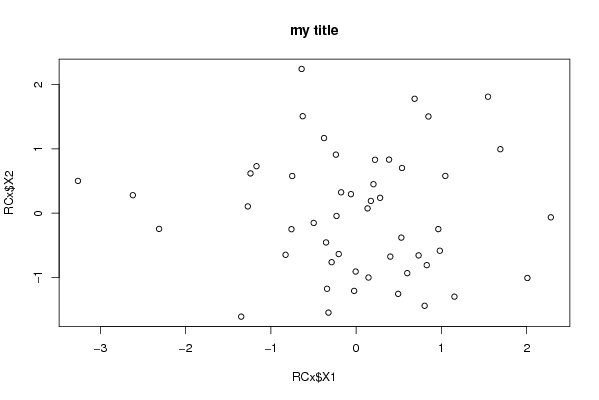
> title = 'my title'


> {
+     plot(RCx$X1, RCx$X2, main = title)
+     res <- cor.test(RCx$X1, RCx$X2)
+     print(res)
+ }

	Pearson's product-moment correlation

data:  RCx$X1 and RCx$X2
t = -0.36, df = 48, p-value = 0.7204
alternative hypothesis: true correlation is not equal to 0
95 percent confidence interval:
 -0.3255348  0.2297776
sample estimates:
       cor
-0.0518888
| |
Figures (Output of Computation) | |
Input Parameters & R Code | |
| Parameters (Session): | |
| par1 = 'mytitle' ; | |
| Parameters (R input): | |
| R code (body of R function): | |
{ | |