Free Statistics

of Irreproducible Research!

Author's title

Author*Unverified author*
R Software Modulerwasp_autocorrelation.wasp
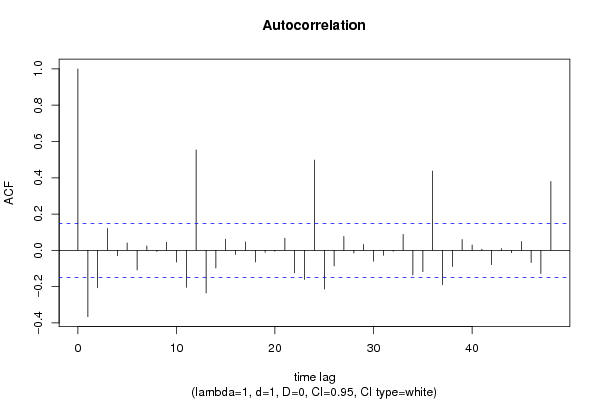
Title produced by software(Partial) Autocorrelation Function
Date of computationWed, 05 May 2010 21:08:13 +0000
Cite this page as followsStatistical Computations at FreeStatistics.org, Office for Research Development and Education, URL https://freestatistics.org/blog/index.php?v=date/2010/May/05/t1273093772ra0ava9aknj8oih.htm/, Retrieved Wed, 01 May 2024 13:47:23 +0000
Statistical Computations at FreeStatistics.org, Office for Research Development and Education, URL https://freestatistics.org/blog/index.php?pk=75580, Retrieved Wed, 01 May 2024 13:47:23 +0000
QR Codes:

Original text written by user:
IsPrivate?No (this computation is public)
User-defined keywordsKDGP2W21
Estimated Impact127
Family? (F = Feedback message, R = changed R code, M = changed R Module, P = changed Parameters, D = changed Data)
-       [(Partial) Autocorrelation Function] [Jeroen Cornelisse...] [2010-05-05 21:08:13] [f3cdcbccc174fec74ce5399cef7e1772] [Current]
Feedback Forum

Post a new message
Dataseries X:
112
118
129
99
116
168
118
129
205
147
150
267
126
129
124
97
102
127
222
214
118
141
154
226
89
77
82
97
127
121
117
117
106
112
134
169
75
108
115
85
101
108
109
124
105
95
135
164
88
85
112
87
91
87
87
142
95
108
139
159
61
82
124
93
108
75
87
103
90
108
123
129
57
65
67
71
76
67
110
118
99
85
107
141
58
65
70
86
93
74
87
73
101
100
96
157
63
115
70
66
67
83
79
77
102
116
100
135
71
60
89
74
73
91
86
74
87
87
109
137
43
69
73
77
69
76
78
70
83
65
110
132
54
55
66
65
60
65
96
55
71
63
74
106
34
47
56
53
53
55
67
52
46
51
58
91
33
40
46
45
41
55
57
54
46
52
48
77
30
35
42
48
44
45


Summary of computational transaction
Raw Inputview raw input (R code)
Raw Outputview raw output of R engine
Computing time2 seconds
R Server'RServer@AstonUniversity' @ vre.aston.ac.uk

\begin{tabular}{lllllllll}
\hline
Summary of computational transaction \tabularnewline
Raw Input & view raw input (R code)  \tabularnewline
Raw Output & view raw output of R engine  \tabularnewline
Computing time & 2 seconds \tabularnewline
R Server & 'RServer@AstonUniversity' @ vre.aston.ac.uk \tabularnewline
\hline
\end{tabular}
%Source: https://freestatistics.org/blog/index.php?pk=75580&T=0

[TABLE]
[ROW][C]Summary of computational transaction[/C][/ROW]
[ROW][C]Raw Input[/C][C]view raw input (R code) [/C][/ROW]
[ROW][C]Raw Output[/C][C]view raw output of R engine [/C][/ROW]
[ROW][C]Computing time[/C][C]2 seconds[/C][/ROW]
[ROW][C]R Server[/C][C]'RServer@AstonUniversity' @ vre.aston.ac.uk[/C][/ROW]
[/TABLE]
Source: https://freestatistics.org/blog/index.php?pk=75580&T=0

Globally Unique Identifier (entire table): ba.freestatistics.org/blog/index.php?pk=75580&T=0

As an alternative you can also use a QR Code:  

The GUIDs for individual cells are displayed in the table below:

Summary of computational transaction
Raw Inputview raw input (R code)
Raw Outputview raw output of R engine
Computing time2 seconds
R Server'RServer@AstonUniversity' @ vre.aston.ac.uk


Autocorrelation Function
Time lag kACF(k)T-STATP-value
1-0.365346-4.80542e-06
2-0.205887-2.7080.003724
30.1209991.59150.056662
4-0.030313-0.39870.345301
50.0409370.53840.295481
6-0.107643-1.41580.079312
70.0239130.31450.37675
8-0.005673-0.07460.470301
90.0441260.58040.281204
10-0.06456-0.84920.198485
11-0.203268-2.67360.004112
120.5537627.28360
13-0.234412-3.08320.001192
14-0.097202-1.27850.101394
150.0616940.81150.209108
16-0.023024-0.30280.381191
170.0457980.60240.273857
18-0.063599-0.83650.202011
19-0.010406-0.13690.445645
20-0.004702-0.06180.475379
210.0670560.8820.189503
22-0.12328-1.62150.053366
23-0.160168-2.10670.018294
240.4976796.54590
25-0.213418-2.80710.002787
26-0.085561-1.12540.130995
270.0769051.01150.156588
28-0.014785-0.19450.423019
290.0327990.43140.333357
30-0.059436-0.78180.217711
31-0.027232-0.35820.360322
32-0.00487-0.06410.474499
330.0881141.1590.124036
34-0.135784-1.7860.037928
35-0.117482-1.54520.062059
360.4369965.74780
37-0.18927-2.48950.006869
38-0.089495-1.17710.120381
390.0594630.78210.217607
400.0302020.39720.345839
410.0067880.08930.464479
42-0.078742-1.03570.150897
430.0098270.12930.448654
44-0.012438-0.16360.43512
450.0486670.64010.261472
46-0.066594-0.87590.191146
47-0.127599-1.67830.047547
480.3798854.99661e-06

\begin{tabular}{lllllllll}
\hline
Autocorrelation Function \tabularnewline
Time lag k & ACF(k) & T-STAT & P-value \tabularnewline
1 & -0.365346 & -4.8054 & 2e-06 \tabularnewline
2 & -0.205887 & -2.708 & 0.003724 \tabularnewline
3 & 0.120999 & 1.5915 & 0.056662 \tabularnewline
4 & -0.030313 & -0.3987 & 0.345301 \tabularnewline
5 & 0.040937 & 0.5384 & 0.295481 \tabularnewline
6 & -0.107643 & -1.4158 & 0.079312 \tabularnewline
7 & 0.023913 & 0.3145 & 0.37675 \tabularnewline
8 & -0.005673 & -0.0746 & 0.470301 \tabularnewline
9 & 0.044126 & 0.5804 & 0.281204 \tabularnewline
10 & -0.06456 & -0.8492 & 0.198485 \tabularnewline
11 & -0.203268 & -2.6736 & 0.004112 \tabularnewline
12 & 0.553762 & 7.2836 & 0 \tabularnewline
13 & -0.234412 & -3.0832 & 0.001192 \tabularnewline
14 & -0.097202 & -1.2785 & 0.101394 \tabularnewline
15 & 0.061694 & 0.8115 & 0.209108 \tabularnewline
16 & -0.023024 & -0.3028 & 0.381191 \tabularnewline
17 & 0.045798 & 0.6024 & 0.273857 \tabularnewline
18 & -0.063599 & -0.8365 & 0.202011 \tabularnewline
19 & -0.010406 & -0.1369 & 0.445645 \tabularnewline
20 & -0.004702 & -0.0618 & 0.475379 \tabularnewline
21 & 0.067056 & 0.882 & 0.189503 \tabularnewline
22 & -0.12328 & -1.6215 & 0.053366 \tabularnewline
23 & -0.160168 & -2.1067 & 0.018294 \tabularnewline
24 & 0.497679 & 6.5459 & 0 \tabularnewline
25 & -0.213418 & -2.8071 & 0.002787 \tabularnewline
26 & -0.085561 & -1.1254 & 0.130995 \tabularnewline
27 & 0.076905 & 1.0115 & 0.156588 \tabularnewline
28 & -0.014785 & -0.1945 & 0.423019 \tabularnewline
29 & 0.032799 & 0.4314 & 0.333357 \tabularnewline
30 & -0.059436 & -0.7818 & 0.217711 \tabularnewline
31 & -0.027232 & -0.3582 & 0.360322 \tabularnewline
32 & -0.00487 & -0.0641 & 0.474499 \tabularnewline
33 & 0.088114 & 1.159 & 0.124036 \tabularnewline
34 & -0.135784 & -1.786 & 0.037928 \tabularnewline
35 & -0.117482 & -1.5452 & 0.062059 \tabularnewline
36 & 0.436996 & 5.7478 & 0 \tabularnewline
37 & -0.18927 & -2.4895 & 0.006869 \tabularnewline
38 & -0.089495 & -1.1771 & 0.120381 \tabularnewline
39 & 0.059463 & 0.7821 & 0.217607 \tabularnewline
40 & 0.030202 & 0.3972 & 0.345839 \tabularnewline
41 & 0.006788 & 0.0893 & 0.464479 \tabularnewline
42 & -0.078742 & -1.0357 & 0.150897 \tabularnewline
43 & 0.009827 & 0.1293 & 0.448654 \tabularnewline
44 & -0.012438 & -0.1636 & 0.43512 \tabularnewline
45 & 0.048667 & 0.6401 & 0.261472 \tabularnewline
46 & -0.066594 & -0.8759 & 0.191146 \tabularnewline
47 & -0.127599 & -1.6783 & 0.047547 \tabularnewline
48 & 0.379885 & 4.9966 & 1e-06 \tabularnewline
\hline
\end{tabular}
%Source: https://freestatistics.org/blog/index.php?pk=75580&T=1

[TABLE]
[ROW][C]Autocorrelation Function[/C][/ROW]
[ROW][C]Time lag k[/C][C]ACF(k)[/C][C]T-STAT[/C][C]P-value[/C][/ROW]
[ROW][C]1[/C][C]-0.365346[/C][C]-4.8054[/C][C]2e-06[/C][/ROW]
[ROW][C]2[/C][C]-0.205887[/C][C]-2.708[/C][C]0.003724[/C][/ROW]
[ROW][C]3[/C][C]0.120999[/C][C]1.5915[/C][C]0.056662[/C][/ROW]
[ROW][C]4[/C][C]-0.030313[/C][C]-0.3987[/C][C]0.345301[/C][/ROW]
[ROW][C]5[/C][C]0.040937[/C][C]0.5384[/C][C]0.295481[/C][/ROW]
[ROW][C]6[/C][C]-0.107643[/C][C]-1.4158[/C][C]0.079312[/C][/ROW]
[ROW][C]7[/C][C]0.023913[/C][C]0.3145[/C][C]0.37675[/C][/ROW]
[ROW][C]8[/C][C]-0.005673[/C][C]-0.0746[/C][C]0.470301[/C][/ROW]
[ROW][C]9[/C][C]0.044126[/C][C]0.5804[/C][C]0.281204[/C][/ROW]
[ROW][C]10[/C][C]-0.06456[/C][C]-0.8492[/C][C]0.198485[/C][/ROW]
[ROW][C]11[/C][C]-0.203268[/C][C]-2.6736[/C][C]0.004112[/C][/ROW]
[ROW][C]12[/C][C]0.553762[/C][C]7.2836[/C][C]0[/C][/ROW]
[ROW][C]13[/C][C]-0.234412[/C][C]-3.0832[/C][C]0.001192[/C][/ROW]
[ROW][C]14[/C][C]-0.097202[/C][C]-1.2785[/C][C]0.101394[/C][/ROW]
[ROW][C]15[/C][C]0.061694[/C][C]0.8115[/C][C]0.209108[/C][/ROW]
[ROW][C]16[/C][C]-0.023024[/C][C]-0.3028[/C][C]0.381191[/C][/ROW]
[ROW][C]17[/C][C]0.045798[/C][C]0.6024[/C][C]0.273857[/C][/ROW]
[ROW][C]18[/C][C]-0.063599[/C][C]-0.8365[/C][C]0.202011[/C][/ROW]
[ROW][C]19[/C][C]-0.010406[/C][C]-0.1369[/C][C]0.445645[/C][/ROW]
[ROW][C]20[/C][C]-0.004702[/C][C]-0.0618[/C][C]0.475379[/C][/ROW]
[ROW][C]21[/C][C]0.067056[/C][C]0.882[/C][C]0.189503[/C][/ROW]
[ROW][C]22[/C][C]-0.12328[/C][C]-1.6215[/C][C]0.053366[/C][/ROW]
[ROW][C]23[/C][C]-0.160168[/C][C]-2.1067[/C][C]0.018294[/C][/ROW]
[ROW][C]24[/C][C]0.497679[/C][C]6.5459[/C][C]0[/C][/ROW]
[ROW][C]25[/C][C]-0.213418[/C][C]-2.8071[/C][C]0.002787[/C][/ROW]
[ROW][C]26[/C][C]-0.085561[/C][C]-1.1254[/C][C]0.130995[/C][/ROW]
[ROW][C]27[/C][C]0.076905[/C][C]1.0115[/C][C]0.156588[/C][/ROW]
[ROW][C]28[/C][C]-0.014785[/C][C]-0.1945[/C][C]0.423019[/C][/ROW]
[ROW][C]29[/C][C]0.032799[/C][C]0.4314[/C][C]0.333357[/C][/ROW]
[ROW][C]30[/C][C]-0.059436[/C][C]-0.7818[/C][C]0.217711[/C][/ROW]
[ROW][C]31[/C][C]-0.027232[/C][C]-0.3582[/C][C]0.360322[/C][/ROW]
[ROW][C]32[/C][C]-0.00487[/C][C]-0.0641[/C][C]0.474499[/C][/ROW]
[ROW][C]33[/C][C]0.088114[/C][C]1.159[/C][C]0.124036[/C][/ROW]
[ROW][C]34[/C][C]-0.135784[/C][C]-1.786[/C][C]0.037928[/C][/ROW]
[ROW][C]35[/C][C]-0.117482[/C][C]-1.5452[/C][C]0.062059[/C][/ROW]
[ROW][C]36[/C][C]0.436996[/C][C]5.7478[/C][C]0[/C][/ROW]
[ROW][C]37[/C][C]-0.18927[/C][C]-2.4895[/C][C]0.006869[/C][/ROW]
[ROW][C]38[/C][C]-0.089495[/C][C]-1.1771[/C][C]0.120381[/C][/ROW]
[ROW][C]39[/C][C]0.059463[/C][C]0.7821[/C][C]0.217607[/C][/ROW]
[ROW][C]40[/C][C]0.030202[/C][C]0.3972[/C][C]0.345839[/C][/ROW]
[ROW][C]41[/C][C]0.006788[/C][C]0.0893[/C][C]0.464479[/C][/ROW]
[ROW][C]42[/C][C]-0.078742[/C][C]-1.0357[/C][C]0.150897[/C][/ROW]
[ROW][C]43[/C][C]0.009827[/C][C]0.1293[/C][C]0.448654[/C][/ROW]
[ROW][C]44[/C][C]-0.012438[/C][C]-0.1636[/C][C]0.43512[/C][/ROW]
[ROW][C]45[/C][C]0.048667[/C][C]0.6401[/C][C]0.261472[/C][/ROW]
[ROW][C]46[/C][C]-0.066594[/C][C]-0.8759[/C][C]0.191146[/C][/ROW]
[ROW][C]47[/C][C]-0.127599[/C][C]-1.6783[/C][C]0.047547[/C][/ROW]
[ROW][C]48[/C][C]0.379885[/C][C]4.9966[/C][C]1e-06[/C][/ROW]
[/TABLE]
Source: https://freestatistics.org/blog/index.php?pk=75580&T=1

Globally Unique Identifier (entire table): ba.freestatistics.org/blog/index.php?pk=75580&T=1

As an alternative you can also use a QR Code:  

The GUIDs for individual cells are displayed in the table below:

Autocorrelation Function
Time lag kACF(k)T-STATP-value
1-0.365346-4.80542e-06
2-0.205887-2.7080.003724
30.1209991.59150.056662
4-0.030313-0.39870.345301
50.0409370.53840.295481
6-0.107643-1.41580.079312
70.0239130.31450.37675
8-0.005673-0.07460.470301
90.0441260.58040.281204
10-0.06456-0.84920.198485
11-0.203268-2.67360.004112
120.5537627.28360
13-0.234412-3.08320.001192
14-0.097202-1.27850.101394
150.0616940.81150.209108
16-0.023024-0.30280.381191
170.0457980.60240.273857
18-0.063599-0.83650.202011
19-0.010406-0.13690.445645
20-0.004702-0.06180.475379
210.0670560.8820.189503
22-0.12328-1.62150.053366
23-0.160168-2.10670.018294
240.4976796.54590
25-0.213418-2.80710.002787
26-0.085561-1.12540.130995
270.0769051.01150.156588
28-0.014785-0.19450.423019
290.0327990.43140.333357
30-0.059436-0.78180.217711
31-0.027232-0.35820.360322
32-0.00487-0.06410.474499
330.0881141.1590.124036
34-0.135784-1.7860.037928
35-0.117482-1.54520.062059
360.4369965.74780
37-0.18927-2.48950.006869
38-0.089495-1.17710.120381
390.0594630.78210.217607
400.0302020.39720.345839
410.0067880.08930.464479
42-0.078742-1.03570.150897
430.0098270.12930.448654
44-0.012438-0.16360.43512
450.0486670.64010.261472
46-0.066594-0.87590.191146
47-0.127599-1.67830.047547
480.3798854.99661e-06


Partial Autocorrelation Function
Time lag kPACF(k)T-STATP-value
1-0.365346-4.80542e-06
2-0.39164-5.15120
3-0.172794-2.27280.012136
4-0.172059-2.26310.012437
5-0.040936-0.53840.295486
6-0.173649-2.2840.011793
7-0.12917-1.6990.045561
8-0.18926-2.48930.006872
9-0.090986-1.19670.116524
10-0.190158-2.50110.006655
11-0.511591-6.72890
120.1885892.48050.007038
13-0.024794-0.32610.372367
140.1278931.68220.04717
15-0.007554-0.09940.460484
160.0423040.55640.289318
170.007630.10040.460091
180.088891.16920.121973
190.0365040.48010.315869
200.0337470.44390.328846
210.1160111.52590.064432
22-0.117675-1.54780.061752
23-0.264835-3.48340.000314
24-0.015877-0.20880.417415
25-0.080009-1.05230.147053
26-0.043517-0.57240.283905
27-0.028034-0.36870.356392
28-0.00823-0.10830.456961
29-0.019874-0.26140.397047
30-0.000209-0.00280.498904
31-0.043205-0.56830.285295
32-0.046251-0.60830.271882
330.0600040.78920.215529
34-0.048539-0.63840.262017
35-0.08471-1.11420.133371
360.0378280.49760.309716
370.0273020.35910.359976
38-0.010186-0.1340.44679
39-0.034545-0.45440.325066
400.0518860.68250.247932
410.0116210.15280.439348
42-0.019289-0.25370.400011
430.0089030.11710.453458
44-0.02035-0.26770.39464
45-0.074747-0.98310.163456
460.0152440.20050.420663
47-0.091378-1.20190.115524
480.0262180.34480.365314

\begin{tabular}{lllllllll}
\hline
Partial Autocorrelation Function \tabularnewline
Time lag k & PACF(k) & T-STAT & P-value \tabularnewline
1 & -0.365346 & -4.8054 & 2e-06 \tabularnewline
2 & -0.39164 & -5.1512 & 0 \tabularnewline
3 & -0.172794 & -2.2728 & 0.012136 \tabularnewline
4 & -0.172059 & -2.2631 & 0.012437 \tabularnewline
5 & -0.040936 & -0.5384 & 0.295486 \tabularnewline
6 & -0.173649 & -2.284 & 0.011793 \tabularnewline
7 & -0.12917 & -1.699 & 0.045561 \tabularnewline
8 & -0.18926 & -2.4893 & 0.006872 \tabularnewline
9 & -0.090986 & -1.1967 & 0.116524 \tabularnewline
10 & -0.190158 & -2.5011 & 0.006655 \tabularnewline
11 & -0.511591 & -6.7289 & 0 \tabularnewline
12 & 0.188589 & 2.4805 & 0.007038 \tabularnewline
13 & -0.024794 & -0.3261 & 0.372367 \tabularnewline
14 & 0.127893 & 1.6822 & 0.04717 \tabularnewline
15 & -0.007554 & -0.0994 & 0.460484 \tabularnewline
16 & 0.042304 & 0.5564 & 0.289318 \tabularnewline
17 & 0.00763 & 0.1004 & 0.460091 \tabularnewline
18 & 0.08889 & 1.1692 & 0.121973 \tabularnewline
19 & 0.036504 & 0.4801 & 0.315869 \tabularnewline
20 & 0.033747 & 0.4439 & 0.328846 \tabularnewline
21 & 0.116011 & 1.5259 & 0.064432 \tabularnewline
22 & -0.117675 & -1.5478 & 0.061752 \tabularnewline
23 & -0.264835 & -3.4834 & 0.000314 \tabularnewline
24 & -0.015877 & -0.2088 & 0.417415 \tabularnewline
25 & -0.080009 & -1.0523 & 0.147053 \tabularnewline
26 & -0.043517 & -0.5724 & 0.283905 \tabularnewline
27 & -0.028034 & -0.3687 & 0.356392 \tabularnewline
28 & -0.00823 & -0.1083 & 0.456961 \tabularnewline
29 & -0.019874 & -0.2614 & 0.397047 \tabularnewline
30 & -0.000209 & -0.0028 & 0.498904 \tabularnewline
31 & -0.043205 & -0.5683 & 0.285295 \tabularnewline
32 & -0.046251 & -0.6083 & 0.271882 \tabularnewline
33 & 0.060004 & 0.7892 & 0.215529 \tabularnewline
34 & -0.048539 & -0.6384 & 0.262017 \tabularnewline
35 & -0.08471 & -1.1142 & 0.133371 \tabularnewline
36 & 0.037828 & 0.4976 & 0.309716 \tabularnewline
37 & 0.027302 & 0.3591 & 0.359976 \tabularnewline
38 & -0.010186 & -0.134 & 0.44679 \tabularnewline
39 & -0.034545 & -0.4544 & 0.325066 \tabularnewline
40 & 0.051886 & 0.6825 & 0.247932 \tabularnewline
41 & 0.011621 & 0.1528 & 0.439348 \tabularnewline
42 & -0.019289 & -0.2537 & 0.400011 \tabularnewline
43 & 0.008903 & 0.1171 & 0.453458 \tabularnewline
44 & -0.02035 & -0.2677 & 0.39464 \tabularnewline
45 & -0.074747 & -0.9831 & 0.163456 \tabularnewline
46 & 0.015244 & 0.2005 & 0.420663 \tabularnewline
47 & -0.091378 & -1.2019 & 0.115524 \tabularnewline
48 & 0.026218 & 0.3448 & 0.365314 \tabularnewline
\hline
\end{tabular}
%Source: https://freestatistics.org/blog/index.php?pk=75580&T=2

[TABLE]
[ROW][C]Partial Autocorrelation Function[/C][/ROW]
[ROW][C]Time lag k[/C][C]PACF(k)[/C][C]T-STAT[/C][C]P-value[/C][/ROW]
[ROW][C]1[/C][C]-0.365346[/C][C]-4.8054[/C][C]2e-06[/C][/ROW]
[ROW][C]2[/C][C]-0.39164[/C][C]-5.1512[/C][C]0[/C][/ROW]
[ROW][C]3[/C][C]-0.172794[/C][C]-2.2728[/C][C]0.012136[/C][/ROW]
[ROW][C]4[/C][C]-0.172059[/C][C]-2.2631[/C][C]0.012437[/C][/ROW]
[ROW][C]5[/C][C]-0.040936[/C][C]-0.5384[/C][C]0.295486[/C][/ROW]
[ROW][C]6[/C][C]-0.173649[/C][C]-2.284[/C][C]0.011793[/C][/ROW]
[ROW][C]7[/C][C]-0.12917[/C][C]-1.699[/C][C]0.045561[/C][/ROW]
[ROW][C]8[/C][C]-0.18926[/C][C]-2.4893[/C][C]0.006872[/C][/ROW]
[ROW][C]9[/C][C]-0.090986[/C][C]-1.1967[/C][C]0.116524[/C][/ROW]
[ROW][C]10[/C][C]-0.190158[/C][C]-2.5011[/C][C]0.006655[/C][/ROW]
[ROW][C]11[/C][C]-0.511591[/C][C]-6.7289[/C][C]0[/C][/ROW]
[ROW][C]12[/C][C]0.188589[/C][C]2.4805[/C][C]0.007038[/C][/ROW]
[ROW][C]13[/C][C]-0.024794[/C][C]-0.3261[/C][C]0.372367[/C][/ROW]
[ROW][C]14[/C][C]0.127893[/C][C]1.6822[/C][C]0.04717[/C][/ROW]
[ROW][C]15[/C][C]-0.007554[/C][C]-0.0994[/C][C]0.460484[/C][/ROW]
[ROW][C]16[/C][C]0.042304[/C][C]0.5564[/C][C]0.289318[/C][/ROW]
[ROW][C]17[/C][C]0.00763[/C][C]0.1004[/C][C]0.460091[/C][/ROW]
[ROW][C]18[/C][C]0.08889[/C][C]1.1692[/C][C]0.121973[/C][/ROW]
[ROW][C]19[/C][C]0.036504[/C][C]0.4801[/C][C]0.315869[/C][/ROW]
[ROW][C]20[/C][C]0.033747[/C][C]0.4439[/C][C]0.328846[/C][/ROW]
[ROW][C]21[/C][C]0.116011[/C][C]1.5259[/C][C]0.064432[/C][/ROW]
[ROW][C]22[/C][C]-0.117675[/C][C]-1.5478[/C][C]0.061752[/C][/ROW]
[ROW][C]23[/C][C]-0.264835[/C][C]-3.4834[/C][C]0.000314[/C][/ROW]
[ROW][C]24[/C][C]-0.015877[/C][C]-0.2088[/C][C]0.417415[/C][/ROW]
[ROW][C]25[/C][C]-0.080009[/C][C]-1.0523[/C][C]0.147053[/C][/ROW]
[ROW][C]26[/C][C]-0.043517[/C][C]-0.5724[/C][C]0.283905[/C][/ROW]
[ROW][C]27[/C][C]-0.028034[/C][C]-0.3687[/C][C]0.356392[/C][/ROW]
[ROW][C]28[/C][C]-0.00823[/C][C]-0.1083[/C][C]0.456961[/C][/ROW]
[ROW][C]29[/C][C]-0.019874[/C][C]-0.2614[/C][C]0.397047[/C][/ROW]
[ROW][C]30[/C][C]-0.000209[/C][C]-0.0028[/C][C]0.498904[/C][/ROW]
[ROW][C]31[/C][C]-0.043205[/C][C]-0.5683[/C][C]0.285295[/C][/ROW]
[ROW][C]32[/C][C]-0.046251[/C][C]-0.6083[/C][C]0.271882[/C][/ROW]
[ROW][C]33[/C][C]0.060004[/C][C]0.7892[/C][C]0.215529[/C][/ROW]
[ROW][C]34[/C][C]-0.048539[/C][C]-0.6384[/C][C]0.262017[/C][/ROW]
[ROW][C]35[/C][C]-0.08471[/C][C]-1.1142[/C][C]0.133371[/C][/ROW]
[ROW][C]36[/C][C]0.037828[/C][C]0.4976[/C][C]0.309716[/C][/ROW]
[ROW][C]37[/C][C]0.027302[/C][C]0.3591[/C][C]0.359976[/C][/ROW]
[ROW][C]38[/C][C]-0.010186[/C][C]-0.134[/C][C]0.44679[/C][/ROW]
[ROW][C]39[/C][C]-0.034545[/C][C]-0.4544[/C][C]0.325066[/C][/ROW]
[ROW][C]40[/C][C]0.051886[/C][C]0.6825[/C][C]0.247932[/C][/ROW]
[ROW][C]41[/C][C]0.011621[/C][C]0.1528[/C][C]0.439348[/C][/ROW]
[ROW][C]42[/C][C]-0.019289[/C][C]-0.2537[/C][C]0.400011[/C][/ROW]
[ROW][C]43[/C][C]0.008903[/C][C]0.1171[/C][C]0.453458[/C][/ROW]
[ROW][C]44[/C][C]-0.02035[/C][C]-0.2677[/C][C]0.39464[/C][/ROW]
[ROW][C]45[/C][C]-0.074747[/C][C]-0.9831[/C][C]0.163456[/C][/ROW]
[ROW][C]46[/C][C]0.015244[/C][C]0.2005[/C][C]0.420663[/C][/ROW]
[ROW][C]47[/C][C]-0.091378[/C][C]-1.2019[/C][C]0.115524[/C][/ROW]
[ROW][C]48[/C][C]0.026218[/C][C]0.3448[/C][C]0.365314[/C][/ROW]
[/TABLE]
Source: https://freestatistics.org/blog/index.php?pk=75580&T=2

Globally Unique Identifier (entire table): ba.freestatistics.org/blog/index.php?pk=75580&T=2

As an alternative you can also use a QR Code:  

The GUIDs for individual cells are displayed in the table below:

Partial Autocorrelation Function
Time lag kPACF(k)T-STATP-value
1-0.365346-4.80542e-06
2-0.39164-5.15120
3-0.172794-2.27280.012136
4-0.172059-2.26310.012437
5-0.040936-0.53840.295486
6-0.173649-2.2840.011793
7-0.12917-1.6990.045561
8-0.18926-2.48930.006872
9-0.090986-1.19670.116524
10-0.190158-2.50110.006655
11-0.511591-6.72890
120.1885892.48050.007038
13-0.024794-0.32610.372367
140.1278931.68220.04717
15-0.007554-0.09940.460484
160.0423040.55640.289318
170.007630.10040.460091
180.088891.16920.121973
190.0365040.48010.315869
200.0337470.44390.328846
210.1160111.52590.064432
22-0.117675-1.54780.061752
23-0.264835-3.48340.000314
24-0.015877-0.20880.417415
25-0.080009-1.05230.147053
26-0.043517-0.57240.283905
27-0.028034-0.36870.356392
28-0.00823-0.10830.456961
29-0.019874-0.26140.397047
30-0.000209-0.00280.498904
31-0.043205-0.56830.285295
32-0.046251-0.60830.271882
330.0600040.78920.215529
34-0.048539-0.63840.262017
35-0.08471-1.11420.133371
360.0378280.49760.309716
370.0273020.35910.359976
38-0.010186-0.1340.44679
39-0.034545-0.45440.325066
400.0518860.68250.247932
410.0116210.15280.439348
42-0.019289-0.25370.400011
430.0089030.11710.453458
44-0.02035-0.26770.39464
45-0.074747-0.98310.163456
460.0152440.20050.420663
47-0.091378-1.20190.115524
480.0262180.34480.365314


Parameters (Session):
par1 = 48 ; par2 = 1 ; par3 = 1 ; par4 = 0 ; par5 = 12 ; par6 = White Noise ; par7 = 0.95 ;
Parameters (R input):
par1 = 48 ; par2 = 1 ; par3 = 1 ; par4 = 0 ; par5 = 12 ; par6 = White Noise ; par7 = 0.95 ;
R code (references can be found in the software module):
if (par1 == 'Default') {
par1 = 10*log10(length(x))
} else {
par1 <- as.numeric(par1)
}
par2 <- as.numeric(par2)
par3 <- as.numeric(par3)
par4 <- as.numeric(par4)
par5 <- as.numeric(par5)
if (par6 == 'White Noise') par6 <- 'white' else par6 <- 'ma'
par7 <- as.numeric(par7)
if (par2 == 0) {
x <- log(x)
} else {
x <- (x ^ par2 - 1) / par2
}
if (par3 > 0) x <- diff(x,lag=1,difference=par3)
if (par4 > 0) x <- diff(x,lag=par5,difference=par4)
bitmap(file='pic1.png')
racf <- acf(x, par1, main='Autocorrelation', xlab='time lag', ylab='ACF', ci.type=par6, ci=par7, sub=paste('(lambda=',par2,', d=',par3,', D=',par4,', CI=', par7, ', CI type=',par6,')',sep=''))
dev.off()
bitmap(file='pic2.png')
rpacf <- pacf(x,par1,main='Partial Autocorrelation',xlab='lags',ylab='PACF')
dev.off()
(myacf <- c(racf$acf))
(mypacf <- c(rpacf$acf))
lengthx <- length(x)
sqrtn <- sqrt(lengthx)
load(file='createtable')
a<-table.start()
a<-table.row.start(a)
a<-table.element(a,'Autocorrelation Function',4,TRUE)
a<-table.row.end(a)
a<-table.row.start(a)
a<-table.element(a,'Time lag k',header=TRUE)
a<-table.element(a,hyperlink('basics.htm','ACF(k)','click here for more information about the Autocorrelation Function'),header=TRUE)
a<-table.element(a,'T-STAT',header=TRUE)
a<-table.element(a,'P-value',header=TRUE)
a<-table.row.end(a)
for (i in 2:(par1+1)) {
a<-table.row.start(a)
a<-table.element(a,i-1,header=TRUE)
a<-table.element(a,round(myacf[i],6))
mytstat <- myacf[i]*sqrtn
a<-table.element(a,round(mytstat,4))
a<-table.element(a,round(1-pt(abs(mytstat),lengthx),6))
a<-table.row.end(a)
}
a<-table.end(a)
table.save(a,file='mytable.tab')
a<-table.start()
a<-table.row.start(a)
a<-table.element(a,'Partial Autocorrelation Function',4,TRUE)
a<-table.row.end(a)
a<-table.row.start(a)
a<-table.element(a,'Time lag k',header=TRUE)
a<-table.element(a,hyperlink('basics.htm','PACF(k)','click here for more information about the Partial Autocorrelation Function'),header=TRUE)
a<-table.element(a,'T-STAT',header=TRUE)
a<-table.element(a,'P-value',header=TRUE)
a<-table.row.end(a)
for (i in 1:par1) {
a<-table.row.start(a)
a<-table.element(a,i,header=TRUE)
a<-table.element(a,round(mypacf[i],6))
mytstat <- mypacf[i]*sqrtn
a<-table.element(a,round(mytstat,4))
a<-table.element(a,round(1-pt(abs(mytstat),lengthx),6))
a<-table.row.end(a)
}
a<-table.end(a)
table.save(a,file='mytable1.tab')