Free Statistics

of Irreproducible Research!

Author's title

Author*Unverified author*
R Software Modulerwasp_autocorrelation.wasp
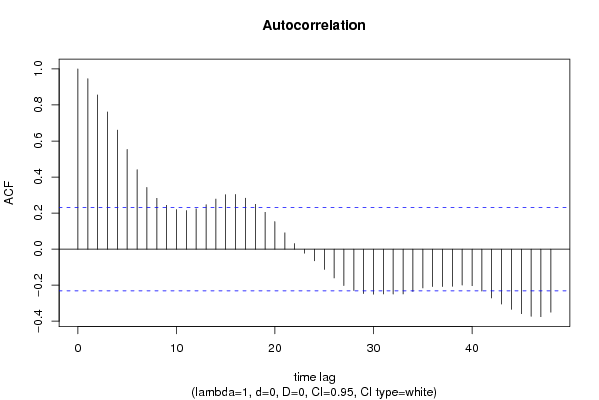
Title produced by software(Partial) Autocorrelation Function
Date of computationWed, 05 May 2010 14:37:50 +0000
Cite this page as followsStatistical Computations at FreeStatistics.org, Office for Research Development and Education, URL https://freestatistics.org/blog/index.php?v=date/2010/May/05/t1273070359smskujxo0mtnbit.htm/, Retrieved Wed, 01 May 2024 22:54:23 +0000
Statistical Computations at FreeStatistics.org, Office for Research Development and Education, URL https://freestatistics.org/blog/index.php?pk=75526, Retrieved Wed, 01 May 2024 22:54:23 +0000
QR Codes:

Original text written by user:
IsPrivate?No (this computation is public)
User-defined keywordsKDGP2W21
Estimated Impact146
Family? (F = Feedback message, R = changed R code, M = changed R Module, P = changed Parameters, D = changed Data)
-       [(Partial) Autocorrelation Function] [Wisselkoersen] [2010-05-05 14:37:50] [518b58fa2b091d980a743b3df0de830f] [Current]
Feedback Forum

Post a new message
Dataseries X:
1,4272
1,4614
1,4914
1,4816
1,4562
1,4268
1,4088
1,4016
1,365
1,319
1,305
1,2785
1,3239
1,3449
1,2732
1,3322
1,4369
1,4975
1,577
1,5553
1,5557
1,575
1,5527
1,4748
1,4718
1,457
1,4684
1,4227
1,3896
1,3622
1,3716
1,3419
1,3511
1,3516
1,3242
1,3074
1,2999
1,3213
1,2881
1,2611
1,2727
1,2811
1,2684
1,265
1,277
1,2271
1,202
1,1938
1,2103
1,1856
1,1786
1,2015
1,2256
1,2292
1,2037
1,2165
1,2694
1,2938
1,3201
1,3014
1,3119
1,3408
1,2991
1,249
1,2218
1,2176
1,2266
1,2138
1,2007
1,1985
1,2262
1,2646


Summary of computational transaction
Raw Inputview raw input (R code)
Raw Outputview raw output of R engine
Computing time1 seconds
R Server'Gwilym Jenkins' @ 72.249.127.135

\begin{tabular}{lllllllll}
\hline
Summary of computational transaction \tabularnewline
Raw Input & view raw input (R code)  \tabularnewline
Raw Output & view raw output of R engine  \tabularnewline
Computing time & 1 seconds \tabularnewline
R Server & 'Gwilym Jenkins' @ 72.249.127.135 \tabularnewline
\hline
\end{tabular}
%Source: https://freestatistics.org/blog/index.php?pk=75526&T=0

[TABLE]
[ROW][C]Summary of computational transaction[/C][/ROW]
[ROW][C]Raw Input[/C][C]view raw input (R code) [/C][/ROW]
[ROW][C]Raw Output[/C][C]view raw output of R engine [/C][/ROW]
[ROW][C]Computing time[/C][C]1 seconds[/C][/ROW]
[ROW][C]R Server[/C][C]'Gwilym Jenkins' @ 72.249.127.135[/C][/ROW]
[/TABLE]
Source: https://freestatistics.org/blog/index.php?pk=75526&T=0

Globally Unique Identifier (entire table): ba.freestatistics.org/blog/index.php?pk=75526&T=0

As an alternative you can also use a QR Code:  

The GUIDs for individual cells are displayed in the table below:

Summary of computational transaction
Raw Inputview raw input (R code)
Raw Outputview raw output of R engine
Computing time1 seconds
R Server'Gwilym Jenkins' @ 72.249.127.135


Autocorrelation Function
Time lag kACF(k)T-STATP-value
10.9458988.02620
20.8559217.26270
30.761136.45840
40.6605645.60510
50.5533024.69496e-06
60.4411243.74310.000181
70.3424182.90550.002434
80.2820552.39330.009653
90.2430352.06220.021398
100.2194651.86220.033326
110.2142991.81840.036582
120.2238531.89950.030755
130.2465082.09170.019997
140.2780682.35950.010507
150.3020892.56330.006229
160.3039122.57880.005979
170.2828772.40030.009484
180.2491152.11380.018998
190.2041891.73260.043724
200.1527831.29640.099487
210.0908470.77090.221656
220.0308030.26140.397276
23-0.022478-0.19070.424636
24-0.064727-0.54920.292273
25-0.112707-0.95640.171047
26-0.159486-1.35330.0901
27-0.20232-1.71670.045163
28-0.228779-1.94130.028071
29-0.246621-2.09270.019953
30-0.250158-2.12270.018611
31-0.248745-2.11070.019137
32-0.249245-2.11490.01895
33-0.248384-2.10760.019274
34-0.234395-1.98890.025256
35-0.215216-1.82620.035985
36-0.207663-1.76210.04115
37-0.207467-1.76040.041292
38-0.206395-1.75130.042075
39-0.19958-1.69350.047342
40-0.202406-1.71750.045096
41-0.232289-1.9710.026282
42-0.270795-2.29780.012241
43-0.304926-2.58740.005845
44-0.333973-2.83390.002982
45-0.357787-3.03590.001668
46-0.372991-3.16490.001137
47-0.37457-3.17830.001092
48-0.349577-2.96630.002044

\begin{tabular}{lllllllll}
\hline
Autocorrelation Function \tabularnewline
Time lag k & ACF(k) & T-STAT & P-value \tabularnewline
1 & 0.945898 & 8.0262 & 0 \tabularnewline
2 & 0.855921 & 7.2627 & 0 \tabularnewline
3 & 0.76113 & 6.4584 & 0 \tabularnewline
4 & 0.660564 & 5.6051 & 0 \tabularnewline
5 & 0.553302 & 4.6949 & 6e-06 \tabularnewline
6 & 0.441124 & 3.7431 & 0.000181 \tabularnewline
7 & 0.342418 & 2.9055 & 0.002434 \tabularnewline
8 & 0.282055 & 2.3933 & 0.009653 \tabularnewline
9 & 0.243035 & 2.0622 & 0.021398 \tabularnewline
10 & 0.219465 & 1.8622 & 0.033326 \tabularnewline
11 & 0.214299 & 1.8184 & 0.036582 \tabularnewline
12 & 0.223853 & 1.8995 & 0.030755 \tabularnewline
13 & 0.246508 & 2.0917 & 0.019997 \tabularnewline
14 & 0.278068 & 2.3595 & 0.010507 \tabularnewline
15 & 0.302089 & 2.5633 & 0.006229 \tabularnewline
16 & 0.303912 & 2.5788 & 0.005979 \tabularnewline
17 & 0.282877 & 2.4003 & 0.009484 \tabularnewline
18 & 0.249115 & 2.1138 & 0.018998 \tabularnewline
19 & 0.204189 & 1.7326 & 0.043724 \tabularnewline
20 & 0.152783 & 1.2964 & 0.099487 \tabularnewline
21 & 0.090847 & 0.7709 & 0.221656 \tabularnewline
22 & 0.030803 & 0.2614 & 0.397276 \tabularnewline
23 & -0.022478 & -0.1907 & 0.424636 \tabularnewline
24 & -0.064727 & -0.5492 & 0.292273 \tabularnewline
25 & -0.112707 & -0.9564 & 0.171047 \tabularnewline
26 & -0.159486 & -1.3533 & 0.0901 \tabularnewline
27 & -0.20232 & -1.7167 & 0.045163 \tabularnewline
28 & -0.228779 & -1.9413 & 0.028071 \tabularnewline
29 & -0.246621 & -2.0927 & 0.019953 \tabularnewline
30 & -0.250158 & -2.1227 & 0.018611 \tabularnewline
31 & -0.248745 & -2.1107 & 0.019137 \tabularnewline
32 & -0.249245 & -2.1149 & 0.01895 \tabularnewline
33 & -0.248384 & -2.1076 & 0.019274 \tabularnewline
34 & -0.234395 & -1.9889 & 0.025256 \tabularnewline
35 & -0.215216 & -1.8262 & 0.035985 \tabularnewline
36 & -0.207663 & -1.7621 & 0.04115 \tabularnewline
37 & -0.207467 & -1.7604 & 0.041292 \tabularnewline
38 & -0.206395 & -1.7513 & 0.042075 \tabularnewline
39 & -0.19958 & -1.6935 & 0.047342 \tabularnewline
40 & -0.202406 & -1.7175 & 0.045096 \tabularnewline
41 & -0.232289 & -1.971 & 0.026282 \tabularnewline
42 & -0.270795 & -2.2978 & 0.012241 \tabularnewline
43 & -0.304926 & -2.5874 & 0.005845 \tabularnewline
44 & -0.333973 & -2.8339 & 0.002982 \tabularnewline
45 & -0.357787 & -3.0359 & 0.001668 \tabularnewline
46 & -0.372991 & -3.1649 & 0.001137 \tabularnewline
47 & -0.37457 & -3.1783 & 0.001092 \tabularnewline
48 & -0.349577 & -2.9663 & 0.002044 \tabularnewline
\hline
\end{tabular}
%Source: https://freestatistics.org/blog/index.php?pk=75526&T=1

[TABLE]
[ROW][C]Autocorrelation Function[/C][/ROW]
[ROW][C]Time lag k[/C][C]ACF(k)[/C][C]T-STAT[/C][C]P-value[/C][/ROW]
[ROW][C]1[/C][C]0.945898[/C][C]8.0262[/C][C]0[/C][/ROW]
[ROW][C]2[/C][C]0.855921[/C][C]7.2627[/C][C]0[/C][/ROW]
[ROW][C]3[/C][C]0.76113[/C][C]6.4584[/C][C]0[/C][/ROW]
[ROW][C]4[/C][C]0.660564[/C][C]5.6051[/C][C]0[/C][/ROW]
[ROW][C]5[/C][C]0.553302[/C][C]4.6949[/C][C]6e-06[/C][/ROW]
[ROW][C]6[/C][C]0.441124[/C][C]3.7431[/C][C]0.000181[/C][/ROW]
[ROW][C]7[/C][C]0.342418[/C][C]2.9055[/C][C]0.002434[/C][/ROW]
[ROW][C]8[/C][C]0.282055[/C][C]2.3933[/C][C]0.009653[/C][/ROW]
[ROW][C]9[/C][C]0.243035[/C][C]2.0622[/C][C]0.021398[/C][/ROW]
[ROW][C]10[/C][C]0.219465[/C][C]1.8622[/C][C]0.033326[/C][/ROW]
[ROW][C]11[/C][C]0.214299[/C][C]1.8184[/C][C]0.036582[/C][/ROW]
[ROW][C]12[/C][C]0.223853[/C][C]1.8995[/C][C]0.030755[/C][/ROW]
[ROW][C]13[/C][C]0.246508[/C][C]2.0917[/C][C]0.019997[/C][/ROW]
[ROW][C]14[/C][C]0.278068[/C][C]2.3595[/C][C]0.010507[/C][/ROW]
[ROW][C]15[/C][C]0.302089[/C][C]2.5633[/C][C]0.006229[/C][/ROW]
[ROW][C]16[/C][C]0.303912[/C][C]2.5788[/C][C]0.005979[/C][/ROW]
[ROW][C]17[/C][C]0.282877[/C][C]2.4003[/C][C]0.009484[/C][/ROW]
[ROW][C]18[/C][C]0.249115[/C][C]2.1138[/C][C]0.018998[/C][/ROW]
[ROW][C]19[/C][C]0.204189[/C][C]1.7326[/C][C]0.043724[/C][/ROW]
[ROW][C]20[/C][C]0.152783[/C][C]1.2964[/C][C]0.099487[/C][/ROW]
[ROW][C]21[/C][C]0.090847[/C][C]0.7709[/C][C]0.221656[/C][/ROW]
[ROW][C]22[/C][C]0.030803[/C][C]0.2614[/C][C]0.397276[/C][/ROW]
[ROW][C]23[/C][C]-0.022478[/C][C]-0.1907[/C][C]0.424636[/C][/ROW]
[ROW][C]24[/C][C]-0.064727[/C][C]-0.5492[/C][C]0.292273[/C][/ROW]
[ROW][C]25[/C][C]-0.112707[/C][C]-0.9564[/C][C]0.171047[/C][/ROW]
[ROW][C]26[/C][C]-0.159486[/C][C]-1.3533[/C][C]0.0901[/C][/ROW]
[ROW][C]27[/C][C]-0.20232[/C][C]-1.7167[/C][C]0.045163[/C][/ROW]
[ROW][C]28[/C][C]-0.228779[/C][C]-1.9413[/C][C]0.028071[/C][/ROW]
[ROW][C]29[/C][C]-0.246621[/C][C]-2.0927[/C][C]0.019953[/C][/ROW]
[ROW][C]30[/C][C]-0.250158[/C][C]-2.1227[/C][C]0.018611[/C][/ROW]
[ROW][C]31[/C][C]-0.248745[/C][C]-2.1107[/C][C]0.019137[/C][/ROW]
[ROW][C]32[/C][C]-0.249245[/C][C]-2.1149[/C][C]0.01895[/C][/ROW]
[ROW][C]33[/C][C]-0.248384[/C][C]-2.1076[/C][C]0.019274[/C][/ROW]
[ROW][C]34[/C][C]-0.234395[/C][C]-1.9889[/C][C]0.025256[/C][/ROW]
[ROW][C]35[/C][C]-0.215216[/C][C]-1.8262[/C][C]0.035985[/C][/ROW]
[ROW][C]36[/C][C]-0.207663[/C][C]-1.7621[/C][C]0.04115[/C][/ROW]
[ROW][C]37[/C][C]-0.207467[/C][C]-1.7604[/C][C]0.041292[/C][/ROW]
[ROW][C]38[/C][C]-0.206395[/C][C]-1.7513[/C][C]0.042075[/C][/ROW]
[ROW][C]39[/C][C]-0.19958[/C][C]-1.6935[/C][C]0.047342[/C][/ROW]
[ROW][C]40[/C][C]-0.202406[/C][C]-1.7175[/C][C]0.045096[/C][/ROW]
[ROW][C]41[/C][C]-0.232289[/C][C]-1.971[/C][C]0.026282[/C][/ROW]
[ROW][C]42[/C][C]-0.270795[/C][C]-2.2978[/C][C]0.012241[/C][/ROW]
[ROW][C]43[/C][C]-0.304926[/C][C]-2.5874[/C][C]0.005845[/C][/ROW]
[ROW][C]44[/C][C]-0.333973[/C][C]-2.8339[/C][C]0.002982[/C][/ROW]
[ROW][C]45[/C][C]-0.357787[/C][C]-3.0359[/C][C]0.001668[/C][/ROW]
[ROW][C]46[/C][C]-0.372991[/C][C]-3.1649[/C][C]0.001137[/C][/ROW]
[ROW][C]47[/C][C]-0.37457[/C][C]-3.1783[/C][C]0.001092[/C][/ROW]
[ROW][C]48[/C][C]-0.349577[/C][C]-2.9663[/C][C]0.002044[/C][/ROW]
[/TABLE]
Source: https://freestatistics.org/blog/index.php?pk=75526&T=1

Globally Unique Identifier (entire table): ba.freestatistics.org/blog/index.php?pk=75526&T=1

As an alternative you can also use a QR Code:  

The GUIDs for individual cells are displayed in the table below:

Autocorrelation Function
Time lag kACF(k)T-STATP-value
10.9458988.02620
20.8559217.26270
30.761136.45840
40.6605645.60510
50.5533024.69496e-06
60.4411243.74310.000181
70.3424182.90550.002434
80.2820552.39330.009653
90.2430352.06220.021398
100.2194651.86220.033326
110.2142991.81840.036582
120.2238531.89950.030755
130.2465082.09170.019997
140.2780682.35950.010507
150.3020892.56330.006229
160.3039122.57880.005979
170.2828772.40030.009484
180.2491152.11380.018998
190.2041891.73260.043724
200.1527831.29640.099487
210.0908470.77090.221656
220.0308030.26140.397276
23-0.022478-0.19070.424636
24-0.064727-0.54920.292273
25-0.112707-0.95640.171047
26-0.159486-1.35330.0901
27-0.20232-1.71670.045163
28-0.228779-1.94130.028071
29-0.246621-2.09270.019953
30-0.250158-2.12270.018611
31-0.248745-2.11070.019137
32-0.249245-2.11490.01895
33-0.248384-2.10760.019274
34-0.234395-1.98890.025256
35-0.215216-1.82620.035985
36-0.207663-1.76210.04115
37-0.207467-1.76040.041292
38-0.206395-1.75130.042075
39-0.19958-1.69350.047342
40-0.202406-1.71750.045096
41-0.232289-1.9710.026282
42-0.270795-2.29780.012241
43-0.304926-2.58740.005845
44-0.333973-2.83390.002982
45-0.357787-3.03590.001668
46-0.372991-3.16490.001137
47-0.37457-3.17830.001092
48-0.349577-2.96630.002044


Partial Autocorrelation Function
Time lag kPACF(k)T-STATP-value
10.9458988.02620
2-0.368582-3.12750.001272
30.0192190.16310.435457
4-0.126982-1.07750.142432
5-0.094093-0.79840.213631
6-0.094406-0.80110.212867
70.0955560.81080.21007
80.2576632.18630.016021
9-0.034685-0.29430.384682
100.0762810.64730.259759
110.0587080.49820.309947
120.0038260.03250.487095
130.0338150.28690.387496
140.0708290.6010.274862
15-0.040835-0.34650.36499
16-0.189285-1.60610.056311
17-0.10202-0.86570.194773
180.0056370.04780.480993
19-0.055004-0.46670.321054
200.0622360.52810.299531
21-0.036349-0.30840.379321
220.0479210.40660.342745
23-0.095524-0.81050.210148
240.0121880.10340.45896
25-0.223526-1.89670.030941
26-0.040652-0.34490.365571
27-0.101238-0.8590.196587
280.0737450.62570.266729
29-0.070751-0.60030.275082
300.1679611.42520.07921
31-0.038517-0.32680.372374
32-0.089061-0.75570.226146
33-0.004704-0.03990.484134
340.1469391.24680.108253
35-0.019097-0.1620.435862
36-0.164152-1.39290.083972
370.066550.56470.287017
38-0.049837-0.42290.336821
390.0080760.06850.472779
40-0.091306-0.77480.22051
41-0.075809-0.64330.261049
42-0.00039-0.00330.498685
43-0.01691-0.14350.443154
440.0104080.08830.464934
450.0337110.2860.387832
460.0100170.0850.466249
470.0819060.6950.244648
480.0540360.45850.323983

\begin{tabular}{lllllllll}
\hline
Partial Autocorrelation Function \tabularnewline
Time lag k & PACF(k) & T-STAT & P-value \tabularnewline
1 & 0.945898 & 8.0262 & 0 \tabularnewline
2 & -0.368582 & -3.1275 & 0.001272 \tabularnewline
3 & 0.019219 & 0.1631 & 0.435457 \tabularnewline
4 & -0.126982 & -1.0775 & 0.142432 \tabularnewline
5 & -0.094093 & -0.7984 & 0.213631 \tabularnewline
6 & -0.094406 & -0.8011 & 0.212867 \tabularnewline
7 & 0.095556 & 0.8108 & 0.21007 \tabularnewline
8 & 0.257663 & 2.1863 & 0.016021 \tabularnewline
9 & -0.034685 & -0.2943 & 0.384682 \tabularnewline
10 & 0.076281 & 0.6473 & 0.259759 \tabularnewline
11 & 0.058708 & 0.4982 & 0.309947 \tabularnewline
12 & 0.003826 & 0.0325 & 0.487095 \tabularnewline
13 & 0.033815 & 0.2869 & 0.387496 \tabularnewline
14 & 0.070829 & 0.601 & 0.274862 \tabularnewline
15 & -0.040835 & -0.3465 & 0.36499 \tabularnewline
16 & -0.189285 & -1.6061 & 0.056311 \tabularnewline
17 & -0.10202 & -0.8657 & 0.194773 \tabularnewline
18 & 0.005637 & 0.0478 & 0.480993 \tabularnewline
19 & -0.055004 & -0.4667 & 0.321054 \tabularnewline
20 & 0.062236 & 0.5281 & 0.299531 \tabularnewline
21 & -0.036349 & -0.3084 & 0.379321 \tabularnewline
22 & 0.047921 & 0.4066 & 0.342745 \tabularnewline
23 & -0.095524 & -0.8105 & 0.210148 \tabularnewline
24 & 0.012188 & 0.1034 & 0.45896 \tabularnewline
25 & -0.223526 & -1.8967 & 0.030941 \tabularnewline
26 & -0.040652 & -0.3449 & 0.365571 \tabularnewline
27 & -0.101238 & -0.859 & 0.196587 \tabularnewline
28 & 0.073745 & 0.6257 & 0.266729 \tabularnewline
29 & -0.070751 & -0.6003 & 0.275082 \tabularnewline
30 & 0.167961 & 1.4252 & 0.07921 \tabularnewline
31 & -0.038517 & -0.3268 & 0.372374 \tabularnewline
32 & -0.089061 & -0.7557 & 0.226146 \tabularnewline
33 & -0.004704 & -0.0399 & 0.484134 \tabularnewline
34 & 0.146939 & 1.2468 & 0.108253 \tabularnewline
35 & -0.019097 & -0.162 & 0.435862 \tabularnewline
36 & -0.164152 & -1.3929 & 0.083972 \tabularnewline
37 & 0.06655 & 0.5647 & 0.287017 \tabularnewline
38 & -0.049837 & -0.4229 & 0.336821 \tabularnewline
39 & 0.008076 & 0.0685 & 0.472779 \tabularnewline
40 & -0.091306 & -0.7748 & 0.22051 \tabularnewline
41 & -0.075809 & -0.6433 & 0.261049 \tabularnewline
42 & -0.00039 & -0.0033 & 0.498685 \tabularnewline
43 & -0.01691 & -0.1435 & 0.443154 \tabularnewline
44 & 0.010408 & 0.0883 & 0.464934 \tabularnewline
45 & 0.033711 & 0.286 & 0.387832 \tabularnewline
46 & 0.010017 & 0.085 & 0.466249 \tabularnewline
47 & 0.081906 & 0.695 & 0.244648 \tabularnewline
48 & 0.054036 & 0.4585 & 0.323983 \tabularnewline
\hline
\end{tabular}
%Source: https://freestatistics.org/blog/index.php?pk=75526&T=2

[TABLE]
[ROW][C]Partial Autocorrelation Function[/C][/ROW]
[ROW][C]Time lag k[/C][C]PACF(k)[/C][C]T-STAT[/C][C]P-value[/C][/ROW]
[ROW][C]1[/C][C]0.945898[/C][C]8.0262[/C][C]0[/C][/ROW]
[ROW][C]2[/C][C]-0.368582[/C][C]-3.1275[/C][C]0.001272[/C][/ROW]
[ROW][C]3[/C][C]0.019219[/C][C]0.1631[/C][C]0.435457[/C][/ROW]
[ROW][C]4[/C][C]-0.126982[/C][C]-1.0775[/C][C]0.142432[/C][/ROW]
[ROW][C]5[/C][C]-0.094093[/C][C]-0.7984[/C][C]0.213631[/C][/ROW]
[ROW][C]6[/C][C]-0.094406[/C][C]-0.8011[/C][C]0.212867[/C][/ROW]
[ROW][C]7[/C][C]0.095556[/C][C]0.8108[/C][C]0.21007[/C][/ROW]
[ROW][C]8[/C][C]0.257663[/C][C]2.1863[/C][C]0.016021[/C][/ROW]
[ROW][C]9[/C][C]-0.034685[/C][C]-0.2943[/C][C]0.384682[/C][/ROW]
[ROW][C]10[/C][C]0.076281[/C][C]0.6473[/C][C]0.259759[/C][/ROW]
[ROW][C]11[/C][C]0.058708[/C][C]0.4982[/C][C]0.309947[/C][/ROW]
[ROW][C]12[/C][C]0.003826[/C][C]0.0325[/C][C]0.487095[/C][/ROW]
[ROW][C]13[/C][C]0.033815[/C][C]0.2869[/C][C]0.387496[/C][/ROW]
[ROW][C]14[/C][C]0.070829[/C][C]0.601[/C][C]0.274862[/C][/ROW]
[ROW][C]15[/C][C]-0.040835[/C][C]-0.3465[/C][C]0.36499[/C][/ROW]
[ROW][C]16[/C][C]-0.189285[/C][C]-1.6061[/C][C]0.056311[/C][/ROW]
[ROW][C]17[/C][C]-0.10202[/C][C]-0.8657[/C][C]0.194773[/C][/ROW]
[ROW][C]18[/C][C]0.005637[/C][C]0.0478[/C][C]0.480993[/C][/ROW]
[ROW][C]19[/C][C]-0.055004[/C][C]-0.4667[/C][C]0.321054[/C][/ROW]
[ROW][C]20[/C][C]0.062236[/C][C]0.5281[/C][C]0.299531[/C][/ROW]
[ROW][C]21[/C][C]-0.036349[/C][C]-0.3084[/C][C]0.379321[/C][/ROW]
[ROW][C]22[/C][C]0.047921[/C][C]0.4066[/C][C]0.342745[/C][/ROW]
[ROW][C]23[/C][C]-0.095524[/C][C]-0.8105[/C][C]0.210148[/C][/ROW]
[ROW][C]24[/C][C]0.012188[/C][C]0.1034[/C][C]0.45896[/C][/ROW]
[ROW][C]25[/C][C]-0.223526[/C][C]-1.8967[/C][C]0.030941[/C][/ROW]
[ROW][C]26[/C][C]-0.040652[/C][C]-0.3449[/C][C]0.365571[/C][/ROW]
[ROW][C]27[/C][C]-0.101238[/C][C]-0.859[/C][C]0.196587[/C][/ROW]
[ROW][C]28[/C][C]0.073745[/C][C]0.6257[/C][C]0.266729[/C][/ROW]
[ROW][C]29[/C][C]-0.070751[/C][C]-0.6003[/C][C]0.275082[/C][/ROW]
[ROW][C]30[/C][C]0.167961[/C][C]1.4252[/C][C]0.07921[/C][/ROW]
[ROW][C]31[/C][C]-0.038517[/C][C]-0.3268[/C][C]0.372374[/C][/ROW]
[ROW][C]32[/C][C]-0.089061[/C][C]-0.7557[/C][C]0.226146[/C][/ROW]
[ROW][C]33[/C][C]-0.004704[/C][C]-0.0399[/C][C]0.484134[/C][/ROW]
[ROW][C]34[/C][C]0.146939[/C][C]1.2468[/C][C]0.108253[/C][/ROW]
[ROW][C]35[/C][C]-0.019097[/C][C]-0.162[/C][C]0.435862[/C][/ROW]
[ROW][C]36[/C][C]-0.164152[/C][C]-1.3929[/C][C]0.083972[/C][/ROW]
[ROW][C]37[/C][C]0.06655[/C][C]0.5647[/C][C]0.287017[/C][/ROW]
[ROW][C]38[/C][C]-0.049837[/C][C]-0.4229[/C][C]0.336821[/C][/ROW]
[ROW][C]39[/C][C]0.008076[/C][C]0.0685[/C][C]0.472779[/C][/ROW]
[ROW][C]40[/C][C]-0.091306[/C][C]-0.7748[/C][C]0.22051[/C][/ROW]
[ROW][C]41[/C][C]-0.075809[/C][C]-0.6433[/C][C]0.261049[/C][/ROW]
[ROW][C]42[/C][C]-0.00039[/C][C]-0.0033[/C][C]0.498685[/C][/ROW]
[ROW][C]43[/C][C]-0.01691[/C][C]-0.1435[/C][C]0.443154[/C][/ROW]
[ROW][C]44[/C][C]0.010408[/C][C]0.0883[/C][C]0.464934[/C][/ROW]
[ROW][C]45[/C][C]0.033711[/C][C]0.286[/C][C]0.387832[/C][/ROW]
[ROW][C]46[/C][C]0.010017[/C][C]0.085[/C][C]0.466249[/C][/ROW]
[ROW][C]47[/C][C]0.081906[/C][C]0.695[/C][C]0.244648[/C][/ROW]
[ROW][C]48[/C][C]0.054036[/C][C]0.4585[/C][C]0.323983[/C][/ROW]
[/TABLE]
Source: https://freestatistics.org/blog/index.php?pk=75526&T=2

Globally Unique Identifier (entire table): ba.freestatistics.org/blog/index.php?pk=75526&T=2

As an alternative you can also use a QR Code:  

The GUIDs for individual cells are displayed in the table below:

Partial Autocorrelation Function
Time lag kPACF(k)T-STATP-value
10.9458988.02620
2-0.368582-3.12750.001272
30.0192190.16310.435457
4-0.126982-1.07750.142432
5-0.094093-0.79840.213631
6-0.094406-0.80110.212867
70.0955560.81080.21007
80.2576632.18630.016021
9-0.034685-0.29430.384682
100.0762810.64730.259759
110.0587080.49820.309947
120.0038260.03250.487095
130.0338150.28690.387496
140.0708290.6010.274862
15-0.040835-0.34650.36499
16-0.189285-1.60610.056311
17-0.10202-0.86570.194773
180.0056370.04780.480993
19-0.055004-0.46670.321054
200.0622360.52810.299531
21-0.036349-0.30840.379321
220.0479210.40660.342745
23-0.095524-0.81050.210148
240.0121880.10340.45896
25-0.223526-1.89670.030941
26-0.040652-0.34490.365571
27-0.101238-0.8590.196587
280.0737450.62570.266729
29-0.070751-0.60030.275082
300.1679611.42520.07921
31-0.038517-0.32680.372374
32-0.089061-0.75570.226146
33-0.004704-0.03990.484134
340.1469391.24680.108253
35-0.019097-0.1620.435862
36-0.164152-1.39290.083972
370.066550.56470.287017
38-0.049837-0.42290.336821
390.0080760.06850.472779
40-0.091306-0.77480.22051
41-0.075809-0.64330.261049
42-0.00039-0.00330.498685
43-0.01691-0.14350.443154
440.0104080.08830.464934
450.0337110.2860.387832
460.0100170.0850.466249
470.0819060.6950.244648
480.0540360.45850.323983


Parameters (Session):
par1 = 48 ; par2 = 1 ; par3 = 0 ; par4 = 0 ; par5 = 12 ; par6 = White Noise ; par7 = 0.95 ;
Parameters (R input):
par1 = 48 ; par2 = 1 ; par3 = 0 ; par4 = 0 ; par5 = 12 ; par6 = White Noise ; par7 = 0.95 ;
R code (references can be found in the software module):
if (par1 == 'Default') {
par1 = 10*log10(length(x))
} else {
par1 <- as.numeric(par1)
}
par2 <- as.numeric(par2)
par3 <- as.numeric(par3)
par4 <- as.numeric(par4)
par5 <- as.numeric(par5)
if (par6 == 'White Noise') par6 <- 'white' else par6 <- 'ma'
par7 <- as.numeric(par7)
if (par2 == 0) {
x <- log(x)
} else {
x <- (x ^ par2 - 1) / par2
}
if (par3 > 0) x <- diff(x,lag=1,difference=par3)
if (par4 > 0) x <- diff(x,lag=par5,difference=par4)
bitmap(file='pic1.png')
racf <- acf(x, par1, main='Autocorrelation', xlab='time lag', ylab='ACF', ci.type=par6, ci=par7, sub=paste('(lambda=',par2,', d=',par3,', D=',par4,', CI=', par7, ', CI type=',par6,')',sep=''))
dev.off()
bitmap(file='pic2.png')
rpacf <- pacf(x,par1,main='Partial Autocorrelation',xlab='lags',ylab='PACF')
dev.off()
(myacf <- c(racf$acf))
(mypacf <- c(rpacf$acf))
lengthx <- length(x)
sqrtn <- sqrt(lengthx)
load(file='createtable')
a<-table.start()
a<-table.row.start(a)
a<-table.element(a,'Autocorrelation Function',4,TRUE)
a<-table.row.end(a)
a<-table.row.start(a)
a<-table.element(a,'Time lag k',header=TRUE)
a<-table.element(a,hyperlink('basics.htm','ACF(k)','click here for more information about the Autocorrelation Function'),header=TRUE)
a<-table.element(a,'T-STAT',header=TRUE)
a<-table.element(a,'P-value',header=TRUE)
a<-table.row.end(a)
for (i in 2:(par1+1)) {
a<-table.row.start(a)
a<-table.element(a,i-1,header=TRUE)
a<-table.element(a,round(myacf[i],6))
mytstat <- myacf[i]*sqrtn
a<-table.element(a,round(mytstat,4))
a<-table.element(a,round(1-pt(abs(mytstat),lengthx),6))
a<-table.row.end(a)
}
a<-table.end(a)
table.save(a,file='mytable.tab')
a<-table.start()
a<-table.row.start(a)
a<-table.element(a,'Partial Autocorrelation Function',4,TRUE)
a<-table.row.end(a)
a<-table.row.start(a)
a<-table.element(a,'Time lag k',header=TRUE)
a<-table.element(a,hyperlink('basics.htm','PACF(k)','click here for more information about the Partial Autocorrelation Function'),header=TRUE)
a<-table.element(a,'T-STAT',header=TRUE)
a<-table.element(a,'P-value',header=TRUE)
a<-table.row.end(a)
for (i in 1:par1) {
a<-table.row.start(a)
a<-table.element(a,i,header=TRUE)
a<-table.element(a,round(mypacf[i],6))
mytstat <- mypacf[i]*sqrtn
a<-table.element(a,round(mytstat,4))
a<-table.element(a,round(1-pt(abs(mytstat),lengthx),6))
a<-table.row.end(a)
}
a<-table.end(a)
table.save(a,file='mytable1.tab')