| Multiple Linear Regression - Estimated Regression Equation |
| SWS[t] = + 9.71704929682466 -2.19699958033701logWb[t] + e[t] |
| Multiple Linear Regression - Ordinary Least Squares | |||||
| Variable | Parameter | S.D. | T-STAT H0: parameter = 0 | 2-tail p-value | 1-tail p-value |
| (Intercept) | 9.71704929682466 | 0.479175 | 20.2787 | 0 | 0 |
| logWb | -2.19699958033701 | 0.354881 | -6.1908 | 0 | 0 |
| Multiple Linear Regression - Regression Statistics | |
| Multiple R | 0.713303306547448 |
| R-squared | 0.508801607131523 |
| Adjusted R-squared | 0.495525974891835 |
| F-TEST (value) | 38.3259793541448 |
| F-TEST (DF numerator) | 1 |
| F-TEST (DF denominator) | 37 |
| p-value | 3.46497637471188e-07 |
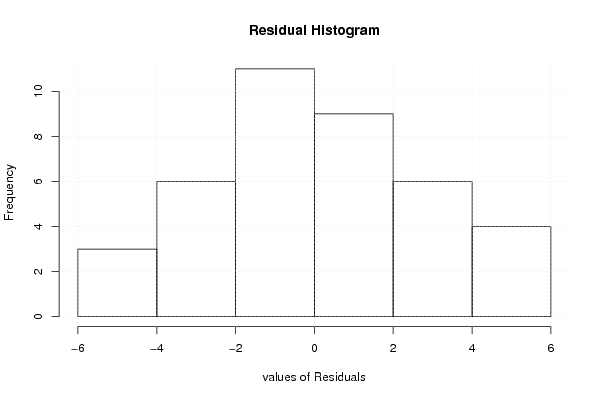
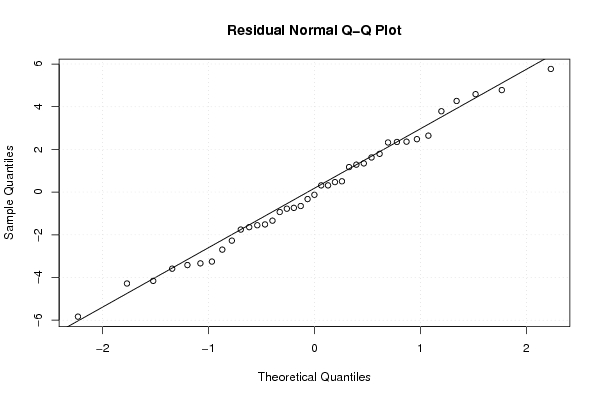
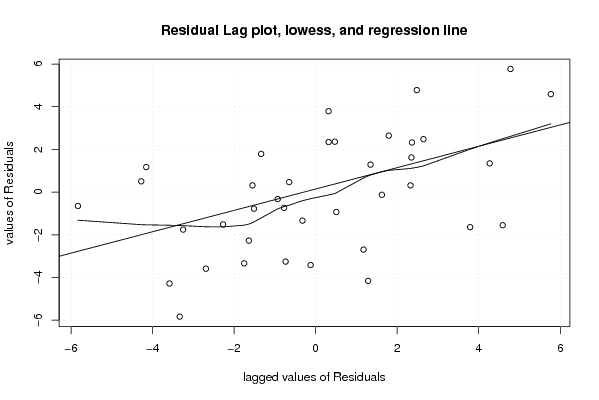
| Multiple Linear Regression - Residual Statistics | |
| Residual Standard Deviation | 2.8185432386865 |
| Sum Squared Residuals | 293.934881568779 |
| Multiple Linear Regression - Actuals, Interpolation, and Residuals | |||
| Time or Index | Actuals | Interpolation Forecast | Residuals Prediction Error |
| 1 | 6.3 | 9.71704929682467 | -3.41704929682467 |
| 2 | 2.1 | 2.22528072787545 | -0.125280727875454 |
| 3 | 9.1 | 7.47610972488091 | 1.62389027511909 |
| 4 | 15.8 | 13.4519485833976 | 2.34805141660243 |
| 5 | 5.2 | 4.88365022008324 | 0.316349779916759 |
| 6 | 10.9 | 8.57460951504941 | 2.32539048495059 |
| 7 | 8.3 | 5.938210018645 | 2.36178998135500 |
| 8 | 11 | 10.5299391415494 | 0.470060858450649 |
| 9 | 3.2 | 3.85106041732485 | -0.651060417324847 |
| 10 | 6.3 | 12.1337488351954 | -5.83374883519537 |
| 11 | 6.6 | 9.93674925485836 | -3.33674925485836 |
| 12 | 9.5 | 11.2549490030606 | -1.75494900306056 |
| 13 | 3.3 | 6.55336990113937 | -3.25336990113937 |
| 14 | 11 | 11.7382889107347 | -0.738288910734705 |
| 15 | 4.7 | 5.47684010677423 | -0.776840106774233 |
| 16 | 10.4 | 11.9140488771617 | -1.51404887716167 |
| 17 | 7.4 | 9.67310930521792 | -2.27310930521792 |
| 18 | 2.1 | 3.741210438308 | -1.64121043830800 |
| 19 | 17.9 | 14.1110484574987 | 3.78895154250133 |
| 20 | 6.1 | 5.78442004802141 | 0.315579951978585 |
| 21 | 11.9 | 13.4519485833976 | -1.55194858339757 |
| 22 | 13.8 | 9.21173939334715 | 4.58826060665285 |
| 23 | 14.3 | 8.53066952344268 | 5.76933047655733 |
| 24 | 15.2 | 10.4200891625325 | 4.7799108374675 |
| 25 | 10 | 7.52004971648765 | 2.47995028351235 |
| 26 | 11.9 | 9.25567938495389 | 2.64432061504611 |
| 27 | 6.5 | 4.70789025365628 | 1.79210974634372 |
| 28 | 7.5 | 8.83824946468986 | -1.33824946468985 |
| 29 | 10.6 | 10.9253990660100 | -0.325399066010013 |
| 30 | 7.4 | 8.33293956121234 | -0.932939561212343 |
| 31 | 8.4 | 7.89353964514494 | 0.506460354855059 |
| 32 | 5.7 | 9.9806892464651 | -4.2806892464651 |
| 33 | 4.9 | 8.48672953183593 | -3.58672953183593 |
| 34 | 3.2 | 5.89427002703826 | -2.69427002703826 |
| 35 | 11 | 9.8268992758415 | 1.17310072415849 |
| 36 | 4.9 | 9.05794942272356 | -4.15794942272356 |
| 37 | 13.2 | 11.9140488771617 | 1.28595112283833 |
| 38 | 9.7 | 8.35490955701571 | 1.34509044298429 |
| 39 | 12.8 | 8.53066952344268 | 4.26933047655733 |
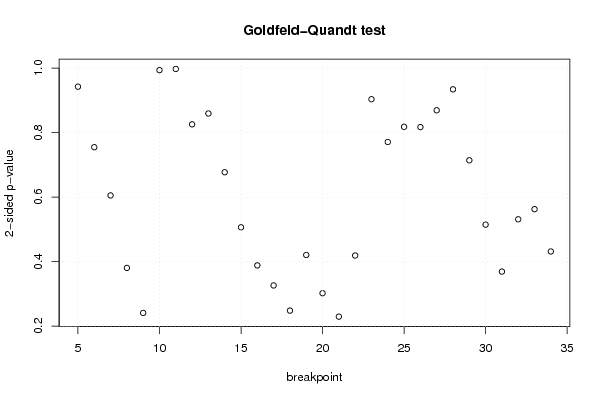
| Goldfeld-Quandt test for Heteroskedasticity | |||
| p-values | Alternative Hypothesis | ||
| breakpoint index | greater | 2-sided | less |
| 5 | 0.47110820066919 | 0.94221640133838 | 0.52889179933081 |
| 6 | 0.377311379876529 | 0.754622759753057 | 0.622688620123471 |
| 7 | 0.302553429447738 | 0.605106858895476 | 0.697446570552262 |
| 8 | 0.190267958335646 | 0.380535916671292 | 0.809732041664354 |
| 9 | 0.12042123042459 | 0.24084246084918 | 0.87957876957541 |
| 10 | 0.496777304806765 | 0.99355460961353 | 0.503222695193235 |
| 11 | 0.50142037927782 | 0.99715924144436 | 0.49857962072218 |
| 12 | 0.412756516127499 | 0.825513032254997 | 0.587243483872501 |
| 13 | 0.429507012508603 | 0.859014025017206 | 0.570492987491397 |
| 14 | 0.338486133810487 | 0.676972267620975 | 0.661513866189513 |
| 15 | 0.253168113128793 | 0.506336226257586 | 0.746831886871207 |
| 16 | 0.194159665798629 | 0.388319331597259 | 0.80584033420137 |
| 17 | 0.163088280116125 | 0.32617656023225 | 0.836911719883875 |
| 18 | 0.124060940928768 | 0.248121881857537 | 0.875939059071231 |
| 19 | 0.210274852619282 | 0.420549705238565 | 0.789725147380718 |
| 20 | 0.151004671474240 | 0.302009342948481 | 0.84899532852576 |
| 21 | 0.114694971827925 | 0.229389943655850 | 0.885305028172075 |
| 22 | 0.209453265058063 | 0.418906530116126 | 0.790546734941937 |
| 23 | 0.45164261266006 | 0.90328522532012 | 0.54835738733994 |
| 24 | 0.614597109682201 | 0.770805780635597 | 0.385402890317799 |
| 25 | 0.591079830567664 | 0.817840338864673 | 0.408920169432336 |
| 26 | 0.591567789603479 | 0.816864420793041 | 0.408432210396521 |
| 27 | 0.565484826311885 | 0.869030347376229 | 0.434515173688114 |
| 28 | 0.466980616060375 | 0.93396123212075 | 0.533019383939625 |
| 29 | 0.357000030233287 | 0.714000060466574 | 0.642999969766713 |
| 30 | 0.257271023309965 | 0.51454204661993 | 0.742728976690035 |
| 31 | 0.184536405565241 | 0.369072811130481 | 0.81546359443476 |
| 32 | 0.265589259255482 | 0.531178518510964 | 0.734410740744518 |
| 33 | 0.281284634050215 | 0.562569268100431 | 0.718715365949784 |
| 34 | 0.215726557869063 | 0.431453115738126 | 0.784273442130937 |
| Meta Analysis of Goldfeld-Quandt test for Heteroskedasticity | |||
| Description | # significant tests | % significant tests | OK/NOK |
| 1% type I error level | 0 | 0 | OK |
| 5% type I error level | 0 | 0 | OK |
| 10% type I error level | 0 | 0 | OK |