Free Statistics

of Irreproducible Research!

Author's title

Author*The author of this computation has been verified*
R Software Modulerwasp_bidensity.wasp
Title produced by softwareBivariate Kernel Density Estimation
Date of computationTue, 23 Mar 2010 16:03:38 +0000
Cite this page as followsStatistical Computations at FreeStatistics.org, Office for Research Development and Education, URL https://freestatistics.org/blog/index.php?v=date/2010/Mar/23/t1269361477q4v6nwm9lwib97g.htm/, Retrieved Tue, 19 Mar 2024 11:34:46 +0000
Statistical Computations at FreeStatistics.org, Office for Research Development and Education, URL https://freestatistics.org/blog/index.php?pk=74571, Retrieved Tue, 19 Mar 2024 11:34:46 +0000
QR Codes:

Original text written by user:
IsPrivate?No (this computation is public)
User-defined keywords
Estimated Impact239
Family? (F = Feedback message, R = changed R code, M = changed R Module, P = changed Parameters, D = changed Data)
-       [Bivariate Kernel Density Estimation] [] [2010-03-23 16:03:38] [d76b387543b13b5e3afd8ff9e5fdc89f] [Current]
Feedback Forum

Post a new message
Dataseries X:
88.6
71.6
93.3
84.3
80.6
75.2
69.7
82
69.4
83.3
79.6
82.6
80.6
83.5
76.3
Dataseries Y:
20
16
19.8
18.4
17.1
15.5
14.7
17.1
15.4
16.2
15
17.2
16
17
14.4


Summary of computational transaction
Raw Inputview raw input (R code)
Raw Outputview raw output of R engine
Computing time2 seconds
R Server'Gwilym Jenkins' @ 72.249.127.135

\begin{tabular}{lllllllll}
\hline
Summary of computational transaction \tabularnewline
Raw Input & view raw input (R code)  \tabularnewline
Raw Output & view raw output of R engine  \tabularnewline
Computing time & 2 seconds \tabularnewline
R Server & 'Gwilym Jenkins' @ 72.249.127.135 \tabularnewline
\hline
\end{tabular}
%Source: https://freestatistics.org/blog/index.php?pk=74571&T=0

[TABLE]
[ROW][C]Summary of computational transaction[/C][/ROW]
[ROW][C]Raw Input[/C][C]view raw input (R code) [/C][/ROW]
[ROW][C]Raw Output[/C][C]view raw output of R engine [/C][/ROW]
[ROW][C]Computing time[/C][C]2 seconds[/C][/ROW]
[ROW][C]R Server[/C][C]'Gwilym Jenkins' @ 72.249.127.135[/C][/ROW]
[/TABLE]
Source: https://freestatistics.org/blog/index.php?pk=74571&T=0

Globally Unique Identifier (entire table): ba.freestatistics.org/blog/index.php?pk=74571&T=0

As an alternative you can also use a QR Code:  

The GUIDs for individual cells are displayed in the table below:

Summary of computational transaction
Raw Inputview raw input (R code)
Raw Outputview raw output of R engine
Computing time2 seconds
R Server'Gwilym Jenkins' @ 72.249.127.135


Bandwidth
x axis2.85849531520302
y axis0.844180110906567
Correlation
correlation used in KDE0.835143786782374
correlation(x,y)0.835143786782374

\begin{tabular}{lllllllll}
\hline
Bandwidth \tabularnewline
x axis & 2.85849531520302 \tabularnewline
y axis & 0.844180110906567 \tabularnewline
Correlation \tabularnewline
correlation used in KDE & 0.835143786782374 \tabularnewline
correlation(x,y) & 0.835143786782374 \tabularnewline
\hline
\end{tabular}
%Source: https://freestatistics.org/blog/index.php?pk=74571&T=1

[TABLE]
[ROW][C]Bandwidth[/C][/ROW]
[ROW][C]x axis[/C][C]2.85849531520302[/C][/ROW]
[ROW][C]y axis[/C][C]0.844180110906567[/C][/ROW]
[ROW][C]Correlation[/C][/ROW]
[ROW][C]correlation used in KDE[/C][C]0.835143786782374[/C][/ROW]
[ROW][C]correlation(x,y)[/C][C]0.835143786782374[/C][/ROW]
[/TABLE]
Source: https://freestatistics.org/blog/index.php?pk=74571&T=1

Globally Unique Identifier (entire table): ba.freestatistics.org/blog/index.php?pk=74571&T=1

As an alternative you can also use a QR Code:  

The GUIDs for individual cells are displayed in the table below:

Bandwidth
x axis2.85849531520302
y axis0.844180110906567
Correlation
correlation used in KDE0.835143786782374
correlation(x,y)0.835143786782374


Parameters (Session):
par1 = 50 ; par2 = 50 ; par3 = 0 ; par4 = 0 ; par5 = 0 ; par6 = Y ; par7 = Y ;
Parameters (R input):
par1 = 50 ; par2 = 50 ; par3 = 0 ; par4 = 0 ; par5 = 0 ; par6 = Y ; par7 = Y ;
R code (references can be found in the software module):
par1 <- as(par1,'numeric')
par2 <- as(par2,'numeric')
par3 <- as(par3,'numeric')
par4 <- as(par4,'numeric')
par5 <- as(par5,'numeric')
library('GenKern')
if (par3==0) par3 <- dpik(x)
if (par4==0) par4 <- dpik(y)
if (par5==0) par5 <- cor(x,y)
if (par1 > 500) par1 <- 500
if (par2 > 500) par2 <- 500
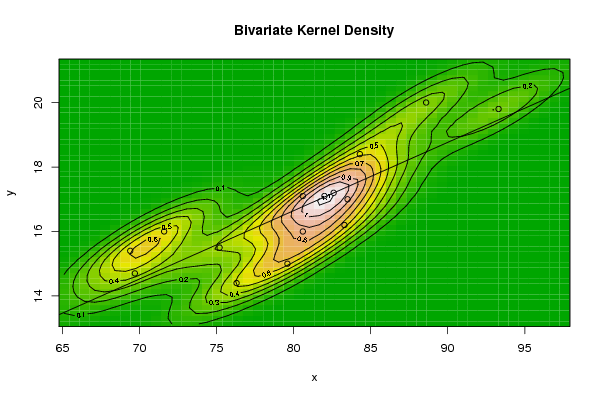
bitmap(file='bidensity.png')
op <- KernSur(x,y, xgridsize=par1, ygridsize=par2, correlation=par5, xbandwidth=par3, ybandwidth=par4)
image(op$xords, op$yords, op$zden, col=terrain.colors(100), axes=TRUE,main=main,xlab=xlab,ylab=ylab)
if (par6=='Y') contour(op$xords, op$yords, op$zden, add=TRUE)
if (par7=='Y') points(x,y)
(r<-lm(y ~ x))
abline(r)
box()
dev.off()
load(file='createtable')
a<-table.start()
a<-table.row.start(a)
a<-table.element(a,'Bandwidth',2,TRUE)
a<-table.row.end(a)
a<-table.row.start(a)
a<-table.element(a,'x axis',header=TRUE)
a<-table.element(a,par3)
a<-table.row.end(a)
a<-table.row.start(a)
a<-table.element(a,'y axis',header=TRUE)
a<-table.element(a,par4)
a<-table.row.end(a)
a<-table.row.start(a)
a<-table.element(a,'Correlation',2,TRUE)
a<-table.row.end(a)
a<-table.row.start(a)
a<-table.element(a,'correlation used in KDE',header=TRUE)
a<-table.element(a,par5)
a<-table.row.end(a)
a<-table.row.start(a)
a<-table.element(a,'correlation(x,y)',header=TRUE)
a<-table.element(a,cor(x,y))
a<-table.row.end(a)
a<-table.end(a)
table.save(a,file='mytable.tab')