| Multiple Linear Regression - Estimated Regression Equation |
| logPS[t] = + 1.07450734042495 -0.110510499814237D[t] -0.303538868483004logtg[t] + e[t] |
| Multiple Linear Regression - Ordinary Least Squares | |||||
| Variable | Parameter | S.D. | T-STAT H0: parameter = 0 | 2-tail p-value | 1-tail p-value |
| (Intercept) | 1.07450734042495 | 0.128751 | 8.3456 | 0 | 0 |
| D | -0.110510499814237 | 0.022191 | -4.98 | 1.6e-05 | 8e-06 |
| logtg | -0.303538868483004 | 0.068904 | -4.4053 | 9.1e-05 | 4.5e-05 |
| Multiple Linear Regression - Regression Statistics | |
| Multiple R | 0.809091683132234 |
| R-squared | 0.654629351713752 |
| Adjusted R-squared | 0.635442093475627 |
| F-TEST (value) | 34.1179205277495 |
| F-TEST (DF numerator) | 2 |
| F-TEST (DF denominator) | 36 |
| p-value | 4.88807283538506e-09 |
| Multiple Linear Regression - Residual Statistics | |
| Residual Standard Deviation | 0.181764010644749 |
| Sum Squared Residuals | 1.18937360036392 |
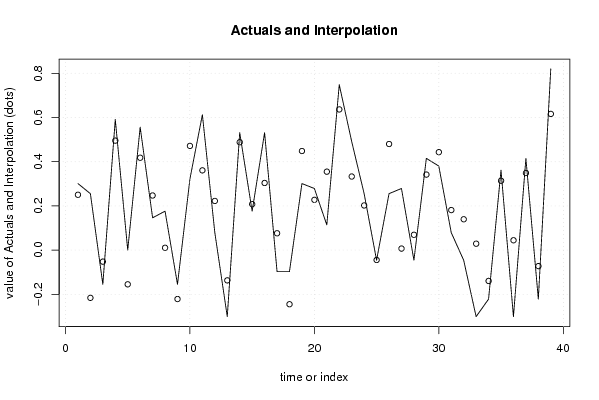
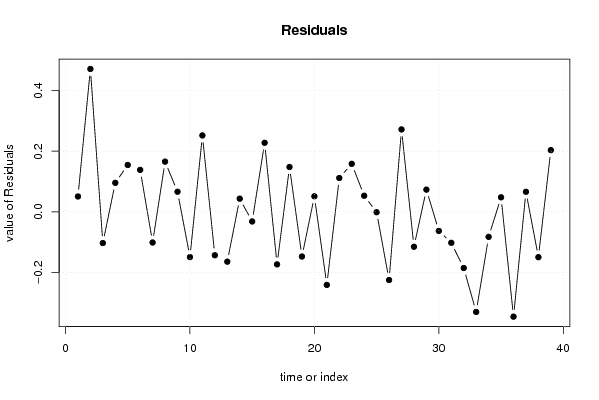
| Multiple Linear Regression - Actuals, Interpolation, and Residuals | |||
| Time or Index | Actuals | Interpolation Forecast | Residuals Prediction Error |
| 1 | 0.30102999566398 | 0.250256588109025 | 0.0507734075549551 |
| 2 | 0.25527250510331 | -0.215981826385327 | 0.471254331488637 |
| 3 | -0.15490195998574 | -0.0520975231518843 | -0.102804436833856 |
| 4 | 0.5910646070265 | 0.495312173567866 | 0.0957524334586344 |
| 5 | 0 | -0.154697777268126 | 0.154697777268126 |
| 6 | 0.55630250076729 | 0.417827046213988 | 0.138475454553302 |
| 7 | 0.14612803567824 | 0.247120645601122 | -0.100992609922882 |
| 8 | 0.17609125905568 | 0.0104480212917185 | 0.165643237763961 |
| 9 | -0.15490195998574 | -0.221322704237402 | 0.0664207442516616 |
| 10 | 0.32221929473392 | 0.471277587737497 | -0.149058293003577 |
| 11 | 0.61278385671974 | 0.36076708792326 | 0.252016768796480 |
| 12 | 0.079181246047625 | 0.222374018000101 | -0.143192771952476 |
| 13 | -0.30102999566398 | -0.136803944049202 | -0.164226051614778 |
| 14 | 0.53147891704226 | 0.487989123743325 | 0.0434897932989351 |
| 15 | 0.17609125905568 | 0.207771731082360 | -0.0316804720266803 |
| 16 | 0.53147891704226 | 0.303707129632531 | 0.227771787409729 |
| 17 | -0.096910013008056 | 0.0762276593201318 | -0.173137672328188 |
| 18 | -0.096910013008056 | -0.244887324309315 | 0.147977311301259 |
| 19 | 0.30102999566398 | 0.448293407907994 | -0.147263412244015 |
| 20 | 0.27875360095283 | 0.227456357974843 | 0.0512972429779865 |
| 21 | 0.11394335230684 | 0.354824419880452 | -0.240881067573612 |
| 22 | 0.7481880270062 | 0.636423386297341 | 0.111764640708859 |
| 23 | 0.49136169383427 | 0.332884517814338 | 0.158477176019932 |
| 24 | 0.25527250510331 | 0.202053065227053 | 0.0532194398762572 |
| 25 | -0.045757490560675 | -0.0445626006362929 | -0.00119488992438214 |
| 26 | 0.25527250510331 | 0.479997267475184 | -0.224724762371874 |
| 27 | 0.27875360095283 | 0.0069634504216991 | 0.271790150531131 |
| 28 | -0.045757490560675 | 0.0692686003084161 | -0.115026090869091 |
| 29 | 0.41497334797082 | 0.341630892372311 | 0.0733424555985092 |
| 30 | 0.38021124171161 | 0.443123127370756 | -0.0629118856591458 |
| 31 | 0.079181246047625 | 0.181195145293536 | -0.102013899245911 |
| 32 | -0.045757490560675 | 0.139507520783453 | -0.185265011344128 |
| 33 | -0.30102999566398 | 0.0289970209692157 | -0.330027016633196 |
| 34 | -0.22184874961636 | -0.139449355678152 | -0.082399393938208 |
| 35 | 0.36172783601759 | 0.313748322263389 | 0.0479795137542013 |
| 36 | -0.30102999566398 | 0.044523799752945 | -0.345553795416925 |
| 37 | 0.41497334797082 | 0.348774710006600 | 0.0661986379642195 |
| 38 | -0.22184874961636 | -0.0724184759249296 | -0.149430273691430 |
| 39 | 0.81954393554187 | 0.616102433524293 | 0.203441502017577 |
| Goldfeld-Quandt test for Heteroskedasticity | |||
| p-values | Alternative Hypothesis | ||
| breakpoint index | greater | 2-sided | less |
| 6 | 0.597928969573807 | 0.804142060852385 | 0.402071030426193 |
| 7 | 0.805814977507914 | 0.388370044984172 | 0.194185022492086 |
| 8 | 0.720981818694391 | 0.558036362611218 | 0.279018181305609 |
| 9 | 0.649764792858961 | 0.700470414282079 | 0.350235207141039 |
| 10 | 0.613004805277026 | 0.773990389445949 | 0.386995194722974 |
| 11 | 0.690107188097561 | 0.619785623804878 | 0.309892811902439 |
| 12 | 0.691199655958227 | 0.617600688083546 | 0.308800344041773 |
| 13 | 0.737898423674942 | 0.524203152650117 | 0.262101576325058 |
| 14 | 0.65177309604783 | 0.69645380790434 | 0.34822690395217 |
| 15 | 0.566642974519511 | 0.866714050960978 | 0.433357025480489 |
| 16 | 0.594689072319513 | 0.810621855360974 | 0.405310927680487 |
| 17 | 0.610880146167736 | 0.778239707664528 | 0.389119853832264 |
| 18 | 0.613441083996051 | 0.773117832007898 | 0.386558916003949 |
| 19 | 0.589205364713037 | 0.821589270573926 | 0.410794635286963 |
| 20 | 0.503427823550471 | 0.993144352899058 | 0.496572176449529 |
| 21 | 0.59140003064352 | 0.81719993871296 | 0.40859996935648 |
| 22 | 0.52628088780652 | 0.94743822438696 | 0.47371911219348 |
| 23 | 0.534351614657273 | 0.931296770685453 | 0.465648385342727 |
| 24 | 0.482913739935625 | 0.96582747987125 | 0.517086260064375 |
| 25 | 0.414301128450386 | 0.828602256900773 | 0.585698871549614 |
| 26 | 0.602854839068517 | 0.794290321862966 | 0.397145160931483 |
| 27 | 0.960558244180002 | 0.0788835116399955 | 0.0394417558199978 |
| 28 | 0.970552683437971 | 0.0588946331240572 | 0.0294473165620286 |
| 29 | 0.961721815063129 | 0.076556369873742 | 0.038278184936871 |
| 30 | 0.932745485002611 | 0.134509029994778 | 0.0672545149973888 |
| 31 | 0.91360527313847 | 0.17278945372306 | 0.0863947268615299 |
| 32 | 0.936353640760048 | 0.127292718479903 | 0.0636463592399516 |
| 33 | 0.880356992568807 | 0.239286014862387 | 0.119643007431193 |
| Meta Analysis of Goldfeld-Quandt test for Heteroskedasticity | |||
| Description | # significant tests | % significant tests | OK/NOK |
| 1% type I error level | 0 | 0 | OK |
| 5% type I error level | 0 | 0 | OK |
| 10% type I error level | 3 | 0.107142857142857 | NOK |