| Multiple Linear Regression - Estimated Regression Equation |
| SWS[t] = + 11.6923070380679 -1.81283463836901logWb[t] -0.805866957739349D[t] + e[t] |
| Multiple Linear Regression - Ordinary Least Squares | |||||
| Variable | Parameter | S.D. | T-STAT H0: parameter = 0 | 2-tail p-value | 1-tail p-value |
| (Intercept) | 11.6923070380679 | 0.93927 | 12.4483 | 0 | 0 |
| logWb | -1.81283463836901 | 0.370561 | -4.8921 | 2.1e-05 | 1e-05 |
| D | -0.805866957739349 | 0.336075 | -2.3979 | 0.0218 | 0.0109 |
| Multiple Linear Regression - Regression Statistics | |
| Multiple R | 0.758888821534529 |
| R-squared | 0.575912243450066 |
| Adjusted R-squared | 0.552351812530625 |
| F-TEST (value) | 24.4440454174739 |
| F-TEST (DF numerator) | 2 |
| F-TEST (DF denominator) | 36 |
| p-value | 1.96880734715243e-07 |
| Multiple Linear Regression - Residual Statistics | |
| Residual Standard Deviation | 2.6550561611856 |
| Sum Squared Residuals | 253.775635885786 |
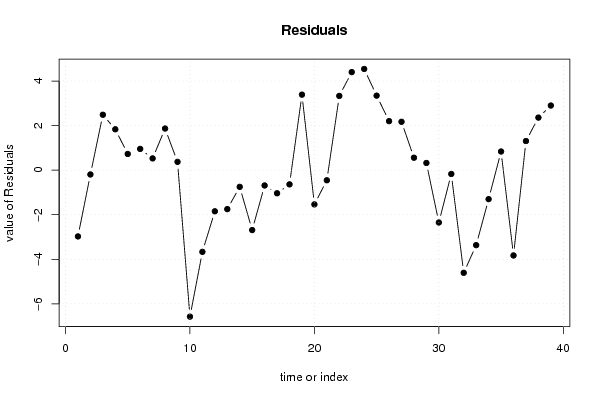
| Multiple Linear Regression - Actuals, Interpolation, and Residuals | |||
| Time or Index | Actuals | Interpolation Forecast | Residuals Prediction Error |
| 1 | 6.3 | 9.27470616484984 | -2.97470616484984 |
| 2 | 2.1 | 2.29427195639296 | -0.194271956392962 |
| 3 | 9.1 | 6.6138517044902 | 2.48614829550980 |
| 4 | 15.8 | 13.9663917537388 | 1.83360824626119 |
| 5 | 5.2 | 4.47313415543052 | 0.726865844569485 |
| 6 | 10.9 | 9.9464600496407 | 0.953539950359305 |
| 7 | 8.3 | 7.7731910245938 | 0.526808975406202 |
| 8 | 11 | 9.13330028689069 | 1.86669971310931 |
| 9 | 3.2 | 2.82732114015252 | 0.372678859847483 |
| 10 | 6.3 | 12.8749565470833 | -6.57495654708334 |
| 11 | 6.6 | 10.2661582775285 | -3.66615827752845 |
| 12 | 9.5 | 11.3476901576304 | -1.84769015763045 |
| 13 | 3.3 | 5.04913268172158 | -1.74913268172158 |
| 14 | 11 | 11.7498652554138 | -0.749865255413841 |
| 15 | 4.7 | 7.38872261986893 | -2.68872261986893 |
| 16 | 10.4 | 11.0875408032188 | -0.687540803218838 |
| 17 | 7.4 | 8.43796057962255 | -1.03796057962255 |
| 18 | 2.1 | 2.73779471774615 | -0.637794717746149 |
| 19 | 17.9 | 14.5121093570665 | 3.38789064293345 |
| 20 | 6.1 | 7.63713034008134 | -1.53713034008134 |
| 21 | 11.9 | 12.3546578382601 | -0.454657838260114 |
| 22 | 13.8 | 10.4686742932792 | 3.33132570672078 |
| 23 | 14.3 | 9.90013468390065 | 4.39986531609935 |
| 24 | 15.2 | 10.6584300487583 | 4.54156995124165 |
| 25 | 10 | 6.65600456874146 | 3.34399543125854 |
| 26 | 11.9 | 9.7007570469679 | 2.19924295303209 |
| 27 | 6.5 | 4.32959164988615 | 2.17040835011385 |
| 28 | 7.5 | 6.94157281765759 | 0.558427182342413 |
| 29 | 10.6 | 10.2769172351768 | 0.323082764823235 |
| 30 | 7.4 | 9.74912952456717 | -2.34912952456717 |
| 31 | 8.4 | 8.57137212888438 | -0.171372128884376 |
| 32 | 5.7 | 10.3070663919868 | -4.60706639198676 |
| 33 | 4.9 | 8.26622172204758 | -3.36622172204758 |
| 34 | 3.2 | 4.50085751010232 | -1.30085751010232 |
| 35 | 11 | 10.1635238864424 | 0.836476113557592 |
| 36 | 4.9 | 8.72898856152209 | -3.82898856152209 |
| 37 | 13.2 | 11.8934077609582 | 1.30659223904181 |
| 38 | 9.7 | 7.34086807379823 | 2.35913192620177 |
| 39 | 12.8 | 9.90013468390065 | 2.89986531609935 |
| Goldfeld-Quandt test for Heteroskedasticity | |||
| p-values | Alternative Hypothesis | ||
| breakpoint index | greater | 2-sided | less |
| 6 | 0.483278401155496 | 0.966556802310993 | 0.516721598844504 |
| 7 | 0.310376278351399 | 0.620752556702798 | 0.689623721648601 |
| 8 | 0.209838464165367 | 0.419676928330735 | 0.790161535834633 |
| 9 | 0.117238669349823 | 0.234477338699645 | 0.882761330650177 |
| 10 | 0.675519214784656 | 0.648961570430688 | 0.324480785215344 |
| 11 | 0.704608156419159 | 0.590783687161683 | 0.295391843580841 |
| 12 | 0.62898550598674 | 0.742028988026521 | 0.371014494013260 |
| 13 | 0.573723728899977 | 0.852552542200046 | 0.426276271100023 |
| 14 | 0.480818672927708 | 0.961637345855416 | 0.519181327072292 |
| 15 | 0.453244901738468 | 0.906489803476937 | 0.546755098261531 |
| 16 | 0.360271600233484 | 0.720543200466968 | 0.639728399766516 |
| 17 | 0.280054237245838 | 0.560108474491675 | 0.719945762754162 |
| 18 | 0.206973837265831 | 0.413947674531662 | 0.793026162734169 |
| 19 | 0.298620652888492 | 0.597241305776984 | 0.701379347111508 |
| 20 | 0.255831554043963 | 0.511663108087927 | 0.744168445956037 |
| 21 | 0.182056368011516 | 0.364112736023031 | 0.817943631988484 |
| 22 | 0.222125711731406 | 0.444251423462813 | 0.777874288268594 |
| 23 | 0.334729381257599 | 0.669458762515197 | 0.665270618742401 |
| 24 | 0.499751729400278 | 0.999503458800557 | 0.500248270599722 |
| 25 | 0.536381234659683 | 0.927237530680634 | 0.463618765340317 |
| 26 | 0.510388773516605 | 0.97922245296679 | 0.489611226483395 |
| 27 | 0.488430277348648 | 0.976860554697295 | 0.511569722651352 |
| 28 | 0.388692567033867 | 0.777385134067734 | 0.611307432966133 |
| 29 | 0.287076765595162 | 0.574153531190324 | 0.712923234404838 |
| 30 | 0.245799726821700 | 0.491599453643399 | 0.7542002731783 |
| 31 | 0.154256216389745 | 0.308512432779489 | 0.845743783610255 |
| 32 | 0.292404694443035 | 0.58480938888607 | 0.707595305556965 |
| 33 | 0.332344452425508 | 0.664688904851016 | 0.667655547574492 |
| Meta Analysis of Goldfeld-Quandt test for Heteroskedasticity | |||
| Description | # significant tests | % significant tests | OK/NOK |
| 1% type I error level | 0 | 0 | OK |
| 5% type I error level | 0 | 0 | OK |
| 10% type I error level | 0 | 0 | OK |