Free Statistics

of Irreproducible Research!

Author's title

Author*Unverified author*
R Software Modulerwasp_correlation.wasp
Title produced by softwarePearson Correlation
Date of computationFri, 25 Jun 2010 12:48:01 +0000
Cite this page as followsStatistical Computations at FreeStatistics.org, Office for Research Development and Education, URL https://freestatistics.org/blog/index.php?v=date/2010/Jun/25/t1277470210he9cuw78n6teek8.htm/, Retrieved Sat, 04 May 2024 00:47:11 +0000
Statistical Computations at FreeStatistics.org, Office for Research Development and Education, URL https://freestatistics.org/blog/index.php?pk=77875, Retrieved Sat, 04 May 2024 00:47:11 +0000
QR Codes:

Original text written by user:
IsPrivate?No (this computation is public)
User-defined keywords
Estimated Impact264
Family? (F = Feedback message, R = changed R code, M = changed R Module, P = changed Parameters, D = changed Data)
-       [Pearson Correlation] [Coommassie vs DAB...] [2010-06-25 12:48:01] [d41d8cd98f00b204e9800998ecf8427e] [Current]
Feedback Forum

Post a new message
Dataseries X:
3861
5418
6698
7074
8242
5298
6392
7325
6271
9224
3491
5019
5618
5521
5941
4384
5065
5488
5761
4982
2115
3441
3968
4604
5259
3564
4072
4110
4174
3850
4021
7446
9376
11795
13147
14020
15899
14351
16485
17042
1044
4285
5285
4272
5569
4779
6575
7216
7667
5716
Dataseries Y:
4544
4643
4744
5141
5892
5437
6675
7217
7068
7057
5171
5566
4959
5138
5087
4601
5346
5429
6688
5870
2827
2935
3664
3443
3416
3741
4686
4487
4502
4237
6646
8790
10094
11452
12029
8727
10636
12311
12357
12990
2334
4846
6522
7471
8624
6431
7902
11148
11301
11956


Summary of computational transaction
Raw Inputview raw input (R code)
Raw Outputview raw output of R engine
Computing time1 seconds
R Server'Sir Ronald Aylmer Fisher' @ 193.190.124.24

\begin{tabular}{lllllllll}
\hline
Summary of computational transaction \tabularnewline
Raw Input & view raw input (R code)  \tabularnewline
Raw Output & view raw output of R engine  \tabularnewline
Computing time & 1 seconds \tabularnewline
R Server & 'Sir Ronald Aylmer Fisher' @ 193.190.124.24 \tabularnewline
\hline
\end{tabular}
%Source: https://freestatistics.org/blog/index.php?pk=77875&T=0

[TABLE]
[ROW][C]Summary of computational transaction[/C][/ROW]
[ROW][C]Raw Input[/C][C]view raw input (R code) [/C][/ROW]
[ROW][C]Raw Output[/C][C]view raw output of R engine [/C][/ROW]
[ROW][C]Computing time[/C][C]1 seconds[/C][/ROW]
[ROW][C]R Server[/C][C]'Sir Ronald Aylmer Fisher' @ 193.190.124.24[/C][/ROW]
[/TABLE]
Source: https://freestatistics.org/blog/index.php?pk=77875&T=0

Globally Unique Identifier (entire table): ba.freestatistics.org/blog/index.php?pk=77875&T=0

As an alternative you can also use a QR Code:  

The GUIDs for individual cells are displayed in the table below:

Summary of computational transaction
Raw Inputview raw input (R code)
Raw Outputview raw output of R engine
Computing time1 seconds
R Server'Sir Ronald Aylmer Fisher' @ 193.190.124.24


Pearson Product Moment Correlation - Ungrouped Data
StatisticVariable XVariable Y
Mean6644.46695.56
Biased Variance13378754.568259795.4864
Biased Standard Deviation3657.697986439012873.98599272857
Covariance8681319.52653061
Correlation0.809318236594543
Determination0.6549960080845
T-Test9.54614188848225
p-value (2 sided)1.13309361893243e-12
p-value (1 sided)5.66546809466217e-13
Degrees of Freedom48
Number of Observations50

\begin{tabular}{lllllllll}
\hline
Pearson Product Moment Correlation - Ungrouped Data \tabularnewline
Statistic & Variable X & Variable Y \tabularnewline
Mean & 6644.4 & 6695.56 \tabularnewline
Biased Variance & 13378754.56 & 8259795.4864 \tabularnewline
Biased Standard Deviation & 3657.69798643901 & 2873.98599272857 \tabularnewline
Covariance & 8681319.52653061 \tabularnewline
Correlation & 0.809318236594543 \tabularnewline
Determination & 0.6549960080845 \tabularnewline
T-Test & 9.54614188848225 \tabularnewline
p-value (2 sided) & 1.13309361893243e-12 \tabularnewline
p-value (1 sided) & 5.66546809466217e-13 \tabularnewline
Degrees of Freedom & 48 \tabularnewline
Number of Observations & 50 \tabularnewline
\hline
\end{tabular}
%Source: https://freestatistics.org/blog/index.php?pk=77875&T=1

[TABLE]
[ROW][C]Pearson Product Moment Correlation - Ungrouped Data[/C][/ROW]
[ROW][C]Statistic[/C][C]Variable X[/C][C]Variable Y[/C][/ROW]
[ROW][C]Mean[/C][C]6644.4[/C][C]6695.56[/C][/ROW]
[ROW][C]Biased Variance[/C][C]13378754.56[/C][C]8259795.4864[/C][/ROW]
[ROW][C]Biased Standard Deviation[/C][C]3657.69798643901[/C][C]2873.98599272857[/C][/ROW]
[ROW][C]Covariance[/C][C]8681319.52653061[/C][/ROW]
[ROW][C]Correlation[/C][C]0.809318236594543[/C][/ROW]
[ROW][C]Determination[/C][C]0.6549960080845[/C][/ROW]
[ROW][C]T-Test[/C][C]9.54614188848225[/C][/ROW]
[ROW][C]p-value (2 sided)[/C][C]1.13309361893243e-12[/C][/ROW]
[ROW][C]p-value (1 sided)[/C][C]5.66546809466217e-13[/C][/ROW]
[ROW][C]Degrees of Freedom[/C][C]48[/C][/ROW]
[ROW][C]Number of Observations[/C][C]50[/C][/ROW]
[/TABLE]
Source: https://freestatistics.org/blog/index.php?pk=77875&T=1

Globally Unique Identifier (entire table): ba.freestatistics.org/blog/index.php?pk=77875&T=1

As an alternative you can also use a QR Code:  

The GUIDs for individual cells are displayed in the table below:

Pearson Product Moment Correlation - Ungrouped Data
StatisticVariable XVariable Y
Mean6644.46695.56
Biased Variance13378754.568259795.4864
Biased Standard Deviation3657.697986439012873.98599272857
Covariance8681319.52653061
Correlation0.809318236594543
Determination0.6549960080845
T-Test9.54614188848225
p-value (2 sided)1.13309361893243e-12
p-value (1 sided)5.66546809466217e-13
Degrees of Freedom48
Number of Observations50


Parameters (Session):
Parameters (R input):
R code (references can be found in the software module):
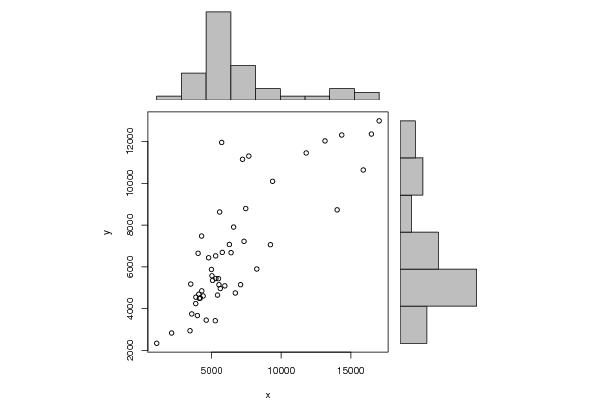
bitmap(file='test1.png')
histx <- hist(x, plot=FALSE)
histy <- hist(y, plot=FALSE)
maxcounts <- max(c(histx$counts, histx$counts))
xrange <- c(min(x),max(x))
yrange <- c(min(y),max(y))
nf <- layout(matrix(c(2,0,1,3),2,2,byrow=TRUE), c(3,1), c(1,3), TRUE)
par(mar=c(4,4,1,1))
plot(x, y, xlim=xrange, ylim=yrange, xlab=xlab, ylab=ylab)
par(mar=c(0,4,1,1))
barplot(histx$counts, axes=FALSE, ylim=c(0, maxcounts), space=0)
par(mar=c(4,0,1,1))
barplot(histy$counts, axes=FALSE, xlim=c(0, maxcounts), space=0, horiz=TRUE)
dev.off()
lx = length(x)
makebiased = (lx-1)/lx
varx = var(x)*makebiased
vary = var(y)*makebiased
corxy <- cor.test(x,y,method='pearson')
cxy <- as.matrix(corxy$estimate)[1,1]
load(file='createtable')
a<-table.start()
a<-table.row.start(a)
a<-table.element(a,'Pearson Product Moment Correlation - Ungrouped Data',3,TRUE)
a<-table.row.end(a)
a<-table.row.start(a)
a<-table.element(a,'Statistic',1,TRUE)
a<-table.element(a,'Variable X',1,TRUE)
a<-table.element(a,'Variable Y',1,TRUE)
a<-table.row.end(a)
a<-table.row.start(a)
a<-table.element(a,hyperlink('arithmetic_mean.htm','Mean',''),header=TRUE)
a<-table.element(a,mean(x))
a<-table.element(a,mean(y))
a<-table.row.end(a)
a<-table.row.start(a)
a<-table.element(a,hyperlink('biased.htm','Biased Variance',''),header=TRUE)
a<-table.element(a,varx)
a<-table.element(a,vary)
a<-table.row.end(a)
a<-table.row.start(a)
a<-table.element(a,hyperlink('biased1.htm','Biased Standard Deviation',''),header=TRUE)
a<-table.element(a,sqrt(varx))
a<-table.element(a,sqrt(vary))
a<-table.row.end(a)
a<-table.row.start(a)
a<-table.element(a,hyperlink('covariance.htm','Covariance',''),header=TRUE)
a<-table.element(a,cov(x,y),2)
a<-table.row.end(a)
a<-table.row.start(a)
a<-table.element(a,hyperlink('pearson_correlation.htm','Correlation',''),header=TRUE)
a<-table.element(a,cxy,2)
a<-table.row.end(a)
a<-table.row.start(a)
a<-table.element(a,hyperlink('coeff_of_determination.htm','Determination',''),header=TRUE)
a<-table.element(a,cxy*cxy,2)
a<-table.row.end(a)
a<-table.row.start(a)
a<-table.element(a,hyperlink('ttest_statistic.htm','T-Test',''),header=TRUE)
a<-table.element(a,as.matrix(corxy$statistic)[1,1],2)
a<-table.row.end(a)
a<-table.row.start(a)
a<-table.element(a,'p-value (2 sided)',header=TRUE)
a<-table.element(a,(p2 <- as.matrix(corxy$p.value)[1,1]),2)
a<-table.row.end(a)
a<-table.row.start(a)
a<-table.element(a,'p-value (1 sided)',header=TRUE)
a<-table.element(a,p2/2,2)
a<-table.row.end(a)
a<-table.row.start(a)
a<-table.element(a,'Degrees of Freedom',header=TRUE)
a<-table.element(a,lx-2,2)
a<-table.row.end(a)
a<-table.row.start(a)
a<-table.element(a,'Number of Observations',header=TRUE)
a<-table.element(a,lx,2)
a<-table.row.end(a)
a<-table.end(a)
table.save(a,file='mytable.tab')