Free Statistics

of Irreproducible Research!

Author's title

Author*Unverified author*
R Software Modulerwasp_smp.wasp
Title produced by softwareStandard Deviation-Mean Plot
Date of computationThu, 29 Jul 2010 13:44:36 +0000
Cite this page as followsStatistical Computations at FreeStatistics.org, Office for Research Development and Education, URL https://freestatistics.org/blog/index.php?v=date/2010/Jul/29/t1280411117n6upilmipg69bjq.htm/, Retrieved Sun, 28 Apr 2024 23:45:18 +0000
Statistical Computations at FreeStatistics.org, Office for Research Development and Education, URL https://freestatistics.org/blog/index.php?pk=78183, Retrieved Sun, 28 Apr 2024 23:45:18 +0000
QR Codes:

Original text written by user:
IsPrivate?No (this computation is public)
User-defined keywordsHoes Isabelle
Estimated Impact180
Family? (F = Feedback message, R = changed R code, M = changed R Module, P = changed Parameters, D = changed Data)
-       [Standard Deviation-Mean Plot] [TIJDREEKS B - STA...] [2010-07-29 13:44:36] [35611de12c9fa8a4a915f3548e0dcd01] [Current]
Feedback Forum

Post a new message
Dataseries X:
158
157
156
154
152
151
152
154
155
155
156
158
156
152
145
141
140
145
143
141
144
139
141
142
141
132
122
122
127
128
122
123
128
128
128
129
124
121
109
110
107
107
104
110
114
118
117
122
113
106
102
111
106
110
105
104
106
110
107
111
101
105
108
124
122
128
124
121
125
134
126
126
111
117
118
128
127
129
124
113
120
127
114
107


Summary of computational transaction
Raw Inputview raw input (R code)
Raw Outputview raw output of R engine
Computing time1 seconds
R Server'Gwilym Jenkins' @ 72.249.127.135

\begin{tabular}{lllllllll}
\hline
Summary of computational transaction \tabularnewline
Raw Input & view raw input (R code)  \tabularnewline
Raw Output & view raw output of R engine  \tabularnewline
Computing time & 1 seconds \tabularnewline
R Server & 'Gwilym Jenkins' @ 72.249.127.135 \tabularnewline
\hline
\end{tabular}
%Source: https://freestatistics.org/blog/index.php?pk=78183&T=0

[TABLE]
[ROW][C]Summary of computational transaction[/C][/ROW]
[ROW][C]Raw Input[/C][C]view raw input (R code) [/C][/ROW]
[ROW][C]Raw Output[/C][C]view raw output of R engine [/C][/ROW]
[ROW][C]Computing time[/C][C]1 seconds[/C][/ROW]
[ROW][C]R Server[/C][C]'Gwilym Jenkins' @ 72.249.127.135[/C][/ROW]
[/TABLE]
Source: https://freestatistics.org/blog/index.php?pk=78183&T=0

Globally Unique Identifier (entire table): ba.freestatistics.org/blog/index.php?pk=78183&T=0

As an alternative you can also use a QR Code:  

The GUIDs for individual cells are displayed in the table below:

Summary of computational transaction
Raw Inputview raw input (R code)
Raw Outputview raw output of R engine
Computing time1 seconds
R Server'Gwilym Jenkins' @ 72.249.127.135


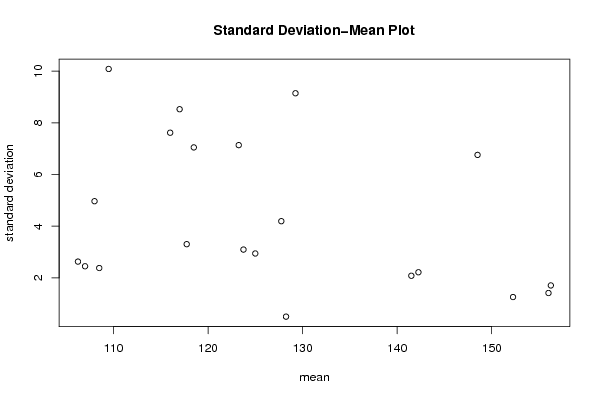
Standard Deviation-Mean Plot
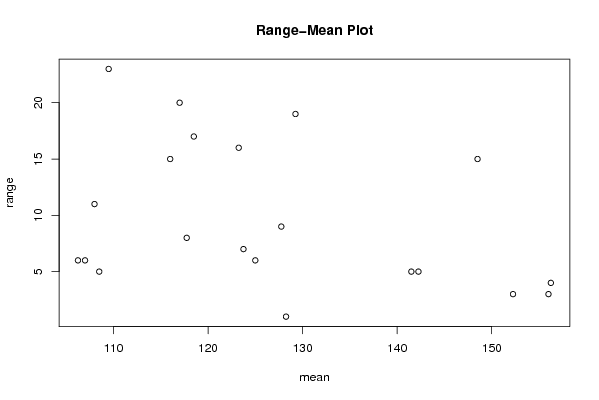
SectionMeanStandard DeviationRange
1156.251.707825127659934
2152.251.258305739211793
31561.414213562373103
4148.56.7577116442377615
5142.252.217355782608355
6141.52.081665999466135
7129.259.1423921012683219
81252.943920288775956
9128.250.51
101167.6157731058639115
111072.449489742783186
12117.753.304037933599838
131084.9665548085837811
14106.252.629955639676586
15108.52.380476142847625
16109.510.082988974836123
17123.753.095695936834457
18127.754.193248541803049
19118.57.0474581706219917
20123.257.1355915428692216
211178.5244745683629520

\begin{tabular}{lllllllll}
\hline
Standard Deviation-Mean Plot \tabularnewline
Section & Mean & Standard Deviation & Range \tabularnewline
1 & 156.25 & 1.70782512765993 & 4 \tabularnewline
2 & 152.25 & 1.25830573921179 & 3 \tabularnewline
3 & 156 & 1.41421356237310 & 3 \tabularnewline
4 & 148.5 & 6.75771164423776 & 15 \tabularnewline
5 & 142.25 & 2.21735578260835 & 5 \tabularnewline
6 & 141.5 & 2.08166599946613 & 5 \tabularnewline
7 & 129.25 & 9.14239210126832 & 19 \tabularnewline
8 & 125 & 2.94392028877595 & 6 \tabularnewline
9 & 128.25 & 0.5 & 1 \tabularnewline
10 & 116 & 7.61577310586391 & 15 \tabularnewline
11 & 107 & 2.44948974278318 & 6 \tabularnewline
12 & 117.75 & 3.30403793359983 & 8 \tabularnewline
13 & 108 & 4.96655480858378 & 11 \tabularnewline
14 & 106.25 & 2.62995563967658 & 6 \tabularnewline
15 & 108.5 & 2.38047614284762 & 5 \tabularnewline
16 & 109.5 & 10.0829889748361 & 23 \tabularnewline
17 & 123.75 & 3.09569593683445 & 7 \tabularnewline
18 & 127.75 & 4.19324854180304 & 9 \tabularnewline
19 & 118.5 & 7.04745817062199 & 17 \tabularnewline
20 & 123.25 & 7.13559154286922 & 16 \tabularnewline
21 & 117 & 8.52447456836295 & 20 \tabularnewline
\hline
\end{tabular}
%Source: https://freestatistics.org/blog/index.php?pk=78183&T=1

[TABLE]
[ROW][C]Standard Deviation-Mean Plot[/C][/ROW]
[ROW][C]Section[/C][C]Mean[/C][C]Standard Deviation[/C][C]Range[/C][/ROW]
[ROW][C]1[/C][C]156.25[/C][C]1.70782512765993[/C][C]4[/C][/ROW]
[ROW][C]2[/C][C]152.25[/C][C]1.25830573921179[/C][C]3[/C][/ROW]
[ROW][C]3[/C][C]156[/C][C]1.41421356237310[/C][C]3[/C][/ROW]
[ROW][C]4[/C][C]148.5[/C][C]6.75771164423776[/C][C]15[/C][/ROW]
[ROW][C]5[/C][C]142.25[/C][C]2.21735578260835[/C][C]5[/C][/ROW]
[ROW][C]6[/C][C]141.5[/C][C]2.08166599946613[/C][C]5[/C][/ROW]
[ROW][C]7[/C][C]129.25[/C][C]9.14239210126832[/C][C]19[/C][/ROW]
[ROW][C]8[/C][C]125[/C][C]2.94392028877595[/C][C]6[/C][/ROW]
[ROW][C]9[/C][C]128.25[/C][C]0.5[/C][C]1[/C][/ROW]
[ROW][C]10[/C][C]116[/C][C]7.61577310586391[/C][C]15[/C][/ROW]
[ROW][C]11[/C][C]107[/C][C]2.44948974278318[/C][C]6[/C][/ROW]
[ROW][C]12[/C][C]117.75[/C][C]3.30403793359983[/C][C]8[/C][/ROW]
[ROW][C]13[/C][C]108[/C][C]4.96655480858378[/C][C]11[/C][/ROW]
[ROW][C]14[/C][C]106.25[/C][C]2.62995563967658[/C][C]6[/C][/ROW]
[ROW][C]15[/C][C]108.5[/C][C]2.38047614284762[/C][C]5[/C][/ROW]
[ROW][C]16[/C][C]109.5[/C][C]10.0829889748361[/C][C]23[/C][/ROW]
[ROW][C]17[/C][C]123.75[/C][C]3.09569593683445[/C][C]7[/C][/ROW]
[ROW][C]18[/C][C]127.75[/C][C]4.19324854180304[/C][C]9[/C][/ROW]
[ROW][C]19[/C][C]118.5[/C][C]7.04745817062199[/C][C]17[/C][/ROW]
[ROW][C]20[/C][C]123.25[/C][C]7.13559154286922[/C][C]16[/C][/ROW]
[ROW][C]21[/C][C]117[/C][C]8.52447456836295[/C][C]20[/C][/ROW]
[/TABLE]
Source: https://freestatistics.org/blog/index.php?pk=78183&T=1

Globally Unique Identifier (entire table): ba.freestatistics.org/blog/index.php?pk=78183&T=1

As an alternative you can also use a QR Code:  

The GUIDs for individual cells are displayed in the table below:

Standard Deviation-Mean Plot
SectionMeanStandard DeviationRange
1156.251.707825127659934
2152.251.258305739211793
31561.414213562373103
4148.56.7577116442377615
5142.252.217355782608355
6141.52.081665999466135
7129.259.1423921012683219
81252.943920288775956
9128.250.51
101167.6157731058639115
111072.449489742783186
12117.753.304037933599838
131084.9665548085837811
14106.252.629955639676586
15108.52.380476142847625
16109.510.082988974836123
17123.753.095695936834457
18127.754.193248541803049
19118.57.0474581706219917
20123.257.1355915428692216
211178.5244745683629520


Regression: S.E.(k) = alpha + beta * Mean(k)
alpha12.3096865939571
beta-0.062743392720682
S.D.0.0376966620166795
T-STAT-1.66442834362682
p-value0.112432037552735

\begin{tabular}{lllllllll}
\hline
Regression: S.E.(k) = alpha + beta * Mean(k) \tabularnewline
alpha & 12.3096865939571 \tabularnewline
beta & -0.062743392720682 \tabularnewline
S.D. & 0.0376966620166795 \tabularnewline
T-STAT & -1.66442834362682 \tabularnewline
p-value & 0.112432037552735 \tabularnewline
\hline
\end{tabular}
%Source: https://freestatistics.org/blog/index.php?pk=78183&T=2

[TABLE]
[ROW][C]Regression: S.E.(k) = alpha + beta * Mean(k)[/C][/ROW]
[ROW][C]alpha[/C][C]12.3096865939571[/C][/ROW]
[ROW][C]beta[/C][C]-0.062743392720682[/C][/ROW]
[ROW][C]S.D.[/C][C]0.0376966620166795[/C][/ROW]
[ROW][C]T-STAT[/C][C]-1.66442834362682[/C][/ROW]
[ROW][C]p-value[/C][C]0.112432037552735[/C][/ROW]
[/TABLE]
Source: https://freestatistics.org/blog/index.php?pk=78183&T=2

Globally Unique Identifier (entire table): ba.freestatistics.org/blog/index.php?pk=78183&T=2

As an alternative you can also use a QR Code:  

The GUIDs for individual cells are displayed in the table below:

Regression: S.E.(k) = alpha + beta * Mean(k)
alpha12.3096865939571
beta-0.062743392720682
S.D.0.0376966620166795
T-STAT-1.66442834362682
p-value0.112432037552735


Regression: ln S.E.(k) = alpha + beta * ln Mean(k)
alpha12.7019989294224
beta-2.37472256156021
S.D.1.28169666173510
T-STAT-1.85279608854206
p-value0.0795100932997238
Lambda3.37472256156021

\begin{tabular}{lllllllll}
\hline
Regression: ln S.E.(k) = alpha + beta * ln Mean(k) \tabularnewline
alpha & 12.7019989294224 \tabularnewline
beta & -2.37472256156021 \tabularnewline
S.D. & 1.28169666173510 \tabularnewline
T-STAT & -1.85279608854206 \tabularnewline
p-value & 0.0795100932997238 \tabularnewline
Lambda & 3.37472256156021 \tabularnewline
\hline
\end{tabular}
%Source: https://freestatistics.org/blog/index.php?pk=78183&T=3

[TABLE]
[ROW][C]Regression: ln S.E.(k) = alpha + beta * ln Mean(k)[/C][/ROW]
[ROW][C]alpha[/C][C]12.7019989294224[/C][/ROW]
[ROW][C]beta[/C][C]-2.37472256156021[/C][/ROW]
[ROW][C]S.D.[/C][C]1.28169666173510[/C][/ROW]
[ROW][C]T-STAT[/C][C]-1.85279608854206[/C][/ROW]
[ROW][C]p-value[/C][C]0.0795100932997238[/C][/ROW]
[ROW][C]Lambda[/C][C]3.37472256156021[/C][/ROW]
[/TABLE]
Source: https://freestatistics.org/blog/index.php?pk=78183&T=3

Globally Unique Identifier (entire table): ba.freestatistics.org/blog/index.php?pk=78183&T=3

As an alternative you can also use a QR Code:  

The GUIDs for individual cells are displayed in the table below:

Regression: ln S.E.(k) = alpha + beta * ln Mean(k)
alpha12.7019989294224
beta-2.37472256156021
S.D.1.28169666173510
T-STAT-1.85279608854206
p-value0.0795100932997238
Lambda3.37472256156021


Parameters (Session):
par1 = 4 ;
Parameters (R input):
par1 = 4 ;
R code (references can be found in the software module):
par1 <- as.numeric(par1)
(n <- length(x))
(np <- floor(n / par1))
arr <- array(NA,dim=c(par1,np))
j <- 0
k <- 1
for (i in 1:(np*par1))
{
j = j + 1
arr[j,k] <- x[i]
if (j == par1) {
j = 0
k=k+1
}
}
arr
arr.mean <- array(NA,dim=np)
arr.sd <- array(NA,dim=np)
arr.range <- array(NA,dim=np)
for (j in 1:np)
{
arr.mean[j] <- mean(arr[,j],na.rm=TRUE)
arr.sd[j] <- sd(arr[,j],na.rm=TRUE)
arr.range[j] <- max(arr[,j],na.rm=TRUE) - min(arr[,j],na.rm=TRUE)
}
arr.mean
arr.sd
arr.range
(lm1 <- lm(arr.sd~arr.mean))
(lnlm1 <- lm(log(arr.sd)~log(arr.mean)))
(lm2 <- lm(arr.range~arr.mean))
bitmap(file='test1.png')
plot(arr.mean,arr.sd,main='Standard Deviation-Mean Plot',xlab='mean',ylab='standard deviation')
dev.off()
bitmap(file='test2.png')
plot(arr.mean,arr.range,main='Range-Mean Plot',xlab='mean',ylab='range')
dev.off()
load(file='createtable')
a<-table.start()
a<-table.row.start(a)
a<-table.element(a,'Standard Deviation-Mean Plot',4,TRUE)
a<-table.row.end(a)
a<-table.row.start(a)
a<-table.element(a,'Section',header=TRUE)
a<-table.element(a,'Mean',header=TRUE)
a<-table.element(a,'Standard Deviation',header=TRUE)
a<-table.element(a,'Range',header=TRUE)
a<-table.row.end(a)
for (j in 1:np) {
a<-table.row.start(a)
a<-table.element(a,j,header=TRUE)
a<-table.element(a,arr.mean[j])
a<-table.element(a,arr.sd[j] )
a<-table.element(a,arr.range[j] )
a<-table.row.end(a)
}
a<-table.end(a)
table.save(a,file='mytable.tab')
a<-table.start()
a<-table.row.start(a)
a<-table.element(a,'Regression: S.E.(k) = alpha + beta * Mean(k)',2,TRUE)
a<-table.row.end(a)
a<-table.row.start(a)
a<-table.element(a,'alpha',header=TRUE)
a<-table.element(a,lm1$coefficients[[1]])
a<-table.row.end(a)
a<-table.row.start(a)
a<-table.element(a,'beta',header=TRUE)
a<-table.element(a,lm1$coefficients[[2]])
a<-table.row.end(a)
a<-table.row.start(a)
a<-table.element(a,'S.D.',header=TRUE)
a<-table.element(a,summary(lm1)$coefficients[2,2])
a<-table.row.end(a)
a<-table.row.start(a)
a<-table.element(a,'T-STAT',header=TRUE)
a<-table.element(a,summary(lm1)$coefficients[2,3])
a<-table.row.end(a)
a<-table.row.start(a)
a<-table.element(a,'p-value',header=TRUE)
a<-table.element(a,summary(lm1)$coefficients[2,4])
a<-table.row.end(a)
a<-table.end(a)
table.save(a,file='mytable1.tab')
a<-table.start()
a<-table.row.start(a)
a<-table.element(a,'Regression: ln S.E.(k) = alpha + beta * ln Mean(k)',2,TRUE)
a<-table.row.end(a)
a<-table.row.start(a)
a<-table.element(a,'alpha',header=TRUE)
a<-table.element(a,lnlm1$coefficients[[1]])
a<-table.row.end(a)
a<-table.row.start(a)
a<-table.element(a,'beta',header=TRUE)
a<-table.element(a,lnlm1$coefficients[[2]])
a<-table.row.end(a)
a<-table.row.start(a)
a<-table.element(a,'S.D.',header=TRUE)
a<-table.element(a,summary(lnlm1)$coefficients[2,2])
a<-table.row.end(a)
a<-table.row.start(a)
a<-table.element(a,'T-STAT',header=TRUE)
a<-table.element(a,summary(lnlm1)$coefficients[2,3])
a<-table.row.end(a)
a<-table.row.start(a)
a<-table.element(a,'p-value',header=TRUE)
a<-table.element(a,summary(lnlm1)$coefficients[2,4])
a<-table.row.end(a)
a<-table.row.start(a)
a<-table.element(a,'Lambda',header=TRUE)
a<-table.element(a,1-lnlm1$coefficients[[2]])
a<-table.row.end(a)
a<-table.end(a)
table.save(a,file='mytable2.tab')