Free Statistics

of Irreproducible Research!

Author's title

Author*Unverified author*
R Software Modulerwasp_autocorrelation.wasp
Title produced by software(Partial) Autocorrelation Function
Date of computationThu, 29 Jul 2010 13:26:32 +0000
Cite this page as followsStatistical Computations at FreeStatistics.org, Office for Research Development and Education, URL https://freestatistics.org/blog/index.php?v=date/2010/Jul/29/t1280410135286dk136lqpxpmm.htm/, Retrieved Mon, 29 Apr 2024 04:36:04 +0000
Statistical Computations at FreeStatistics.org, Office for Research Development and Education, URL https://freestatistics.org/blog/index.php?pk=78181, Retrieved Mon, 29 Apr 2024 04:36:04 +0000
QR Codes:

Original text written by user:
IsPrivate?No (this computation is public)
User-defined keywordsHoes Isabelle
Estimated Impact136
Family? (F = Feedback message, R = changed R code, M = changed R Module, P = changed Parameters, D = changed Data)
-       [(Partial) Autocorrelation Function] [TIJDREEKS B - STA...] [2010-07-29 13:26:32] [35611de12c9fa8a4a915f3548e0dcd01] [Current]
Feedback Forum

Post a new message
Dataseries X:
158
157
156
154
152
151
152
154
155
155
156
158
156
152
145
141
140
145
143
141
144
139
141
142
141
132
122
122
127
128
122
123
128
128
128
129
124
121
109
110
107
107
104
110
114
118
117
122
113
106
102
111
106
110
105
104
106
110
107
111
101
105
108
124
122
128
124
121
125
134
126
126
111
117
118
128
127
129
124
113
120
127
114
107


Summary of computational transaction
Raw Inputview raw input (R code)
Raw Outputview raw output of R engine
Computing time1 seconds
R Server'Sir Ronald Aylmer Fisher' @ 193.190.124.24

\begin{tabular}{lllllllll}
\hline
Summary of computational transaction \tabularnewline
Raw Input & view raw input (R code)  \tabularnewline
Raw Output & view raw output of R engine  \tabularnewline
Computing time & 1 seconds \tabularnewline
R Server & 'Sir Ronald Aylmer Fisher' @ 193.190.124.24 \tabularnewline
\hline
\end{tabular}
%Source: https://freestatistics.org/blog/index.php?pk=78181&T=0

[TABLE]
[ROW][C]Summary of computational transaction[/C][/ROW]
[ROW][C]Raw Input[/C][C]view raw input (R code) [/C][/ROW]
[ROW][C]Raw Output[/C][C]view raw output of R engine [/C][/ROW]
[ROW][C]Computing time[/C][C]1 seconds[/C][/ROW]
[ROW][C]R Server[/C][C]'Sir Ronald Aylmer Fisher' @ 193.190.124.24[/C][/ROW]
[/TABLE]
Source: https://freestatistics.org/blog/index.php?pk=78181&T=0

Globally Unique Identifier (entire table): ba.freestatistics.org/blog/index.php?pk=78181&T=0

As an alternative you can also use a QR Code:  

The GUIDs for individual cells are displayed in the table below:

Summary of computational transaction
Raw Inputview raw input (R code)
Raw Outputview raw output of R engine
Computing time1 seconds
R Server'Sir Ronald Aylmer Fisher' @ 193.190.124.24


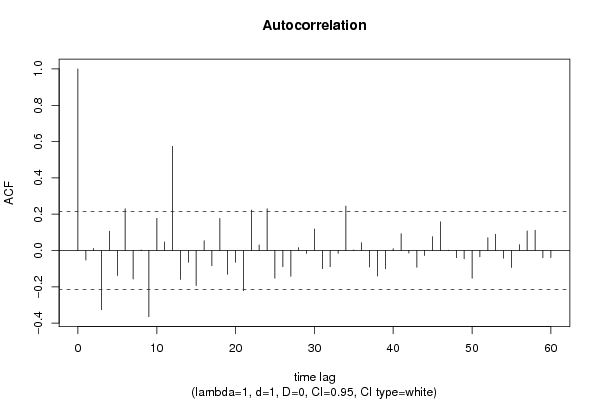
Autocorrelation Function
Time lag kACF(k)T-STATP-value
1-0.052219-0.47570.317755
20.0106310.09690.461538
3-0.325879-2.96890.001953
40.1064210.96950.167547
5-0.137781-1.25520.106456
60.2295572.09140.019776
7-0.156994-1.43030.078195
80.002570.02340.490687
9-0.364544-3.32120.000667
100.177121.61360.055201
110.0470570.42870.334623
120.5737045.22671e-06
13-0.159267-1.4510.075276
14-0.06479-0.59030.27831
15-0.193306-1.76110.040952
160.0536210.48850.313237
17-0.084212-0.76720.222568
180.1766081.6090.05571
19-0.131091-1.19430.117882
20-0.06511-0.59320.277338
21-0.221662-2.01940.023334
220.2223042.02530.023026
230.0306250.2790.390467
240.2295182.0910.019793
25-0.152394-1.38840.084369
26-0.090193-0.82170.206801
27-0.141622-1.29020.100275
280.0158090.1440.442914
29-0.016125-0.14690.441781
300.1179971.0750.142745
31-0.100235-0.91320.181896
32-0.089122-0.81190.209574
33-0.015061-0.13720.445599
340.244462.22710.014323
350.0027980.02550.489863
360.0431190.39280.347725
37-0.090691-0.82620.20552
38-0.140332-1.27850.102321
39-0.101087-0.92090.179875
400.0099530.09070.463982
410.0924010.84180.201157
42-0.014086-0.12830.449098
43-0.092965-0.84690.19973
44-0.027385-0.24950.401799
450.0758270.69080.245805
460.1577411.43710.077226
470.0009990.00910.496379
48-0.039543-0.36030.359785
49-0.045856-0.41780.338598
50-0.15324-1.39610.083207
51-0.034522-0.31450.376962
520.0707310.64440.260551
530.0898610.81870.20766
54-0.042345-0.38580.350323
55-0.093992-0.85630.197146
560.0320590.29210.38548
570.1077590.98170.164543
580.1120281.02060.1552
59-0.04057-0.36960.356309
60-0.039209-0.35720.36092

\begin{tabular}{lllllllll}
\hline
Autocorrelation Function \tabularnewline
Time lag k & ACF(k) & T-STAT & P-value \tabularnewline
1 & -0.052219 & -0.4757 & 0.317755 \tabularnewline
2 & 0.010631 & 0.0969 & 0.461538 \tabularnewline
3 & -0.325879 & -2.9689 & 0.001953 \tabularnewline
4 & 0.106421 & 0.9695 & 0.167547 \tabularnewline
5 & -0.137781 & -1.2552 & 0.106456 \tabularnewline
6 & 0.229557 & 2.0914 & 0.019776 \tabularnewline
7 & -0.156994 & -1.4303 & 0.078195 \tabularnewline
8 & 0.00257 & 0.0234 & 0.490687 \tabularnewline
9 & -0.364544 & -3.3212 & 0.000667 \tabularnewline
10 & 0.17712 & 1.6136 & 0.055201 \tabularnewline
11 & 0.047057 & 0.4287 & 0.334623 \tabularnewline
12 & 0.573704 & 5.2267 & 1e-06 \tabularnewline
13 & -0.159267 & -1.451 & 0.075276 \tabularnewline
14 & -0.06479 & -0.5903 & 0.27831 \tabularnewline
15 & -0.193306 & -1.7611 & 0.040952 \tabularnewline
16 & 0.053621 & 0.4885 & 0.313237 \tabularnewline
17 & -0.084212 & -0.7672 & 0.222568 \tabularnewline
18 & 0.176608 & 1.609 & 0.05571 \tabularnewline
19 & -0.131091 & -1.1943 & 0.117882 \tabularnewline
20 & -0.06511 & -0.5932 & 0.277338 \tabularnewline
21 & -0.221662 & -2.0194 & 0.023334 \tabularnewline
22 & 0.222304 & 2.0253 & 0.023026 \tabularnewline
23 & 0.030625 & 0.279 & 0.390467 \tabularnewline
24 & 0.229518 & 2.091 & 0.019793 \tabularnewline
25 & -0.152394 & -1.3884 & 0.084369 \tabularnewline
26 & -0.090193 & -0.8217 & 0.206801 \tabularnewline
27 & -0.141622 & -1.2902 & 0.100275 \tabularnewline
28 & 0.015809 & 0.144 & 0.442914 \tabularnewline
29 & -0.016125 & -0.1469 & 0.441781 \tabularnewline
30 & 0.117997 & 1.075 & 0.142745 \tabularnewline
31 & -0.100235 & -0.9132 & 0.181896 \tabularnewline
32 & -0.089122 & -0.8119 & 0.209574 \tabularnewline
33 & -0.015061 & -0.1372 & 0.445599 \tabularnewline
34 & 0.24446 & 2.2271 & 0.014323 \tabularnewline
35 & 0.002798 & 0.0255 & 0.489863 \tabularnewline
36 & 0.043119 & 0.3928 & 0.347725 \tabularnewline
37 & -0.090691 & -0.8262 & 0.20552 \tabularnewline
38 & -0.140332 & -1.2785 & 0.102321 \tabularnewline
39 & -0.101087 & -0.9209 & 0.179875 \tabularnewline
40 & 0.009953 & 0.0907 & 0.463982 \tabularnewline
41 & 0.092401 & 0.8418 & 0.201157 \tabularnewline
42 & -0.014086 & -0.1283 & 0.449098 \tabularnewline
43 & -0.092965 & -0.8469 & 0.19973 \tabularnewline
44 & -0.027385 & -0.2495 & 0.401799 \tabularnewline
45 & 0.075827 & 0.6908 & 0.245805 \tabularnewline
46 & 0.157741 & 1.4371 & 0.077226 \tabularnewline
47 & 0.000999 & 0.0091 & 0.496379 \tabularnewline
48 & -0.039543 & -0.3603 & 0.359785 \tabularnewline
49 & -0.045856 & -0.4178 & 0.338598 \tabularnewline
50 & -0.15324 & -1.3961 & 0.083207 \tabularnewline
51 & -0.034522 & -0.3145 & 0.376962 \tabularnewline
52 & 0.070731 & 0.6444 & 0.260551 \tabularnewline
53 & 0.089861 & 0.8187 & 0.20766 \tabularnewline
54 & -0.042345 & -0.3858 & 0.350323 \tabularnewline
55 & -0.093992 & -0.8563 & 0.197146 \tabularnewline
56 & 0.032059 & 0.2921 & 0.38548 \tabularnewline
57 & 0.107759 & 0.9817 & 0.164543 \tabularnewline
58 & 0.112028 & 1.0206 & 0.1552 \tabularnewline
59 & -0.04057 & -0.3696 & 0.356309 \tabularnewline
60 & -0.039209 & -0.3572 & 0.36092 \tabularnewline
\hline
\end{tabular}
%Source: https://freestatistics.org/blog/index.php?pk=78181&T=1

[TABLE]
[ROW][C]Autocorrelation Function[/C][/ROW]
[ROW][C]Time lag k[/C][C]ACF(k)[/C][C]T-STAT[/C][C]P-value[/C][/ROW]
[ROW][C]1[/C][C]-0.052219[/C][C]-0.4757[/C][C]0.317755[/C][/ROW]
[ROW][C]2[/C][C]0.010631[/C][C]0.0969[/C][C]0.461538[/C][/ROW]
[ROW][C]3[/C][C]-0.325879[/C][C]-2.9689[/C][C]0.001953[/C][/ROW]
[ROW][C]4[/C][C]0.106421[/C][C]0.9695[/C][C]0.167547[/C][/ROW]
[ROW][C]5[/C][C]-0.137781[/C][C]-1.2552[/C][C]0.106456[/C][/ROW]
[ROW][C]6[/C][C]0.229557[/C][C]2.0914[/C][C]0.019776[/C][/ROW]
[ROW][C]7[/C][C]-0.156994[/C][C]-1.4303[/C][C]0.078195[/C][/ROW]
[ROW][C]8[/C][C]0.00257[/C][C]0.0234[/C][C]0.490687[/C][/ROW]
[ROW][C]9[/C][C]-0.364544[/C][C]-3.3212[/C][C]0.000667[/C][/ROW]
[ROW][C]10[/C][C]0.17712[/C][C]1.6136[/C][C]0.055201[/C][/ROW]
[ROW][C]11[/C][C]0.047057[/C][C]0.4287[/C][C]0.334623[/C][/ROW]
[ROW][C]12[/C][C]0.573704[/C][C]5.2267[/C][C]1e-06[/C][/ROW]
[ROW][C]13[/C][C]-0.159267[/C][C]-1.451[/C][C]0.075276[/C][/ROW]
[ROW][C]14[/C][C]-0.06479[/C][C]-0.5903[/C][C]0.27831[/C][/ROW]
[ROW][C]15[/C][C]-0.193306[/C][C]-1.7611[/C][C]0.040952[/C][/ROW]
[ROW][C]16[/C][C]0.053621[/C][C]0.4885[/C][C]0.313237[/C][/ROW]
[ROW][C]17[/C][C]-0.084212[/C][C]-0.7672[/C][C]0.222568[/C][/ROW]
[ROW][C]18[/C][C]0.176608[/C][C]1.609[/C][C]0.05571[/C][/ROW]
[ROW][C]19[/C][C]-0.131091[/C][C]-1.1943[/C][C]0.117882[/C][/ROW]
[ROW][C]20[/C][C]-0.06511[/C][C]-0.5932[/C][C]0.277338[/C][/ROW]
[ROW][C]21[/C][C]-0.221662[/C][C]-2.0194[/C][C]0.023334[/C][/ROW]
[ROW][C]22[/C][C]0.222304[/C][C]2.0253[/C][C]0.023026[/C][/ROW]
[ROW][C]23[/C][C]0.030625[/C][C]0.279[/C][C]0.390467[/C][/ROW]
[ROW][C]24[/C][C]0.229518[/C][C]2.091[/C][C]0.019793[/C][/ROW]
[ROW][C]25[/C][C]-0.152394[/C][C]-1.3884[/C][C]0.084369[/C][/ROW]
[ROW][C]26[/C][C]-0.090193[/C][C]-0.8217[/C][C]0.206801[/C][/ROW]
[ROW][C]27[/C][C]-0.141622[/C][C]-1.2902[/C][C]0.100275[/C][/ROW]
[ROW][C]28[/C][C]0.015809[/C][C]0.144[/C][C]0.442914[/C][/ROW]
[ROW][C]29[/C][C]-0.016125[/C][C]-0.1469[/C][C]0.441781[/C][/ROW]
[ROW][C]30[/C][C]0.117997[/C][C]1.075[/C][C]0.142745[/C][/ROW]
[ROW][C]31[/C][C]-0.100235[/C][C]-0.9132[/C][C]0.181896[/C][/ROW]
[ROW][C]32[/C][C]-0.089122[/C][C]-0.8119[/C][C]0.209574[/C][/ROW]
[ROW][C]33[/C][C]-0.015061[/C][C]-0.1372[/C][C]0.445599[/C][/ROW]
[ROW][C]34[/C][C]0.24446[/C][C]2.2271[/C][C]0.014323[/C][/ROW]
[ROW][C]35[/C][C]0.002798[/C][C]0.0255[/C][C]0.489863[/C][/ROW]
[ROW][C]36[/C][C]0.043119[/C][C]0.3928[/C][C]0.347725[/C][/ROW]
[ROW][C]37[/C][C]-0.090691[/C][C]-0.8262[/C][C]0.20552[/C][/ROW]
[ROW][C]38[/C][C]-0.140332[/C][C]-1.2785[/C][C]0.102321[/C][/ROW]
[ROW][C]39[/C][C]-0.101087[/C][C]-0.9209[/C][C]0.179875[/C][/ROW]
[ROW][C]40[/C][C]0.009953[/C][C]0.0907[/C][C]0.463982[/C][/ROW]
[ROW][C]41[/C][C]0.092401[/C][C]0.8418[/C][C]0.201157[/C][/ROW]
[ROW][C]42[/C][C]-0.014086[/C][C]-0.1283[/C][C]0.449098[/C][/ROW]
[ROW][C]43[/C][C]-0.092965[/C][C]-0.8469[/C][C]0.19973[/C][/ROW]
[ROW][C]44[/C][C]-0.027385[/C][C]-0.2495[/C][C]0.401799[/C][/ROW]
[ROW][C]45[/C][C]0.075827[/C][C]0.6908[/C][C]0.245805[/C][/ROW]
[ROW][C]46[/C][C]0.157741[/C][C]1.4371[/C][C]0.077226[/C][/ROW]
[ROW][C]47[/C][C]0.000999[/C][C]0.0091[/C][C]0.496379[/C][/ROW]
[ROW][C]48[/C][C]-0.039543[/C][C]-0.3603[/C][C]0.359785[/C][/ROW]
[ROW][C]49[/C][C]-0.045856[/C][C]-0.4178[/C][C]0.338598[/C][/ROW]
[ROW][C]50[/C][C]-0.15324[/C][C]-1.3961[/C][C]0.083207[/C][/ROW]
[ROW][C]51[/C][C]-0.034522[/C][C]-0.3145[/C][C]0.376962[/C][/ROW]
[ROW][C]52[/C][C]0.070731[/C][C]0.6444[/C][C]0.260551[/C][/ROW]
[ROW][C]53[/C][C]0.089861[/C][C]0.8187[/C][C]0.20766[/C][/ROW]
[ROW][C]54[/C][C]-0.042345[/C][C]-0.3858[/C][C]0.350323[/C][/ROW]
[ROW][C]55[/C][C]-0.093992[/C][C]-0.8563[/C][C]0.197146[/C][/ROW]
[ROW][C]56[/C][C]0.032059[/C][C]0.2921[/C][C]0.38548[/C][/ROW]
[ROW][C]57[/C][C]0.107759[/C][C]0.9817[/C][C]0.164543[/C][/ROW]
[ROW][C]58[/C][C]0.112028[/C][C]1.0206[/C][C]0.1552[/C][/ROW]
[ROW][C]59[/C][C]-0.04057[/C][C]-0.3696[/C][C]0.356309[/C][/ROW]
[ROW][C]60[/C][C]-0.039209[/C][C]-0.3572[/C][C]0.36092[/C][/ROW]
[/TABLE]
Source: https://freestatistics.org/blog/index.php?pk=78181&T=1

Globally Unique Identifier (entire table): ba.freestatistics.org/blog/index.php?pk=78181&T=1

As an alternative you can also use a QR Code:  

The GUIDs for individual cells are displayed in the table below:

Autocorrelation Function
Time lag kACF(k)T-STATP-value
1-0.052219-0.47570.317755
20.0106310.09690.461538
3-0.325879-2.96890.001953
40.1064210.96950.167547
5-0.137781-1.25520.106456
60.2295572.09140.019776
7-0.156994-1.43030.078195
80.002570.02340.490687
9-0.364544-3.32120.000667
100.177121.61360.055201
110.0470570.42870.334623
120.5737045.22671e-06
13-0.159267-1.4510.075276
14-0.06479-0.59030.27831
15-0.193306-1.76110.040952
160.0536210.48850.313237
17-0.084212-0.76720.222568
180.1766081.6090.05571
19-0.131091-1.19430.117882
20-0.06511-0.59320.277338
21-0.221662-2.01940.023334
220.2223042.02530.023026
230.0306250.2790.390467
240.2295182.0910.019793
25-0.152394-1.38840.084369
26-0.090193-0.82170.206801
27-0.141622-1.29020.100275
280.0158090.1440.442914
29-0.016125-0.14690.441781
300.1179971.0750.142745
31-0.100235-0.91320.181896
32-0.089122-0.81190.209574
33-0.015061-0.13720.445599
340.244462.22710.014323
350.0027980.02550.489863
360.0431190.39280.347725
37-0.090691-0.82620.20552
38-0.140332-1.27850.102321
39-0.101087-0.92090.179875
400.0099530.09070.463982
410.0924010.84180.201157
42-0.014086-0.12830.449098
43-0.092965-0.84690.19973
44-0.027385-0.24950.401799
450.0758270.69080.245805
460.1577411.43710.077226
470.0009990.00910.496379
48-0.039543-0.36030.359785
49-0.045856-0.41780.338598
50-0.15324-1.39610.083207
51-0.034522-0.31450.376962
520.0707310.64440.260551
530.0898610.81870.20766
54-0.042345-0.38580.350323
55-0.093992-0.85630.197146
560.0320590.29210.38548
570.1077590.98170.164543
580.1120281.02060.1552
59-0.04057-0.36960.356309
60-0.039209-0.35720.36092


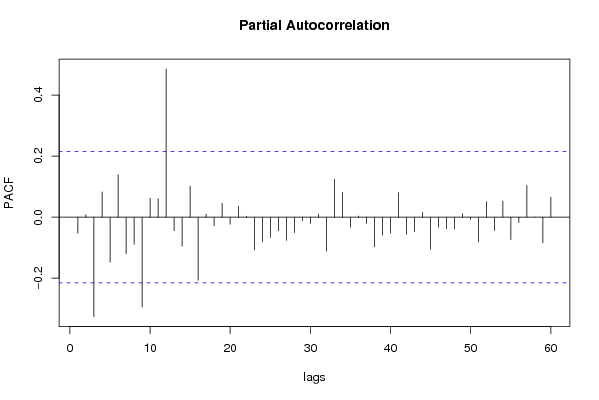
Partial Autocorrelation Function
Time lag kPACF(k)T-STATP-value
1-0.052219-0.47570.317755
20.0079260.07220.471305
3-0.325823-2.96840.001956
40.0824160.75080.227435
5-0.147244-1.34150.091716
60.1388791.26520.104662
7-0.119864-1.0920.138993
8-0.088828-0.80930.21034
9-0.294345-2.68160.004419
100.0623720.56820.285705
110.0601360.54790.292627
120.4856464.42441.5e-05
13-0.044117-0.40190.344386
14-0.094835-0.8640.195042
150.1017910.92740.178214
16-0.206849-1.88450.0315
170.0101690.09260.463205
18-0.027879-0.2540.400067
190.045630.41570.339349
20-0.023133-0.21070.4168
210.0357280.32550.372811
220.0034660.03160.487442
23-0.107681-0.9810.164717
24-0.080957-0.73750.231434
25-0.066081-0.6020.274399
26-0.044496-0.40540.343121
27-0.075953-0.6920.245445
28-0.050077-0.45620.324709
29-0.012003-0.10940.456594
30-0.02066-0.18820.425582
310.0106390.09690.461508
32-0.11098-1.01110.157458
330.1241.12970.130929
340.0814510.7420.230076
35-0.032585-0.29690.383655
360.0036270.0330.486861
37-0.020973-0.19110.424466
38-0.097107-0.88470.189442
39-0.058386-0.53190.298101
40-0.05164-0.47050.319629
410.0798960.72790.234366
42-0.057076-0.520.302227
43-0.047294-0.43090.333839
440.0156520.14260.443478
45-0.104856-0.95530.171105
46-0.032598-0.2970.383612
47-0.037786-0.34420.365767
48-0.038895-0.35440.361987
490.0120380.10970.456469
50-0.007068-0.06440.474408
51-0.081234-0.74010.230671
520.0503810.4590.323721
53-0.043602-0.39720.346107
540.0526580.47970.316337
55-0.073444-0.66910.252642
56-0.01771-0.16130.436108
570.1038280.94590.173468
58-0.000548-0.0050.498013
59-0.084087-0.76610.222904
600.0653390.59530.276643

\begin{tabular}{lllllllll}
\hline
Partial Autocorrelation Function \tabularnewline
Time lag k & PACF(k) & T-STAT & P-value \tabularnewline
1 & -0.052219 & -0.4757 & 0.317755 \tabularnewline
2 & 0.007926 & 0.0722 & 0.471305 \tabularnewline
3 & -0.325823 & -2.9684 & 0.001956 \tabularnewline
4 & 0.082416 & 0.7508 & 0.227435 \tabularnewline
5 & -0.147244 & -1.3415 & 0.091716 \tabularnewline
6 & 0.138879 & 1.2652 & 0.104662 \tabularnewline
7 & -0.119864 & -1.092 & 0.138993 \tabularnewline
8 & -0.088828 & -0.8093 & 0.21034 \tabularnewline
9 & -0.294345 & -2.6816 & 0.004419 \tabularnewline
10 & 0.062372 & 0.5682 & 0.285705 \tabularnewline
11 & 0.060136 & 0.5479 & 0.292627 \tabularnewline
12 & 0.485646 & 4.4244 & 1.5e-05 \tabularnewline
13 & -0.044117 & -0.4019 & 0.344386 \tabularnewline
14 & -0.094835 & -0.864 & 0.195042 \tabularnewline
15 & 0.101791 & 0.9274 & 0.178214 \tabularnewline
16 & -0.206849 & -1.8845 & 0.0315 \tabularnewline
17 & 0.010169 & 0.0926 & 0.463205 \tabularnewline
18 & -0.027879 & -0.254 & 0.400067 \tabularnewline
19 & 0.04563 & 0.4157 & 0.339349 \tabularnewline
20 & -0.023133 & -0.2107 & 0.4168 \tabularnewline
21 & 0.035728 & 0.3255 & 0.372811 \tabularnewline
22 & 0.003466 & 0.0316 & 0.487442 \tabularnewline
23 & -0.107681 & -0.981 & 0.164717 \tabularnewline
24 & -0.080957 & -0.7375 & 0.231434 \tabularnewline
25 & -0.066081 & -0.602 & 0.274399 \tabularnewline
26 & -0.044496 & -0.4054 & 0.343121 \tabularnewline
27 & -0.075953 & -0.692 & 0.245445 \tabularnewline
28 & -0.050077 & -0.4562 & 0.324709 \tabularnewline
29 & -0.012003 & -0.1094 & 0.456594 \tabularnewline
30 & -0.02066 & -0.1882 & 0.425582 \tabularnewline
31 & 0.010639 & 0.0969 & 0.461508 \tabularnewline
32 & -0.11098 & -1.0111 & 0.157458 \tabularnewline
33 & 0.124 & 1.1297 & 0.130929 \tabularnewline
34 & 0.081451 & 0.742 & 0.230076 \tabularnewline
35 & -0.032585 & -0.2969 & 0.383655 \tabularnewline
36 & 0.003627 & 0.033 & 0.486861 \tabularnewline
37 & -0.020973 & -0.1911 & 0.424466 \tabularnewline
38 & -0.097107 & -0.8847 & 0.189442 \tabularnewline
39 & -0.058386 & -0.5319 & 0.298101 \tabularnewline
40 & -0.05164 & -0.4705 & 0.319629 \tabularnewline
41 & 0.079896 & 0.7279 & 0.234366 \tabularnewline
42 & -0.057076 & -0.52 & 0.302227 \tabularnewline
43 & -0.047294 & -0.4309 & 0.333839 \tabularnewline
44 & 0.015652 & 0.1426 & 0.443478 \tabularnewline
45 & -0.104856 & -0.9553 & 0.171105 \tabularnewline
46 & -0.032598 & -0.297 & 0.383612 \tabularnewline
47 & -0.037786 & -0.3442 & 0.365767 \tabularnewline
48 & -0.038895 & -0.3544 & 0.361987 \tabularnewline
49 & 0.012038 & 0.1097 & 0.456469 \tabularnewline
50 & -0.007068 & -0.0644 & 0.474408 \tabularnewline
51 & -0.081234 & -0.7401 & 0.230671 \tabularnewline
52 & 0.050381 & 0.459 & 0.323721 \tabularnewline
53 & -0.043602 & -0.3972 & 0.346107 \tabularnewline
54 & 0.052658 & 0.4797 & 0.316337 \tabularnewline
55 & -0.073444 & -0.6691 & 0.252642 \tabularnewline
56 & -0.01771 & -0.1613 & 0.436108 \tabularnewline
57 & 0.103828 & 0.9459 & 0.173468 \tabularnewline
58 & -0.000548 & -0.005 & 0.498013 \tabularnewline
59 & -0.084087 & -0.7661 & 0.222904 \tabularnewline
60 & 0.065339 & 0.5953 & 0.276643 \tabularnewline
\hline
\end{tabular}
%Source: https://freestatistics.org/blog/index.php?pk=78181&T=2

[TABLE]
[ROW][C]Partial Autocorrelation Function[/C][/ROW]
[ROW][C]Time lag k[/C][C]PACF(k)[/C][C]T-STAT[/C][C]P-value[/C][/ROW]
[ROW][C]1[/C][C]-0.052219[/C][C]-0.4757[/C][C]0.317755[/C][/ROW]
[ROW][C]2[/C][C]0.007926[/C][C]0.0722[/C][C]0.471305[/C][/ROW]
[ROW][C]3[/C][C]-0.325823[/C][C]-2.9684[/C][C]0.001956[/C][/ROW]
[ROW][C]4[/C][C]0.082416[/C][C]0.7508[/C][C]0.227435[/C][/ROW]
[ROW][C]5[/C][C]-0.147244[/C][C]-1.3415[/C][C]0.091716[/C][/ROW]
[ROW][C]6[/C][C]0.138879[/C][C]1.2652[/C][C]0.104662[/C][/ROW]
[ROW][C]7[/C][C]-0.119864[/C][C]-1.092[/C][C]0.138993[/C][/ROW]
[ROW][C]8[/C][C]-0.088828[/C][C]-0.8093[/C][C]0.21034[/C][/ROW]
[ROW][C]9[/C][C]-0.294345[/C][C]-2.6816[/C][C]0.004419[/C][/ROW]
[ROW][C]10[/C][C]0.062372[/C][C]0.5682[/C][C]0.285705[/C][/ROW]
[ROW][C]11[/C][C]0.060136[/C][C]0.5479[/C][C]0.292627[/C][/ROW]
[ROW][C]12[/C][C]0.485646[/C][C]4.4244[/C][C]1.5e-05[/C][/ROW]
[ROW][C]13[/C][C]-0.044117[/C][C]-0.4019[/C][C]0.344386[/C][/ROW]
[ROW][C]14[/C][C]-0.094835[/C][C]-0.864[/C][C]0.195042[/C][/ROW]
[ROW][C]15[/C][C]0.101791[/C][C]0.9274[/C][C]0.178214[/C][/ROW]
[ROW][C]16[/C][C]-0.206849[/C][C]-1.8845[/C][C]0.0315[/C][/ROW]
[ROW][C]17[/C][C]0.010169[/C][C]0.0926[/C][C]0.463205[/C][/ROW]
[ROW][C]18[/C][C]-0.027879[/C][C]-0.254[/C][C]0.400067[/C][/ROW]
[ROW][C]19[/C][C]0.04563[/C][C]0.4157[/C][C]0.339349[/C][/ROW]
[ROW][C]20[/C][C]-0.023133[/C][C]-0.2107[/C][C]0.4168[/C][/ROW]
[ROW][C]21[/C][C]0.035728[/C][C]0.3255[/C][C]0.372811[/C][/ROW]
[ROW][C]22[/C][C]0.003466[/C][C]0.0316[/C][C]0.487442[/C][/ROW]
[ROW][C]23[/C][C]-0.107681[/C][C]-0.981[/C][C]0.164717[/C][/ROW]
[ROW][C]24[/C][C]-0.080957[/C][C]-0.7375[/C][C]0.231434[/C][/ROW]
[ROW][C]25[/C][C]-0.066081[/C][C]-0.602[/C][C]0.274399[/C][/ROW]
[ROW][C]26[/C][C]-0.044496[/C][C]-0.4054[/C][C]0.343121[/C][/ROW]
[ROW][C]27[/C][C]-0.075953[/C][C]-0.692[/C][C]0.245445[/C][/ROW]
[ROW][C]28[/C][C]-0.050077[/C][C]-0.4562[/C][C]0.324709[/C][/ROW]
[ROW][C]29[/C][C]-0.012003[/C][C]-0.1094[/C][C]0.456594[/C][/ROW]
[ROW][C]30[/C][C]-0.02066[/C][C]-0.1882[/C][C]0.425582[/C][/ROW]
[ROW][C]31[/C][C]0.010639[/C][C]0.0969[/C][C]0.461508[/C][/ROW]
[ROW][C]32[/C][C]-0.11098[/C][C]-1.0111[/C][C]0.157458[/C][/ROW]
[ROW][C]33[/C][C]0.124[/C][C]1.1297[/C][C]0.130929[/C][/ROW]
[ROW][C]34[/C][C]0.081451[/C][C]0.742[/C][C]0.230076[/C][/ROW]
[ROW][C]35[/C][C]-0.032585[/C][C]-0.2969[/C][C]0.383655[/C][/ROW]
[ROW][C]36[/C][C]0.003627[/C][C]0.033[/C][C]0.486861[/C][/ROW]
[ROW][C]37[/C][C]-0.020973[/C][C]-0.1911[/C][C]0.424466[/C][/ROW]
[ROW][C]38[/C][C]-0.097107[/C][C]-0.8847[/C][C]0.189442[/C][/ROW]
[ROW][C]39[/C][C]-0.058386[/C][C]-0.5319[/C][C]0.298101[/C][/ROW]
[ROW][C]40[/C][C]-0.05164[/C][C]-0.4705[/C][C]0.319629[/C][/ROW]
[ROW][C]41[/C][C]0.079896[/C][C]0.7279[/C][C]0.234366[/C][/ROW]
[ROW][C]42[/C][C]-0.057076[/C][C]-0.52[/C][C]0.302227[/C][/ROW]
[ROW][C]43[/C][C]-0.047294[/C][C]-0.4309[/C][C]0.333839[/C][/ROW]
[ROW][C]44[/C][C]0.015652[/C][C]0.1426[/C][C]0.443478[/C][/ROW]
[ROW][C]45[/C][C]-0.104856[/C][C]-0.9553[/C][C]0.171105[/C][/ROW]
[ROW][C]46[/C][C]-0.032598[/C][C]-0.297[/C][C]0.383612[/C][/ROW]
[ROW][C]47[/C][C]-0.037786[/C][C]-0.3442[/C][C]0.365767[/C][/ROW]
[ROW][C]48[/C][C]-0.038895[/C][C]-0.3544[/C][C]0.361987[/C][/ROW]
[ROW][C]49[/C][C]0.012038[/C][C]0.1097[/C][C]0.456469[/C][/ROW]
[ROW][C]50[/C][C]-0.007068[/C][C]-0.0644[/C][C]0.474408[/C][/ROW]
[ROW][C]51[/C][C]-0.081234[/C][C]-0.7401[/C][C]0.230671[/C][/ROW]
[ROW][C]52[/C][C]0.050381[/C][C]0.459[/C][C]0.323721[/C][/ROW]
[ROW][C]53[/C][C]-0.043602[/C][C]-0.3972[/C][C]0.346107[/C][/ROW]
[ROW][C]54[/C][C]0.052658[/C][C]0.4797[/C][C]0.316337[/C][/ROW]
[ROW][C]55[/C][C]-0.073444[/C][C]-0.6691[/C][C]0.252642[/C][/ROW]
[ROW][C]56[/C][C]-0.01771[/C][C]-0.1613[/C][C]0.436108[/C][/ROW]
[ROW][C]57[/C][C]0.103828[/C][C]0.9459[/C][C]0.173468[/C][/ROW]
[ROW][C]58[/C][C]-0.000548[/C][C]-0.005[/C][C]0.498013[/C][/ROW]
[ROW][C]59[/C][C]-0.084087[/C][C]-0.7661[/C][C]0.222904[/C][/ROW]
[ROW][C]60[/C][C]0.065339[/C][C]0.5953[/C][C]0.276643[/C][/ROW]
[/TABLE]
Source: https://freestatistics.org/blog/index.php?pk=78181&T=2

Globally Unique Identifier (entire table): ba.freestatistics.org/blog/index.php?pk=78181&T=2

As an alternative you can also use a QR Code:  

The GUIDs for individual cells are displayed in the table below:

Partial Autocorrelation Function
Time lag kPACF(k)T-STATP-value
1-0.052219-0.47570.317755
20.0079260.07220.471305
3-0.325823-2.96840.001956
40.0824160.75080.227435
5-0.147244-1.34150.091716
60.1388791.26520.104662
7-0.119864-1.0920.138993
8-0.088828-0.80930.21034
9-0.294345-2.68160.004419
100.0623720.56820.285705
110.0601360.54790.292627
120.4856464.42441.5e-05
13-0.044117-0.40190.344386
14-0.094835-0.8640.195042
150.1017910.92740.178214
16-0.206849-1.88450.0315
170.0101690.09260.463205
18-0.027879-0.2540.400067
190.045630.41570.339349
20-0.023133-0.21070.4168
210.0357280.32550.372811
220.0034660.03160.487442
23-0.107681-0.9810.164717
24-0.080957-0.73750.231434
25-0.066081-0.6020.274399
26-0.044496-0.40540.343121
27-0.075953-0.6920.245445
28-0.050077-0.45620.324709
29-0.012003-0.10940.456594
30-0.02066-0.18820.425582
310.0106390.09690.461508
32-0.11098-1.01110.157458
330.1241.12970.130929
340.0814510.7420.230076
35-0.032585-0.29690.383655
360.0036270.0330.486861
37-0.020973-0.19110.424466
38-0.097107-0.88470.189442
39-0.058386-0.53190.298101
40-0.05164-0.47050.319629
410.0798960.72790.234366
42-0.057076-0.520.302227
43-0.047294-0.43090.333839
440.0156520.14260.443478
45-0.104856-0.95530.171105
46-0.032598-0.2970.383612
47-0.037786-0.34420.365767
48-0.038895-0.35440.361987
490.0120380.10970.456469
50-0.007068-0.06440.474408
51-0.081234-0.74010.230671
520.0503810.4590.323721
53-0.043602-0.39720.346107
540.0526580.47970.316337
55-0.073444-0.66910.252642
56-0.01771-0.16130.436108
570.1038280.94590.173468
58-0.000548-0.0050.498013
59-0.084087-0.76610.222904
600.0653390.59530.276643


Parameters (Session):
par1 = 60 ; par2 = 1 ; par3 = 1 ; par4 = 0 ; par5 = 12 ; par6 = White Noise ; par7 = 0.95 ;
Parameters (R input):
par1 = 60 ; par2 = 1 ; par3 = 1 ; par4 = 0 ; par5 = 12 ; par6 = White Noise ; par7 = 0.95 ;
R code (references can be found in the software module):
if (par1 == 'Default') {
par1 = 10*log10(length(x))
} else {
par1 <- as.numeric(par1)
}
par2 <- as.numeric(par2)
par3 <- as.numeric(par3)
par4 <- as.numeric(par4)
par5 <- as.numeric(par5)
if (par6 == 'White Noise') par6 <- 'white' else par6 <- 'ma'
par7 <- as.numeric(par7)
if (par2 == 0) {
x <- log(x)
} else {
x <- (x ^ par2 - 1) / par2
}
if (par3 > 0) x <- diff(x,lag=1,difference=par3)
if (par4 > 0) x <- diff(x,lag=par5,difference=par4)
bitmap(file='pic1.png')
racf <- acf(x, par1, main='Autocorrelation', xlab='time lag', ylab='ACF', ci.type=par6, ci=par7, sub=paste('(lambda=',par2,', d=',par3,', D=',par4,', CI=', par7, ', CI type=',par6,')',sep=''))
dev.off()
bitmap(file='pic2.png')
rpacf <- pacf(x,par1,main='Partial Autocorrelation',xlab='lags',ylab='PACF')
dev.off()
(myacf <- c(racf$acf))
(mypacf <- c(rpacf$acf))
lengthx <- length(x)
sqrtn <- sqrt(lengthx)
load(file='createtable')
a<-table.start()
a<-table.row.start(a)
a<-table.element(a,'Autocorrelation Function',4,TRUE)
a<-table.row.end(a)
a<-table.row.start(a)
a<-table.element(a,'Time lag k',header=TRUE)
a<-table.element(a,hyperlink('basics.htm','ACF(k)','click here for more information about the Autocorrelation Function'),header=TRUE)
a<-table.element(a,'T-STAT',header=TRUE)
a<-table.element(a,'P-value',header=TRUE)
a<-table.row.end(a)
for (i in 2:(par1+1)) {
a<-table.row.start(a)
a<-table.element(a,i-1,header=TRUE)
a<-table.element(a,round(myacf[i],6))
mytstat <- myacf[i]*sqrtn
a<-table.element(a,round(mytstat,4))
a<-table.element(a,round(1-pt(abs(mytstat),lengthx),6))
a<-table.row.end(a)
}
a<-table.end(a)
table.save(a,file='mytable.tab')
a<-table.start()
a<-table.row.start(a)
a<-table.element(a,'Partial Autocorrelation Function',4,TRUE)
a<-table.row.end(a)
a<-table.row.start(a)
a<-table.element(a,'Time lag k',header=TRUE)
a<-table.element(a,hyperlink('basics.htm','PACF(k)','click here for more information about the Partial Autocorrelation Function'),header=TRUE)
a<-table.element(a,'T-STAT',header=TRUE)
a<-table.element(a,'P-value',header=TRUE)
a<-table.row.end(a)
for (i in 1:par1) {
a<-table.row.start(a)
a<-table.element(a,i,header=TRUE)
a<-table.element(a,round(mypacf[i],6))
mytstat <- mypacf[i]*sqrtn
a<-table.element(a,round(mytstat,4))
a<-table.element(a,round(1-pt(abs(mytstat),lengthx),6))
a<-table.row.end(a)
}
a<-table.end(a)
table.save(a,file='mytable1.tab')