Free Statistics

of Irreproducible Research!

Author's title

Author*Unverified author*
R Software Modulerwasp_autocorrelation.wasp
Title produced by software(Partial) Autocorrelation Function
Date of computationThu, 29 Jul 2010 13:14:20 +0000
Cite this page as followsStatistical Computations at FreeStatistics.org, Office for Research Development and Education, URL https://freestatistics.org/blog/index.php?v=date/2010/Jul/29/t1280409329p8wknplqvattwys.htm/, Retrieved Mon, 29 Apr 2024 01:06:32 +0000
Statistical Computations at FreeStatistics.org, Office for Research Development and Education, URL https://freestatistics.org/blog/index.php?pk=78179, Retrieved Mon, 29 Apr 2024 01:06:32 +0000
QR Codes:

Original text written by user:
IsPrivate?No (this computation is public)
User-defined keywordsHoes Isabelle
Estimated Impact151
Family? (F = Feedback message, R = changed R code, M = changed R Module, P = changed Parameters, D = changed Data)
-       [(Partial) Autocorrelation Function] [TIJDREEKS B - STA...] [2010-07-29 13:14:20] [35611de12c9fa8a4a915f3548e0dcd01] [Current]
Feedback Forum

Post a new message
Dataseries X:
158
157
156
154
152
151
152
154
155
155
156
158
156
152
145
141
140
145
143
141
144
139
141
142
141
132
122
122
127
128
122
123
128
128
128
129
124
121
109
110
107
107
104
110
114
118
117
122
113
106
102
111
106
110
105
104
106
110
107
111
101
105
108
124
122
128
124
121
125
134
126
126
111
117
118
128
127
129
124
113
120
127
114
107


Summary of computational transaction
Raw Inputview raw input (R code)
Raw Outputview raw output of R engine
Computing time2 seconds
R Server'Gwilym Jenkins' @ 72.249.127.135

\begin{tabular}{lllllllll}
\hline
Summary of computational transaction \tabularnewline
Raw Input & view raw input (R code)  \tabularnewline
Raw Output & view raw output of R engine  \tabularnewline
Computing time & 2 seconds \tabularnewline
R Server & 'Gwilym Jenkins' @ 72.249.127.135 \tabularnewline
\hline
\end{tabular}
%Source: https://freestatistics.org/blog/index.php?pk=78179&T=0

[TABLE]
[ROW][C]Summary of computational transaction[/C][/ROW]
[ROW][C]Raw Input[/C][C]view raw input (R code) [/C][/ROW]
[ROW][C]Raw Output[/C][C]view raw output of R engine [/C][/ROW]
[ROW][C]Computing time[/C][C]2 seconds[/C][/ROW]
[ROW][C]R Server[/C][C]'Gwilym Jenkins' @ 72.249.127.135[/C][/ROW]
[/TABLE]
Source: https://freestatistics.org/blog/index.php?pk=78179&T=0

Globally Unique Identifier (entire table): ba.freestatistics.org/blog/index.php?pk=78179&T=0

As an alternative you can also use a QR Code:  

The GUIDs for individual cells are displayed in the table below:

Summary of computational transaction
Raw Inputview raw input (R code)
Raw Outputview raw output of R engine
Computing time2 seconds
R Server'Gwilym Jenkins' @ 72.249.127.135


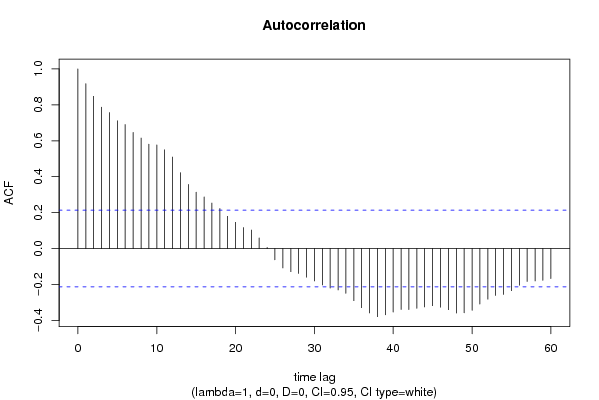
Autocorrelation Function
Time lag kACF(k)T-STATP-value
10.9180028.41360
20.8475227.76770
30.7873247.21590
40.7571956.93980
50.7116056.5220
60.690216.32590
70.6468825.92880
80.6149165.63580
90.5813695.32830
100.5766345.28490
110.5499785.04061e-06
120.5093354.66816e-06
130.4226643.87380.000106
140.3571043.27290.000773
150.3137532.87560.002554
160.2877932.63770.004972
170.2534322.32270.011306
180.2230112.04390.022047
190.1793511.64380.05198
200.1462811.34070.091818
210.1169251.07160.143478
220.1029210.94330.174119
230.059150.54210.294586
240.0060720.05560.477877
25-0.062589-0.57360.283873
26-0.107775-0.98780.16305
27-0.128527-1.1780.121068
28-0.138599-1.27030.103745
29-0.159638-1.46310.073585
30-0.180526-1.65450.050874
31-0.202503-1.8560.033482
32-0.219554-2.01220.023699
33-0.230613-2.11360.018758
34-0.248812-2.28040.012558
35-0.290448-2.6620.004653
36-0.328818-3.01370.001706
37-0.358229-3.28320.000748
38-0.379036-3.47390.000407
39-0.368825-3.38030.00055
40-0.353182-3.2370.000865
41-0.338531-3.10270.001306
42-0.339326-3.110.001278
43-0.332772-3.04990.001531
44-0.325132-2.97990.001885
45-0.318189-2.91630.002271
46-0.326267-2.99030.001828
47-0.340189-3.11790.001247
48-0.358999-3.29030.000732
49-0.357963-3.28080.000754
50-0.34393-3.15220.001124
51-0.308658-2.82890.00292
52-0.282-2.58460.005739
53-0.260742-2.38970.009549
54-0.255561-2.34230.010767
55-0.234592-2.15010.017212
56-0.203553-1.86560.032794
57-0.183173-1.67880.048453
58-0.179977-1.64950.051388
59-0.176507-1.61770.054737
60-0.166692-1.52780.065165

\begin{tabular}{lllllllll}
\hline
Autocorrelation Function \tabularnewline
Time lag k & ACF(k) & T-STAT & P-value \tabularnewline
1 & 0.918002 & 8.4136 & 0 \tabularnewline
2 & 0.847522 & 7.7677 & 0 \tabularnewline
3 & 0.787324 & 7.2159 & 0 \tabularnewline
4 & 0.757195 & 6.9398 & 0 \tabularnewline
5 & 0.711605 & 6.522 & 0 \tabularnewline
6 & 0.69021 & 6.3259 & 0 \tabularnewline
7 & 0.646882 & 5.9288 & 0 \tabularnewline
8 & 0.614916 & 5.6358 & 0 \tabularnewline
9 & 0.581369 & 5.3283 & 0 \tabularnewline
10 & 0.576634 & 5.2849 & 0 \tabularnewline
11 & 0.549978 & 5.0406 & 1e-06 \tabularnewline
12 & 0.509335 & 4.6681 & 6e-06 \tabularnewline
13 & 0.422664 & 3.8738 & 0.000106 \tabularnewline
14 & 0.357104 & 3.2729 & 0.000773 \tabularnewline
15 & 0.313753 & 2.8756 & 0.002554 \tabularnewline
16 & 0.287793 & 2.6377 & 0.004972 \tabularnewline
17 & 0.253432 & 2.3227 & 0.011306 \tabularnewline
18 & 0.223011 & 2.0439 & 0.022047 \tabularnewline
19 & 0.179351 & 1.6438 & 0.05198 \tabularnewline
20 & 0.146281 & 1.3407 & 0.091818 \tabularnewline
21 & 0.116925 & 1.0716 & 0.143478 \tabularnewline
22 & 0.102921 & 0.9433 & 0.174119 \tabularnewline
23 & 0.05915 & 0.5421 & 0.294586 \tabularnewline
24 & 0.006072 & 0.0556 & 0.477877 \tabularnewline
25 & -0.062589 & -0.5736 & 0.283873 \tabularnewline
26 & -0.107775 & -0.9878 & 0.16305 \tabularnewline
27 & -0.128527 & -1.178 & 0.121068 \tabularnewline
28 & -0.138599 & -1.2703 & 0.103745 \tabularnewline
29 & -0.159638 & -1.4631 & 0.073585 \tabularnewline
30 & -0.180526 & -1.6545 & 0.050874 \tabularnewline
31 & -0.202503 & -1.856 & 0.033482 \tabularnewline
32 & -0.219554 & -2.0122 & 0.023699 \tabularnewline
33 & -0.230613 & -2.1136 & 0.018758 \tabularnewline
34 & -0.248812 & -2.2804 & 0.012558 \tabularnewline
35 & -0.290448 & -2.662 & 0.004653 \tabularnewline
36 & -0.328818 & -3.0137 & 0.001706 \tabularnewline
37 & -0.358229 & -3.2832 & 0.000748 \tabularnewline
38 & -0.379036 & -3.4739 & 0.000407 \tabularnewline
39 & -0.368825 & -3.3803 & 0.00055 \tabularnewline
40 & -0.353182 & -3.237 & 0.000865 \tabularnewline
41 & -0.338531 & -3.1027 & 0.001306 \tabularnewline
42 & -0.339326 & -3.11 & 0.001278 \tabularnewline
43 & -0.332772 & -3.0499 & 0.001531 \tabularnewline
44 & -0.325132 & -2.9799 & 0.001885 \tabularnewline
45 & -0.318189 & -2.9163 & 0.002271 \tabularnewline
46 & -0.326267 & -2.9903 & 0.001828 \tabularnewline
47 & -0.340189 & -3.1179 & 0.001247 \tabularnewline
48 & -0.358999 & -3.2903 & 0.000732 \tabularnewline
49 & -0.357963 & -3.2808 & 0.000754 \tabularnewline
50 & -0.34393 & -3.1522 & 0.001124 \tabularnewline
51 & -0.308658 & -2.8289 & 0.00292 \tabularnewline
52 & -0.282 & -2.5846 & 0.005739 \tabularnewline
53 & -0.260742 & -2.3897 & 0.009549 \tabularnewline
54 & -0.255561 & -2.3423 & 0.010767 \tabularnewline
55 & -0.234592 & -2.1501 & 0.017212 \tabularnewline
56 & -0.203553 & -1.8656 & 0.032794 \tabularnewline
57 & -0.183173 & -1.6788 & 0.048453 \tabularnewline
58 & -0.179977 & -1.6495 & 0.051388 \tabularnewline
59 & -0.176507 & -1.6177 & 0.054737 \tabularnewline
60 & -0.166692 & -1.5278 & 0.065165 \tabularnewline
\hline
\end{tabular}
%Source: https://freestatistics.org/blog/index.php?pk=78179&T=1

[TABLE]
[ROW][C]Autocorrelation Function[/C][/ROW]
[ROW][C]Time lag k[/C][C]ACF(k)[/C][C]T-STAT[/C][C]P-value[/C][/ROW]
[ROW][C]1[/C][C]0.918002[/C][C]8.4136[/C][C]0[/C][/ROW]
[ROW][C]2[/C][C]0.847522[/C][C]7.7677[/C][C]0[/C][/ROW]
[ROW][C]3[/C][C]0.787324[/C][C]7.2159[/C][C]0[/C][/ROW]
[ROW][C]4[/C][C]0.757195[/C][C]6.9398[/C][C]0[/C][/ROW]
[ROW][C]5[/C][C]0.711605[/C][C]6.522[/C][C]0[/C][/ROW]
[ROW][C]6[/C][C]0.69021[/C][C]6.3259[/C][C]0[/C][/ROW]
[ROW][C]7[/C][C]0.646882[/C][C]5.9288[/C][C]0[/C][/ROW]
[ROW][C]8[/C][C]0.614916[/C][C]5.6358[/C][C]0[/C][/ROW]
[ROW][C]9[/C][C]0.581369[/C][C]5.3283[/C][C]0[/C][/ROW]
[ROW][C]10[/C][C]0.576634[/C][C]5.2849[/C][C]0[/C][/ROW]
[ROW][C]11[/C][C]0.549978[/C][C]5.0406[/C][C]1e-06[/C][/ROW]
[ROW][C]12[/C][C]0.509335[/C][C]4.6681[/C][C]6e-06[/C][/ROW]
[ROW][C]13[/C][C]0.422664[/C][C]3.8738[/C][C]0.000106[/C][/ROW]
[ROW][C]14[/C][C]0.357104[/C][C]3.2729[/C][C]0.000773[/C][/ROW]
[ROW][C]15[/C][C]0.313753[/C][C]2.8756[/C][C]0.002554[/C][/ROW]
[ROW][C]16[/C][C]0.287793[/C][C]2.6377[/C][C]0.004972[/C][/ROW]
[ROW][C]17[/C][C]0.253432[/C][C]2.3227[/C][C]0.011306[/C][/ROW]
[ROW][C]18[/C][C]0.223011[/C][C]2.0439[/C][C]0.022047[/C][/ROW]
[ROW][C]19[/C][C]0.179351[/C][C]1.6438[/C][C]0.05198[/C][/ROW]
[ROW][C]20[/C][C]0.146281[/C][C]1.3407[/C][C]0.091818[/C][/ROW]
[ROW][C]21[/C][C]0.116925[/C][C]1.0716[/C][C]0.143478[/C][/ROW]
[ROW][C]22[/C][C]0.102921[/C][C]0.9433[/C][C]0.174119[/C][/ROW]
[ROW][C]23[/C][C]0.05915[/C][C]0.5421[/C][C]0.294586[/C][/ROW]
[ROW][C]24[/C][C]0.006072[/C][C]0.0556[/C][C]0.477877[/C][/ROW]
[ROW][C]25[/C][C]-0.062589[/C][C]-0.5736[/C][C]0.283873[/C][/ROW]
[ROW][C]26[/C][C]-0.107775[/C][C]-0.9878[/C][C]0.16305[/C][/ROW]
[ROW][C]27[/C][C]-0.128527[/C][C]-1.178[/C][C]0.121068[/C][/ROW]
[ROW][C]28[/C][C]-0.138599[/C][C]-1.2703[/C][C]0.103745[/C][/ROW]
[ROW][C]29[/C][C]-0.159638[/C][C]-1.4631[/C][C]0.073585[/C][/ROW]
[ROW][C]30[/C][C]-0.180526[/C][C]-1.6545[/C][C]0.050874[/C][/ROW]
[ROW][C]31[/C][C]-0.202503[/C][C]-1.856[/C][C]0.033482[/C][/ROW]
[ROW][C]32[/C][C]-0.219554[/C][C]-2.0122[/C][C]0.023699[/C][/ROW]
[ROW][C]33[/C][C]-0.230613[/C][C]-2.1136[/C][C]0.018758[/C][/ROW]
[ROW][C]34[/C][C]-0.248812[/C][C]-2.2804[/C][C]0.012558[/C][/ROW]
[ROW][C]35[/C][C]-0.290448[/C][C]-2.662[/C][C]0.004653[/C][/ROW]
[ROW][C]36[/C][C]-0.328818[/C][C]-3.0137[/C][C]0.001706[/C][/ROW]
[ROW][C]37[/C][C]-0.358229[/C][C]-3.2832[/C][C]0.000748[/C][/ROW]
[ROW][C]38[/C][C]-0.379036[/C][C]-3.4739[/C][C]0.000407[/C][/ROW]
[ROW][C]39[/C][C]-0.368825[/C][C]-3.3803[/C][C]0.00055[/C][/ROW]
[ROW][C]40[/C][C]-0.353182[/C][C]-3.237[/C][C]0.000865[/C][/ROW]
[ROW][C]41[/C][C]-0.338531[/C][C]-3.1027[/C][C]0.001306[/C][/ROW]
[ROW][C]42[/C][C]-0.339326[/C][C]-3.11[/C][C]0.001278[/C][/ROW]
[ROW][C]43[/C][C]-0.332772[/C][C]-3.0499[/C][C]0.001531[/C][/ROW]
[ROW][C]44[/C][C]-0.325132[/C][C]-2.9799[/C][C]0.001885[/C][/ROW]
[ROW][C]45[/C][C]-0.318189[/C][C]-2.9163[/C][C]0.002271[/C][/ROW]
[ROW][C]46[/C][C]-0.326267[/C][C]-2.9903[/C][C]0.001828[/C][/ROW]
[ROW][C]47[/C][C]-0.340189[/C][C]-3.1179[/C][C]0.001247[/C][/ROW]
[ROW][C]48[/C][C]-0.358999[/C][C]-3.2903[/C][C]0.000732[/C][/ROW]
[ROW][C]49[/C][C]-0.357963[/C][C]-3.2808[/C][C]0.000754[/C][/ROW]
[ROW][C]50[/C][C]-0.34393[/C][C]-3.1522[/C][C]0.001124[/C][/ROW]
[ROW][C]51[/C][C]-0.308658[/C][C]-2.8289[/C][C]0.00292[/C][/ROW]
[ROW][C]52[/C][C]-0.282[/C][C]-2.5846[/C][C]0.005739[/C][/ROW]
[ROW][C]53[/C][C]-0.260742[/C][C]-2.3897[/C][C]0.009549[/C][/ROW]
[ROW][C]54[/C][C]-0.255561[/C][C]-2.3423[/C][C]0.010767[/C][/ROW]
[ROW][C]55[/C][C]-0.234592[/C][C]-2.1501[/C][C]0.017212[/C][/ROW]
[ROW][C]56[/C][C]-0.203553[/C][C]-1.8656[/C][C]0.032794[/C][/ROW]
[ROW][C]57[/C][C]-0.183173[/C][C]-1.6788[/C][C]0.048453[/C][/ROW]
[ROW][C]58[/C][C]-0.179977[/C][C]-1.6495[/C][C]0.051388[/C][/ROW]
[ROW][C]59[/C][C]-0.176507[/C][C]-1.6177[/C][C]0.054737[/C][/ROW]
[ROW][C]60[/C][C]-0.166692[/C][C]-1.5278[/C][C]0.065165[/C][/ROW]
[/TABLE]
Source: https://freestatistics.org/blog/index.php?pk=78179&T=1

Globally Unique Identifier (entire table): ba.freestatistics.org/blog/index.php?pk=78179&T=1

As an alternative you can also use a QR Code:  

The GUIDs for individual cells are displayed in the table below:

Autocorrelation Function
Time lag kACF(k)T-STATP-value
10.9180028.41360
20.8475227.76770
30.7873247.21590
40.7571956.93980
50.7116056.5220
60.690216.32590
70.6468825.92880
80.6149165.63580
90.5813695.32830
100.5766345.28490
110.5499785.04061e-06
120.5093354.66816e-06
130.4226643.87380.000106
140.3571043.27290.000773
150.3137532.87560.002554
160.2877932.63770.004972
170.2534322.32270.011306
180.2230112.04390.022047
190.1793511.64380.05198
200.1462811.34070.091818
210.1169251.07160.143478
220.1029210.94330.174119
230.059150.54210.294586
240.0060720.05560.477877
25-0.062589-0.57360.283873
26-0.107775-0.98780.16305
27-0.128527-1.1780.121068
28-0.138599-1.27030.103745
29-0.159638-1.46310.073585
30-0.180526-1.65450.050874
31-0.202503-1.8560.033482
32-0.219554-2.01220.023699
33-0.230613-2.11360.018758
34-0.248812-2.28040.012558
35-0.290448-2.6620.004653
36-0.328818-3.01370.001706
37-0.358229-3.28320.000748
38-0.379036-3.47390.000407
39-0.368825-3.38030.00055
40-0.353182-3.2370.000865
41-0.338531-3.10270.001306
42-0.339326-3.110.001278
43-0.332772-3.04990.001531
44-0.325132-2.97990.001885
45-0.318189-2.91630.002271
46-0.326267-2.99030.001828
47-0.340189-3.11790.001247
48-0.358999-3.29030.000732
49-0.357963-3.28080.000754
50-0.34393-3.15220.001124
51-0.308658-2.82890.00292
52-0.282-2.58460.005739
53-0.260742-2.38970.009549
54-0.255561-2.34230.010767
55-0.234592-2.15010.017212
56-0.203553-1.86560.032794
57-0.183173-1.67880.048453
58-0.179977-1.64950.051388
59-0.176507-1.61770.054737
60-0.166692-1.52780.065165


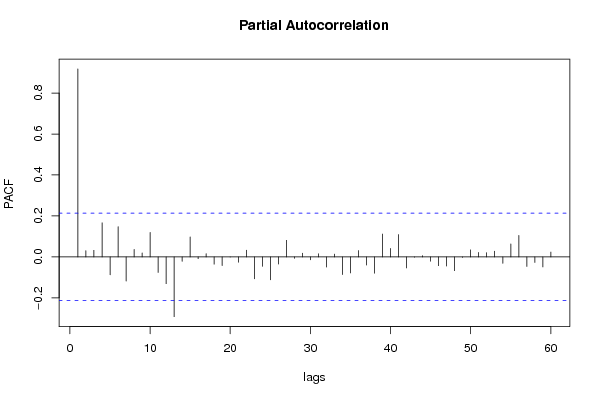
Partial Autocorrelation Function
Time lag kPACF(k)T-STATP-value
10.9180028.41360
20.0304870.27940.390305
30.0320110.29340.384976
40.1666311.52720.065234
5-0.08772-0.8040.211844
60.1474971.35180.09003
7-0.118094-1.08240.141097
80.0365630.33510.369189
90.0194810.17850.429363
100.1191461.0920.138979
11-0.075864-0.69530.244392
12-0.130727-1.19810.117118
13-0.291979-2.6760.004478
14-0.021851-0.20030.420878
150.0976310.89480.186725
16-0.008629-0.07910.468574
170.015360.14080.444193
18-0.036019-0.33010.371065
19-0.042452-0.38910.349103
20-0.000911-0.00840.496679
21-0.026144-0.23960.405606
220.0326560.29930.382725
23-0.106954-0.98030.164888
24-0.046142-0.42290.336725
25-0.112301-1.02930.153157
26-0.035312-0.32360.373507
270.0811670.74390.229505
28-0.006819-0.06250.475159
290.018080.16570.434392
30-0.014464-0.13260.447428
310.0147470.13520.446403
32-0.049753-0.4560.324785
330.0134560.12330.45107
34-0.086368-0.79160.215418
35-0.078324-0.71790.237419
360.0307050.28140.389543
37-0.040161-0.36810.356868
38-0.079832-0.73170.233204
390.1117191.02390.154406
400.0413930.37940.352683
410.1091861.00070.159921
42-0.054009-0.4950.310945
43-0.001416-0.0130.494838
440.0057360.05260.479101
45-0.021019-0.19260.423853
46-0.042812-0.39240.347887
47-0.044629-0.4090.341777
48-0.067483-0.61850.268964
49-0.002655-0.02430.490321
500.0342130.31360.377314
510.0215670.19770.421894
520.0207720.19040.424738
530.0281250.25780.398609
54-0.031208-0.2860.38778
550.0630540.57790.282438
560.1049010.96140.169546
57-0.04657-0.42680.3353
58-0.027141-0.24870.402081
59-0.049407-0.45280.325921
600.023490.21530.415033

\begin{tabular}{lllllllll}
\hline
Partial Autocorrelation Function \tabularnewline
Time lag k & PACF(k) & T-STAT & P-value \tabularnewline
1 & 0.918002 & 8.4136 & 0 \tabularnewline
2 & 0.030487 & 0.2794 & 0.390305 \tabularnewline
3 & 0.032011 & 0.2934 & 0.384976 \tabularnewline
4 & 0.166631 & 1.5272 & 0.065234 \tabularnewline
5 & -0.08772 & -0.804 & 0.211844 \tabularnewline
6 & 0.147497 & 1.3518 & 0.09003 \tabularnewline
7 & -0.118094 & -1.0824 & 0.141097 \tabularnewline
8 & 0.036563 & 0.3351 & 0.369189 \tabularnewline
9 & 0.019481 & 0.1785 & 0.429363 \tabularnewline
10 & 0.119146 & 1.092 & 0.138979 \tabularnewline
11 & -0.075864 & -0.6953 & 0.244392 \tabularnewline
12 & -0.130727 & -1.1981 & 0.117118 \tabularnewline
13 & -0.291979 & -2.676 & 0.004478 \tabularnewline
14 & -0.021851 & -0.2003 & 0.420878 \tabularnewline
15 & 0.097631 & 0.8948 & 0.186725 \tabularnewline
16 & -0.008629 & -0.0791 & 0.468574 \tabularnewline
17 & 0.01536 & 0.1408 & 0.444193 \tabularnewline
18 & -0.036019 & -0.3301 & 0.371065 \tabularnewline
19 & -0.042452 & -0.3891 & 0.349103 \tabularnewline
20 & -0.000911 & -0.0084 & 0.496679 \tabularnewline
21 & -0.026144 & -0.2396 & 0.405606 \tabularnewline
22 & 0.032656 & 0.2993 & 0.382725 \tabularnewline
23 & -0.106954 & -0.9803 & 0.164888 \tabularnewline
24 & -0.046142 & -0.4229 & 0.336725 \tabularnewline
25 & -0.112301 & -1.0293 & 0.153157 \tabularnewline
26 & -0.035312 & -0.3236 & 0.373507 \tabularnewline
27 & 0.081167 & 0.7439 & 0.229505 \tabularnewline
28 & -0.006819 & -0.0625 & 0.475159 \tabularnewline
29 & 0.01808 & 0.1657 & 0.434392 \tabularnewline
30 & -0.014464 & -0.1326 & 0.447428 \tabularnewline
31 & 0.014747 & 0.1352 & 0.446403 \tabularnewline
32 & -0.049753 & -0.456 & 0.324785 \tabularnewline
33 & 0.013456 & 0.1233 & 0.45107 \tabularnewline
34 & -0.086368 & -0.7916 & 0.215418 \tabularnewline
35 & -0.078324 & -0.7179 & 0.237419 \tabularnewline
36 & 0.030705 & 0.2814 & 0.389543 \tabularnewline
37 & -0.040161 & -0.3681 & 0.356868 \tabularnewline
38 & -0.079832 & -0.7317 & 0.233204 \tabularnewline
39 & 0.111719 & 1.0239 & 0.154406 \tabularnewline
40 & 0.041393 & 0.3794 & 0.352683 \tabularnewline
41 & 0.109186 & 1.0007 & 0.159921 \tabularnewline
42 & -0.054009 & -0.495 & 0.310945 \tabularnewline
43 & -0.001416 & -0.013 & 0.494838 \tabularnewline
44 & 0.005736 & 0.0526 & 0.479101 \tabularnewline
45 & -0.021019 & -0.1926 & 0.423853 \tabularnewline
46 & -0.042812 & -0.3924 & 0.347887 \tabularnewline
47 & -0.044629 & -0.409 & 0.341777 \tabularnewline
48 & -0.067483 & -0.6185 & 0.268964 \tabularnewline
49 & -0.002655 & -0.0243 & 0.490321 \tabularnewline
50 & 0.034213 & 0.3136 & 0.377314 \tabularnewline
51 & 0.021567 & 0.1977 & 0.421894 \tabularnewline
52 & 0.020772 & 0.1904 & 0.424738 \tabularnewline
53 & 0.028125 & 0.2578 & 0.398609 \tabularnewline
54 & -0.031208 & -0.286 & 0.38778 \tabularnewline
55 & 0.063054 & 0.5779 & 0.282438 \tabularnewline
56 & 0.104901 & 0.9614 & 0.169546 \tabularnewline
57 & -0.04657 & -0.4268 & 0.3353 \tabularnewline
58 & -0.027141 & -0.2487 & 0.402081 \tabularnewline
59 & -0.049407 & -0.4528 & 0.325921 \tabularnewline
60 & 0.02349 & 0.2153 & 0.415033 \tabularnewline
\hline
\end{tabular}
%Source: https://freestatistics.org/blog/index.php?pk=78179&T=2

[TABLE]
[ROW][C]Partial Autocorrelation Function[/C][/ROW]
[ROW][C]Time lag k[/C][C]PACF(k)[/C][C]T-STAT[/C][C]P-value[/C][/ROW]
[ROW][C]1[/C][C]0.918002[/C][C]8.4136[/C][C]0[/C][/ROW]
[ROW][C]2[/C][C]0.030487[/C][C]0.2794[/C][C]0.390305[/C][/ROW]
[ROW][C]3[/C][C]0.032011[/C][C]0.2934[/C][C]0.384976[/C][/ROW]
[ROW][C]4[/C][C]0.166631[/C][C]1.5272[/C][C]0.065234[/C][/ROW]
[ROW][C]5[/C][C]-0.08772[/C][C]-0.804[/C][C]0.211844[/C][/ROW]
[ROW][C]6[/C][C]0.147497[/C][C]1.3518[/C][C]0.09003[/C][/ROW]
[ROW][C]7[/C][C]-0.118094[/C][C]-1.0824[/C][C]0.141097[/C][/ROW]
[ROW][C]8[/C][C]0.036563[/C][C]0.3351[/C][C]0.369189[/C][/ROW]
[ROW][C]9[/C][C]0.019481[/C][C]0.1785[/C][C]0.429363[/C][/ROW]
[ROW][C]10[/C][C]0.119146[/C][C]1.092[/C][C]0.138979[/C][/ROW]
[ROW][C]11[/C][C]-0.075864[/C][C]-0.6953[/C][C]0.244392[/C][/ROW]
[ROW][C]12[/C][C]-0.130727[/C][C]-1.1981[/C][C]0.117118[/C][/ROW]
[ROW][C]13[/C][C]-0.291979[/C][C]-2.676[/C][C]0.004478[/C][/ROW]
[ROW][C]14[/C][C]-0.021851[/C][C]-0.2003[/C][C]0.420878[/C][/ROW]
[ROW][C]15[/C][C]0.097631[/C][C]0.8948[/C][C]0.186725[/C][/ROW]
[ROW][C]16[/C][C]-0.008629[/C][C]-0.0791[/C][C]0.468574[/C][/ROW]
[ROW][C]17[/C][C]0.01536[/C][C]0.1408[/C][C]0.444193[/C][/ROW]
[ROW][C]18[/C][C]-0.036019[/C][C]-0.3301[/C][C]0.371065[/C][/ROW]
[ROW][C]19[/C][C]-0.042452[/C][C]-0.3891[/C][C]0.349103[/C][/ROW]
[ROW][C]20[/C][C]-0.000911[/C][C]-0.0084[/C][C]0.496679[/C][/ROW]
[ROW][C]21[/C][C]-0.026144[/C][C]-0.2396[/C][C]0.405606[/C][/ROW]
[ROW][C]22[/C][C]0.032656[/C][C]0.2993[/C][C]0.382725[/C][/ROW]
[ROW][C]23[/C][C]-0.106954[/C][C]-0.9803[/C][C]0.164888[/C][/ROW]
[ROW][C]24[/C][C]-0.046142[/C][C]-0.4229[/C][C]0.336725[/C][/ROW]
[ROW][C]25[/C][C]-0.112301[/C][C]-1.0293[/C][C]0.153157[/C][/ROW]
[ROW][C]26[/C][C]-0.035312[/C][C]-0.3236[/C][C]0.373507[/C][/ROW]
[ROW][C]27[/C][C]0.081167[/C][C]0.7439[/C][C]0.229505[/C][/ROW]
[ROW][C]28[/C][C]-0.006819[/C][C]-0.0625[/C][C]0.475159[/C][/ROW]
[ROW][C]29[/C][C]0.01808[/C][C]0.1657[/C][C]0.434392[/C][/ROW]
[ROW][C]30[/C][C]-0.014464[/C][C]-0.1326[/C][C]0.447428[/C][/ROW]
[ROW][C]31[/C][C]0.014747[/C][C]0.1352[/C][C]0.446403[/C][/ROW]
[ROW][C]32[/C][C]-0.049753[/C][C]-0.456[/C][C]0.324785[/C][/ROW]
[ROW][C]33[/C][C]0.013456[/C][C]0.1233[/C][C]0.45107[/C][/ROW]
[ROW][C]34[/C][C]-0.086368[/C][C]-0.7916[/C][C]0.215418[/C][/ROW]
[ROW][C]35[/C][C]-0.078324[/C][C]-0.7179[/C][C]0.237419[/C][/ROW]
[ROW][C]36[/C][C]0.030705[/C][C]0.2814[/C][C]0.389543[/C][/ROW]
[ROW][C]37[/C][C]-0.040161[/C][C]-0.3681[/C][C]0.356868[/C][/ROW]
[ROW][C]38[/C][C]-0.079832[/C][C]-0.7317[/C][C]0.233204[/C][/ROW]
[ROW][C]39[/C][C]0.111719[/C][C]1.0239[/C][C]0.154406[/C][/ROW]
[ROW][C]40[/C][C]0.041393[/C][C]0.3794[/C][C]0.352683[/C][/ROW]
[ROW][C]41[/C][C]0.109186[/C][C]1.0007[/C][C]0.159921[/C][/ROW]
[ROW][C]42[/C][C]-0.054009[/C][C]-0.495[/C][C]0.310945[/C][/ROW]
[ROW][C]43[/C][C]-0.001416[/C][C]-0.013[/C][C]0.494838[/C][/ROW]
[ROW][C]44[/C][C]0.005736[/C][C]0.0526[/C][C]0.479101[/C][/ROW]
[ROW][C]45[/C][C]-0.021019[/C][C]-0.1926[/C][C]0.423853[/C][/ROW]
[ROW][C]46[/C][C]-0.042812[/C][C]-0.3924[/C][C]0.347887[/C][/ROW]
[ROW][C]47[/C][C]-0.044629[/C][C]-0.409[/C][C]0.341777[/C][/ROW]
[ROW][C]48[/C][C]-0.067483[/C][C]-0.6185[/C][C]0.268964[/C][/ROW]
[ROW][C]49[/C][C]-0.002655[/C][C]-0.0243[/C][C]0.490321[/C][/ROW]
[ROW][C]50[/C][C]0.034213[/C][C]0.3136[/C][C]0.377314[/C][/ROW]
[ROW][C]51[/C][C]0.021567[/C][C]0.1977[/C][C]0.421894[/C][/ROW]
[ROW][C]52[/C][C]0.020772[/C][C]0.1904[/C][C]0.424738[/C][/ROW]
[ROW][C]53[/C][C]0.028125[/C][C]0.2578[/C][C]0.398609[/C][/ROW]
[ROW][C]54[/C][C]-0.031208[/C][C]-0.286[/C][C]0.38778[/C][/ROW]
[ROW][C]55[/C][C]0.063054[/C][C]0.5779[/C][C]0.282438[/C][/ROW]
[ROW][C]56[/C][C]0.104901[/C][C]0.9614[/C][C]0.169546[/C][/ROW]
[ROW][C]57[/C][C]-0.04657[/C][C]-0.4268[/C][C]0.3353[/C][/ROW]
[ROW][C]58[/C][C]-0.027141[/C][C]-0.2487[/C][C]0.402081[/C][/ROW]
[ROW][C]59[/C][C]-0.049407[/C][C]-0.4528[/C][C]0.325921[/C][/ROW]
[ROW][C]60[/C][C]0.02349[/C][C]0.2153[/C][C]0.415033[/C][/ROW]
[/TABLE]
Source: https://freestatistics.org/blog/index.php?pk=78179&T=2

Globally Unique Identifier (entire table): ba.freestatistics.org/blog/index.php?pk=78179&T=2

As an alternative you can also use a QR Code:  

The GUIDs for individual cells are displayed in the table below:

Partial Autocorrelation Function
Time lag kPACF(k)T-STATP-value
10.9180028.41360
20.0304870.27940.390305
30.0320110.29340.384976
40.1666311.52720.065234
5-0.08772-0.8040.211844
60.1474971.35180.09003
7-0.118094-1.08240.141097
80.0365630.33510.369189
90.0194810.17850.429363
100.1191461.0920.138979
11-0.075864-0.69530.244392
12-0.130727-1.19810.117118
13-0.291979-2.6760.004478
14-0.021851-0.20030.420878
150.0976310.89480.186725
16-0.008629-0.07910.468574
170.015360.14080.444193
18-0.036019-0.33010.371065
19-0.042452-0.38910.349103
20-0.000911-0.00840.496679
21-0.026144-0.23960.405606
220.0326560.29930.382725
23-0.106954-0.98030.164888
24-0.046142-0.42290.336725
25-0.112301-1.02930.153157
26-0.035312-0.32360.373507
270.0811670.74390.229505
28-0.006819-0.06250.475159
290.018080.16570.434392
30-0.014464-0.13260.447428
310.0147470.13520.446403
32-0.049753-0.4560.324785
330.0134560.12330.45107
34-0.086368-0.79160.215418
35-0.078324-0.71790.237419
360.0307050.28140.389543
37-0.040161-0.36810.356868
38-0.079832-0.73170.233204
390.1117191.02390.154406
400.0413930.37940.352683
410.1091861.00070.159921
42-0.054009-0.4950.310945
43-0.001416-0.0130.494838
440.0057360.05260.479101
45-0.021019-0.19260.423853
46-0.042812-0.39240.347887
47-0.044629-0.4090.341777
48-0.067483-0.61850.268964
49-0.002655-0.02430.490321
500.0342130.31360.377314
510.0215670.19770.421894
520.0207720.19040.424738
530.0281250.25780.398609
54-0.031208-0.2860.38778
550.0630540.57790.282438
560.1049010.96140.169546
57-0.04657-0.42680.3353
58-0.027141-0.24870.402081
59-0.049407-0.45280.325921
600.023490.21530.415033


Parameters (Session):
par1 = 60 ; par2 = 1 ; par3 = 0 ; par4 = 0 ; par5 = 12 ; par6 = White Noise ; par7 = 0.95 ;
Parameters (R input):
par1 = 60 ; par2 = 1 ; par3 = 0 ; par4 = 0 ; par5 = 12 ; par6 = White Noise ; par7 = 0.95 ;
R code (references can be found in the software module):
if (par1 == 'Default') {
par1 = 10*log10(length(x))
} else {
par1 <- as.numeric(par1)
}
par2 <- as.numeric(par2)
par3 <- as.numeric(par3)
par4 <- as.numeric(par4)
par5 <- as.numeric(par5)
if (par6 == 'White Noise') par6 <- 'white' else par6 <- 'ma'
par7 <- as.numeric(par7)
if (par2 == 0) {
x <- log(x)
} else {
x <- (x ^ par2 - 1) / par2
}
if (par3 > 0) x <- diff(x,lag=1,difference=par3)
if (par4 > 0) x <- diff(x,lag=par5,difference=par4)
bitmap(file='pic1.png')
racf <- acf(x, par1, main='Autocorrelation', xlab='time lag', ylab='ACF', ci.type=par6, ci=par7, sub=paste('(lambda=',par2,', d=',par3,', D=',par4,', CI=', par7, ', CI type=',par6,')',sep=''))
dev.off()
bitmap(file='pic2.png')
rpacf <- pacf(x,par1,main='Partial Autocorrelation',xlab='lags',ylab='PACF')
dev.off()
(myacf <- c(racf$acf))
(mypacf <- c(rpacf$acf))
lengthx <- length(x)
sqrtn <- sqrt(lengthx)
load(file='createtable')
a<-table.start()
a<-table.row.start(a)
a<-table.element(a,'Autocorrelation Function',4,TRUE)
a<-table.row.end(a)
a<-table.row.start(a)
a<-table.element(a,'Time lag k',header=TRUE)
a<-table.element(a,hyperlink('basics.htm','ACF(k)','click here for more information about the Autocorrelation Function'),header=TRUE)
a<-table.element(a,'T-STAT',header=TRUE)
a<-table.element(a,'P-value',header=TRUE)
a<-table.row.end(a)
for (i in 2:(par1+1)) {
a<-table.row.start(a)
a<-table.element(a,i-1,header=TRUE)
a<-table.element(a,round(myacf[i],6))
mytstat <- myacf[i]*sqrtn
a<-table.element(a,round(mytstat,4))
a<-table.element(a,round(1-pt(abs(mytstat),lengthx),6))
a<-table.row.end(a)
}
a<-table.end(a)
table.save(a,file='mytable.tab')
a<-table.start()
a<-table.row.start(a)
a<-table.element(a,'Partial Autocorrelation Function',4,TRUE)
a<-table.row.end(a)
a<-table.row.start(a)
a<-table.element(a,'Time lag k',header=TRUE)
a<-table.element(a,hyperlink('basics.htm','PACF(k)','click here for more information about the Partial Autocorrelation Function'),header=TRUE)
a<-table.element(a,'T-STAT',header=TRUE)
a<-table.element(a,'P-value',header=TRUE)
a<-table.row.end(a)
for (i in 1:par1) {
a<-table.row.start(a)
a<-table.element(a,i,header=TRUE)
a<-table.element(a,round(mypacf[i],6))
mytstat <- mypacf[i]*sqrtn
a<-table.element(a,round(mytstat,4))
a<-table.element(a,round(1-pt(abs(mytstat),lengthx),6))
a<-table.row.end(a)
}
a<-table.end(a)
table.save(a,file='mytable1.tab')