Free Statistics

of Irreproducible Research!

Author's title

Author*Unverified author*
R Software Modulerwasp_centraltendency.wasp
Title produced by softwareCentral Tendency
Date of computationWed, 28 Jul 2010 19:16:26 +0000
Cite this page as followsStatistical Computations at FreeStatistics.org, Office for Research Development and Education, URL https://freestatistics.org/blog/index.php?v=date/2010/Jul/28/t1280344613vjgym85q5hdsdlx.htm/, Retrieved Mon, 29 Apr 2024 13:41:36 +0000
Statistical Computations at FreeStatistics.org, Office for Research Development and Education, URL https://freestatistics.org/blog/index.php?pk=78155, Retrieved Mon, 29 Apr 2024 13:41:36 +0000
QR Codes:

Original text written by user:
IsPrivate?No (this computation is public)
User-defined keywordsPatrick Fieremans
Estimated Impact208
Family? (F = Feedback message, R = changed R code, M = changed R Module, P = changed Parameters, D = changed Data)
-       [Central Tendency] [Tijdreeks 2 - Stap 9] [2010-07-28 19:16:26] [bffa0fb6afa860209dcefcd4361c2008] [Current]
Feedback Forum

Post a new message
Dataseries X:
259
258
257
255
253
252
253
255
256
256
257
259
267
263
266
257
249
249
251
252
252
252
256
257
259
260
261
253
243
233
241
239
233
228
228
227
225
230
222
207
190
184
192
187
173
167
163
156
153
157
152
128
115
114
136
132
126
124
123
119
105
107
108
92
74
73
100
97
99
102
99
103
92
99
97
87
69
66
95
91
93
99
91
91


Summary of computational transaction
Raw Inputview raw input (R code)
Raw Outputview raw output of R engine
Computing time2 seconds
R Server'George Udny Yule' @ 72.249.76.132

\begin{tabular}{lllllllll}
\hline
Summary of computational transaction \tabularnewline
Raw Input & view raw input (R code)  \tabularnewline
Raw Output & view raw output of R engine  \tabularnewline
Computing time & 2 seconds \tabularnewline
R Server & 'George Udny Yule' @ 72.249.76.132 \tabularnewline
\hline
\end{tabular}
%Source: https://freestatistics.org/blog/index.php?pk=78155&T=0

[TABLE]
[ROW][C]Summary of computational transaction[/C][/ROW]
[ROW][C]Raw Input[/C][C]view raw input (R code) [/C][/ROW]
[ROW][C]Raw Output[/C][C]view raw output of R engine [/C][/ROW]
[ROW][C]Computing time[/C][C]2 seconds[/C][/ROW]
[ROW][C]R Server[/C][C]'George Udny Yule' @ 72.249.76.132[/C][/ROW]
[/TABLE]
Source: https://freestatistics.org/blog/index.php?pk=78155&T=0

Globally Unique Identifier (entire table): ba.freestatistics.org/blog/index.php?pk=78155&T=0

As an alternative you can also use a QR Code:  

The GUIDs for individual cells are displayed in the table below:

Summary of computational transaction
Raw Inputview raw input (R code)
Raw Outputview raw output of R engine
Computing time2 seconds
R Server'George Udny Yule' @ 72.249.76.132


Central Tendency - Ungrouped Data
MeasureValueS.E.Value/S.E.
Arithmetic Mean180.3571428571437.6785057169398723.4885731033903
Geometric Mean165.034136285773
Harmonic Mean149.346915139109
Quadratic Mean193.448528899378
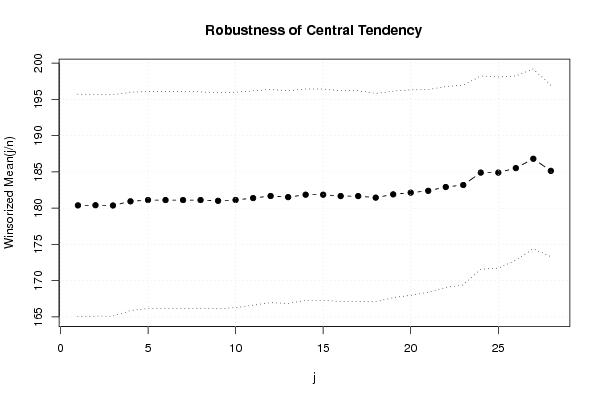
Winsorized Mean ( 1 / 28 )180.3809523809527.6705677064450723.5159846421002
Winsorized Mean ( 2 / 28 )180.4047619047627.6447237503051323.5985979084674
Winsorized Mean ( 3 / 28 )180.3690476190487.6295049568729723.6409896367606
Winsorized Mean ( 4 / 28 )180.9404761904767.5248746268544924.045646627087
Winsorized Mean ( 5 / 28 )181.1190476190487.4821916086448424.2066839627289
Winsorized Mean ( 6 / 28 )181.1190476190487.4821916086448424.2066839627289
Winsorized Mean ( 7 / 28 )181.1190476190487.4821916086448424.2066839627289
Winsorized Mean ( 8 / 28 )181.1190476190487.4565369974044724.2899683434942
Winsorized Mean ( 9 / 28 )181.0119047619057.4432928690369824.3187938385292
Winsorized Mean ( 10 / 28 )181.1309523809527.4262057067945924.3907803705501
Winsorized Mean ( 11 / 28 )181.3928571428577.3890341028691224.5489267768332
Winsorized Mean ( 12 / 28 )181.6785714285717.34907741260724.7212760498223
Winsorized Mean ( 13 / 28 )181.5238095238107.3300495214521624.7643360379164
Winsorized Mean ( 14 / 28 )181.8571428571437.2840519854526424.966480637472
Winsorized Mean ( 15 / 28 )181.8571428571437.2840519854526424.966480637472
Winsorized Mean ( 16 / 28 )181.6666666666677.2607830929305125.0202580550226
Winsorized Mean ( 17 / 28 )181.6666666666677.2607830929305125.0202580550226
Winsorized Mean ( 18 / 28 )181.4523809523817.1796351881453625.2732034702802
Winsorized Mean ( 19 / 28 )181.9047619047627.1181250925322525.5551510461092
Winsorized Mean ( 20 / 28 )182.1428571428577.0860043802700825.7045927956249
Winsorized Mean ( 21 / 28 )182.3928571428576.9889474635767126.0973284022248
Winsorized Mean ( 22 / 28 )182.9166666666676.919382679455926.4354025699082
Winsorized Mean ( 23 / 28 )183.1904761904766.88326723376226.6138840712065
Winsorized Mean ( 24 / 28 )184.9047619047626.660473723838127.7615030959405
Winsorized Mean ( 25 / 28 )184.9047619047626.5863046385381528.0741283697746
Winsorized Mean ( 26 / 28 )185.5238095238106.3543633436181829.1962859993102
Winsorized Mean ( 27 / 28 )186.8095238095246.1934643478721830.1623636331585
Winsorized Mean ( 28 / 28 )185.1428571428575.9130761981729631.3107511112512
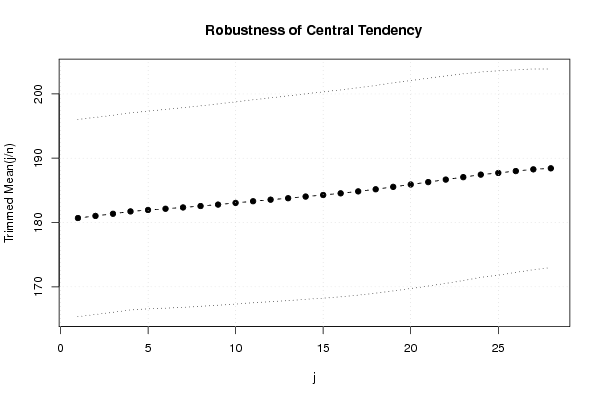
Trimmed Mean ( 1 / 28 )180.6951219512207.6673478552175323.5668350208291
Trimmed Mean ( 2 / 28 )181.0257.6587621492136623.6363261416319
Trimmed Mean ( 3 / 28 )181.3589743589747.6589815329152323.6792546867447
Trimmed Mean ( 4 / 28 )181.7236842105267.6597970447257723.7243471529907
Trimmed Mean ( 5 / 28 )181.9459459459467.688514248432523.6646431373969
Trimmed Mean ( 6 / 28 )182.1388888888897.7257193362648723.5756543774404
Trimmed Mean ( 7 / 28 )182.3428571428577.7606771628910923.4957405540277
Trimmed Mean ( 8 / 28 )182.5588235294127.792845324946123.4264656767937
Trimmed Mean ( 9 / 28 )182.7878787878797.8265436572232823.3548660549769
Trimmed Mean ( 10 / 28 )183.0468757.8589509455166923.2915151486501
Trimmed Mean ( 11 / 28 )183.3064516129037.890163122071823.2322765419292
Trimmed Mean ( 12 / 28 )183.557.922913384429723.1669830394356
Trimmed Mean ( 13 / 28 )183.7758620689667.9571995997920423.0955450801773
Trimmed Mean ( 14 / 28 )184.0357142857147.9889519608195223.0362774977602
Trimmed Mean ( 15 / 28 )184.2777777777788.0216956278208122.9724220822673
Trimmed Mean ( 16 / 28 )184.5384615384628.0473458305135322.931593276225
Trimmed Mean ( 17 / 28 )184.848.0674887982695122.9117144903441
Trimmed Mean ( 18 / 28 )185.1666666666678.0765581754962322.9264326020025
Trimmed Mean ( 19 / 28 )185.5434782608708.084679046610622.9500116443901
Trimmed Mean ( 20 / 28 )185.9090909090918.0879035679552722.9860667040682
Trimmed Mean ( 21 / 28 )186.2857142857148.0785405440618323.0593277671478
Trimmed Mean ( 22 / 28 )186.6758.0642760417115623.1483891467064
Trimmed Mean ( 23 / 28 )187.0526315789478.0375140499421323.2724484730816
Trimmed Mean ( 24 / 28 )187.4444444444447.9859444427052823.4717941990774
Trimmed Mean ( 25 / 28 )187.7058823529417.9432624183192423.6308298111922
Trimmed Mean ( 26 / 28 )1887.8736237916796123.8771885695971
Trimmed Mean ( 27 / 28 )188.2666666666677.8061180446623524.1178349583631
Trimmed Mean ( 28 / 28 )188.4285714285717.7207253153647224.4055530707182
Median188.5
Midrange166.5
Midmean - Weighted Average at Xnp184.348837209302
Midmean - Weighted Average at X(n+1)p186.285714285714
Midmean - Empirical Distribution Function184.348837209302
Midmean - Empirical Distribution Function - Averaging186.285714285714
Midmean - Empirical Distribution Function - Interpolation186.285714285714
Midmean - Closest Observation184.348837209302
Midmean - True Basic - Statistics Graphics Toolkit186.285714285714
Midmean - MS Excel (old versions)188.826086956522
Number of observations84

\begin{tabular}{lllllllll}
\hline
Central Tendency - Ungrouped Data \tabularnewline
Measure & Value & S.E. & Value/S.E. \tabularnewline
Arithmetic Mean & 180.357142857143 & 7.67850571693987 & 23.4885731033903 \tabularnewline
Geometric Mean & 165.034136285773 &  &  \tabularnewline
Harmonic Mean & 149.346915139109 &  &  \tabularnewline
Quadratic Mean & 193.448528899378 &  &  \tabularnewline
Winsorized Mean ( 1 / 28 ) & 180.380952380952 & 7.67056770644507 & 23.5159846421002 \tabularnewline
Winsorized Mean ( 2 / 28 ) & 180.404761904762 & 7.64472375030513 & 23.5985979084674 \tabularnewline
Winsorized Mean ( 3 / 28 ) & 180.369047619048 & 7.62950495687297 & 23.6409896367606 \tabularnewline
Winsorized Mean ( 4 / 28 ) & 180.940476190476 & 7.52487462685449 & 24.045646627087 \tabularnewline
Winsorized Mean ( 5 / 28 ) & 181.119047619048 & 7.48219160864484 & 24.2066839627289 \tabularnewline
Winsorized Mean ( 6 / 28 ) & 181.119047619048 & 7.48219160864484 & 24.2066839627289 \tabularnewline
Winsorized Mean ( 7 / 28 ) & 181.119047619048 & 7.48219160864484 & 24.2066839627289 \tabularnewline
Winsorized Mean ( 8 / 28 ) & 181.119047619048 & 7.45653699740447 & 24.2899683434942 \tabularnewline
Winsorized Mean ( 9 / 28 ) & 181.011904761905 & 7.44329286903698 & 24.3187938385292 \tabularnewline
Winsorized Mean ( 10 / 28 ) & 181.130952380952 & 7.42620570679459 & 24.3907803705501 \tabularnewline
Winsorized Mean ( 11 / 28 ) & 181.392857142857 & 7.38903410286912 & 24.5489267768332 \tabularnewline
Winsorized Mean ( 12 / 28 ) & 181.678571428571 & 7.349077412607 & 24.7212760498223 \tabularnewline
Winsorized Mean ( 13 / 28 ) & 181.523809523810 & 7.33004952145216 & 24.7643360379164 \tabularnewline
Winsorized Mean ( 14 / 28 ) & 181.857142857143 & 7.28405198545264 & 24.966480637472 \tabularnewline
Winsorized Mean ( 15 / 28 ) & 181.857142857143 & 7.28405198545264 & 24.966480637472 \tabularnewline
Winsorized Mean ( 16 / 28 ) & 181.666666666667 & 7.26078309293051 & 25.0202580550226 \tabularnewline
Winsorized Mean ( 17 / 28 ) & 181.666666666667 & 7.26078309293051 & 25.0202580550226 \tabularnewline
Winsorized Mean ( 18 / 28 ) & 181.452380952381 & 7.17963518814536 & 25.2732034702802 \tabularnewline
Winsorized Mean ( 19 / 28 ) & 181.904761904762 & 7.11812509253225 & 25.5551510461092 \tabularnewline
Winsorized Mean ( 20 / 28 ) & 182.142857142857 & 7.08600438027008 & 25.7045927956249 \tabularnewline
Winsorized Mean ( 21 / 28 ) & 182.392857142857 & 6.98894746357671 & 26.0973284022248 \tabularnewline
Winsorized Mean ( 22 / 28 ) & 182.916666666667 & 6.9193826794559 & 26.4354025699082 \tabularnewline
Winsorized Mean ( 23 / 28 ) & 183.190476190476 & 6.883267233762 & 26.6138840712065 \tabularnewline
Winsorized Mean ( 24 / 28 ) & 184.904761904762 & 6.6604737238381 & 27.7615030959405 \tabularnewline
Winsorized Mean ( 25 / 28 ) & 184.904761904762 & 6.58630463853815 & 28.0741283697746 \tabularnewline
Winsorized Mean ( 26 / 28 ) & 185.523809523810 & 6.35436334361818 & 29.1962859993102 \tabularnewline
Winsorized Mean ( 27 / 28 ) & 186.809523809524 & 6.19346434787218 & 30.1623636331585 \tabularnewline
Winsorized Mean ( 28 / 28 ) & 185.142857142857 & 5.91307619817296 & 31.3107511112512 \tabularnewline
Trimmed Mean ( 1 / 28 ) & 180.695121951220 & 7.66734785521753 & 23.5668350208291 \tabularnewline
Trimmed Mean ( 2 / 28 ) & 181.025 & 7.65876214921366 & 23.6363261416319 \tabularnewline
Trimmed Mean ( 3 / 28 ) & 181.358974358974 & 7.65898153291523 & 23.6792546867447 \tabularnewline
Trimmed Mean ( 4 / 28 ) & 181.723684210526 & 7.65979704472577 & 23.7243471529907 \tabularnewline
Trimmed Mean ( 5 / 28 ) & 181.945945945946 & 7.6885142484325 & 23.6646431373969 \tabularnewline
Trimmed Mean ( 6 / 28 ) & 182.138888888889 & 7.72571933626487 & 23.5756543774404 \tabularnewline
Trimmed Mean ( 7 / 28 ) & 182.342857142857 & 7.76067716289109 & 23.4957405540277 \tabularnewline
Trimmed Mean ( 8 / 28 ) & 182.558823529412 & 7.7928453249461 & 23.4264656767937 \tabularnewline
Trimmed Mean ( 9 / 28 ) & 182.787878787879 & 7.82654365722328 & 23.3548660549769 \tabularnewline
Trimmed Mean ( 10 / 28 ) & 183.046875 & 7.85895094551669 & 23.2915151486501 \tabularnewline
Trimmed Mean ( 11 / 28 ) & 183.306451612903 & 7.8901631220718 & 23.2322765419292 \tabularnewline
Trimmed Mean ( 12 / 28 ) & 183.55 & 7.9229133844297 & 23.1669830394356 \tabularnewline
Trimmed Mean ( 13 / 28 ) & 183.775862068966 & 7.95719959979204 & 23.0955450801773 \tabularnewline
Trimmed Mean ( 14 / 28 ) & 184.035714285714 & 7.98895196081952 & 23.0362774977602 \tabularnewline
Trimmed Mean ( 15 / 28 ) & 184.277777777778 & 8.02169562782081 & 22.9724220822673 \tabularnewline
Trimmed Mean ( 16 / 28 ) & 184.538461538462 & 8.04734583051353 & 22.931593276225 \tabularnewline
Trimmed Mean ( 17 / 28 ) & 184.84 & 8.06748879826951 & 22.9117144903441 \tabularnewline
Trimmed Mean ( 18 / 28 ) & 185.166666666667 & 8.07655817549623 & 22.9264326020025 \tabularnewline
Trimmed Mean ( 19 / 28 ) & 185.543478260870 & 8.0846790466106 & 22.9500116443901 \tabularnewline
Trimmed Mean ( 20 / 28 ) & 185.909090909091 & 8.08790356795527 & 22.9860667040682 \tabularnewline
Trimmed Mean ( 21 / 28 ) & 186.285714285714 & 8.07854054406183 & 23.0593277671478 \tabularnewline
Trimmed Mean ( 22 / 28 ) & 186.675 & 8.06427604171156 & 23.1483891467064 \tabularnewline
Trimmed Mean ( 23 / 28 ) & 187.052631578947 & 8.03751404994213 & 23.2724484730816 \tabularnewline
Trimmed Mean ( 24 / 28 ) & 187.444444444444 & 7.98594444270528 & 23.4717941990774 \tabularnewline
Trimmed Mean ( 25 / 28 ) & 187.705882352941 & 7.94326241831924 & 23.6308298111922 \tabularnewline
Trimmed Mean ( 26 / 28 ) & 188 & 7.87362379167961 & 23.8771885695971 \tabularnewline
Trimmed Mean ( 27 / 28 ) & 188.266666666667 & 7.80611804466235 & 24.1178349583631 \tabularnewline
Trimmed Mean ( 28 / 28 ) & 188.428571428571 & 7.72072531536472 & 24.4055530707182 \tabularnewline
Median & 188.5 &  &  \tabularnewline
Midrange & 166.5 &  &  \tabularnewline
Midmean - Weighted Average at Xnp & 184.348837209302 &  &  \tabularnewline
Midmean - Weighted Average at X(n+1)p & 186.285714285714 &  &  \tabularnewline
Midmean - Empirical Distribution Function & 184.348837209302 &  &  \tabularnewline
Midmean - Empirical Distribution Function - Averaging & 186.285714285714 &  &  \tabularnewline
Midmean - Empirical Distribution Function - Interpolation & 186.285714285714 &  &  \tabularnewline
Midmean - Closest Observation & 184.348837209302 &  &  \tabularnewline
Midmean - True Basic - Statistics Graphics Toolkit & 186.285714285714 &  &  \tabularnewline
Midmean - MS Excel (old versions) & 188.826086956522 &  &  \tabularnewline
Number of observations & 84 &  &  \tabularnewline
\hline
\end{tabular}
%Source: https://freestatistics.org/blog/index.php?pk=78155&T=1

[TABLE]
[ROW][C]Central Tendency - Ungrouped Data[/C][/ROW]
[ROW][C]Measure[/C][C]Value[/C][C]S.E.[/C][C]Value/S.E.[/C][/ROW]
[ROW][C]Arithmetic Mean[/C][C]180.357142857143[/C][C]7.67850571693987[/C][C]23.4885731033903[/C][/ROW]
[ROW][C]Geometric Mean[/C][C]165.034136285773[/C][C][/C][C][/C][/ROW]
[ROW][C]Harmonic Mean[/C][C]149.346915139109[/C][C][/C][C][/C][/ROW]
[ROW][C]Quadratic Mean[/C][C]193.448528899378[/C][C][/C][C][/C][/ROW]
[ROW][C]Winsorized Mean ( 1 / 28 )[/C][C]180.380952380952[/C][C]7.67056770644507[/C][C]23.5159846421002[/C][/ROW]
[ROW][C]Winsorized Mean ( 2 / 28 )[/C][C]180.404761904762[/C][C]7.64472375030513[/C][C]23.5985979084674[/C][/ROW]
[ROW][C]Winsorized Mean ( 3 / 28 )[/C][C]180.369047619048[/C][C]7.62950495687297[/C][C]23.6409896367606[/C][/ROW]
[ROW][C]Winsorized Mean ( 4 / 28 )[/C][C]180.940476190476[/C][C]7.52487462685449[/C][C]24.045646627087[/C][/ROW]
[ROW][C]Winsorized Mean ( 5 / 28 )[/C][C]181.119047619048[/C][C]7.48219160864484[/C][C]24.2066839627289[/C][/ROW]
[ROW][C]Winsorized Mean ( 6 / 28 )[/C][C]181.119047619048[/C][C]7.48219160864484[/C][C]24.2066839627289[/C][/ROW]
[ROW][C]Winsorized Mean ( 7 / 28 )[/C][C]181.119047619048[/C][C]7.48219160864484[/C][C]24.2066839627289[/C][/ROW]
[ROW][C]Winsorized Mean ( 8 / 28 )[/C][C]181.119047619048[/C][C]7.45653699740447[/C][C]24.2899683434942[/C][/ROW]
[ROW][C]Winsorized Mean ( 9 / 28 )[/C][C]181.011904761905[/C][C]7.44329286903698[/C][C]24.3187938385292[/C][/ROW]
[ROW][C]Winsorized Mean ( 10 / 28 )[/C][C]181.130952380952[/C][C]7.42620570679459[/C][C]24.3907803705501[/C][/ROW]
[ROW][C]Winsorized Mean ( 11 / 28 )[/C][C]181.392857142857[/C][C]7.38903410286912[/C][C]24.5489267768332[/C][/ROW]
[ROW][C]Winsorized Mean ( 12 / 28 )[/C][C]181.678571428571[/C][C]7.349077412607[/C][C]24.7212760498223[/C][/ROW]
[ROW][C]Winsorized Mean ( 13 / 28 )[/C][C]181.523809523810[/C][C]7.33004952145216[/C][C]24.7643360379164[/C][/ROW]
[ROW][C]Winsorized Mean ( 14 / 28 )[/C][C]181.857142857143[/C][C]7.28405198545264[/C][C]24.966480637472[/C][/ROW]
[ROW][C]Winsorized Mean ( 15 / 28 )[/C][C]181.857142857143[/C][C]7.28405198545264[/C][C]24.966480637472[/C][/ROW]
[ROW][C]Winsorized Mean ( 16 / 28 )[/C][C]181.666666666667[/C][C]7.26078309293051[/C][C]25.0202580550226[/C][/ROW]
[ROW][C]Winsorized Mean ( 17 / 28 )[/C][C]181.666666666667[/C][C]7.26078309293051[/C][C]25.0202580550226[/C][/ROW]
[ROW][C]Winsorized Mean ( 18 / 28 )[/C][C]181.452380952381[/C][C]7.17963518814536[/C][C]25.2732034702802[/C][/ROW]
[ROW][C]Winsorized Mean ( 19 / 28 )[/C][C]181.904761904762[/C][C]7.11812509253225[/C][C]25.5551510461092[/C][/ROW]
[ROW][C]Winsorized Mean ( 20 / 28 )[/C][C]182.142857142857[/C][C]7.08600438027008[/C][C]25.7045927956249[/C][/ROW]
[ROW][C]Winsorized Mean ( 21 / 28 )[/C][C]182.392857142857[/C][C]6.98894746357671[/C][C]26.0973284022248[/C][/ROW]
[ROW][C]Winsorized Mean ( 22 / 28 )[/C][C]182.916666666667[/C][C]6.9193826794559[/C][C]26.4354025699082[/C][/ROW]
[ROW][C]Winsorized Mean ( 23 / 28 )[/C][C]183.190476190476[/C][C]6.883267233762[/C][C]26.6138840712065[/C][/ROW]
[ROW][C]Winsorized Mean ( 24 / 28 )[/C][C]184.904761904762[/C][C]6.6604737238381[/C][C]27.7615030959405[/C][/ROW]
[ROW][C]Winsorized Mean ( 25 / 28 )[/C][C]184.904761904762[/C][C]6.58630463853815[/C][C]28.0741283697746[/C][/ROW]
[ROW][C]Winsorized Mean ( 26 / 28 )[/C][C]185.523809523810[/C][C]6.35436334361818[/C][C]29.1962859993102[/C][/ROW]
[ROW][C]Winsorized Mean ( 27 / 28 )[/C][C]186.809523809524[/C][C]6.19346434787218[/C][C]30.1623636331585[/C][/ROW]
[ROW][C]Winsorized Mean ( 28 / 28 )[/C][C]185.142857142857[/C][C]5.91307619817296[/C][C]31.3107511112512[/C][/ROW]
[ROW][C]Trimmed Mean ( 1 / 28 )[/C][C]180.695121951220[/C][C]7.66734785521753[/C][C]23.5668350208291[/C][/ROW]
[ROW][C]Trimmed Mean ( 2 / 28 )[/C][C]181.025[/C][C]7.65876214921366[/C][C]23.6363261416319[/C][/ROW]
[ROW][C]Trimmed Mean ( 3 / 28 )[/C][C]181.358974358974[/C][C]7.65898153291523[/C][C]23.6792546867447[/C][/ROW]
[ROW][C]Trimmed Mean ( 4 / 28 )[/C][C]181.723684210526[/C][C]7.65979704472577[/C][C]23.7243471529907[/C][/ROW]
[ROW][C]Trimmed Mean ( 5 / 28 )[/C][C]181.945945945946[/C][C]7.6885142484325[/C][C]23.6646431373969[/C][/ROW]
[ROW][C]Trimmed Mean ( 6 / 28 )[/C][C]182.138888888889[/C][C]7.72571933626487[/C][C]23.5756543774404[/C][/ROW]
[ROW][C]Trimmed Mean ( 7 / 28 )[/C][C]182.342857142857[/C][C]7.76067716289109[/C][C]23.4957405540277[/C][/ROW]
[ROW][C]Trimmed Mean ( 8 / 28 )[/C][C]182.558823529412[/C][C]7.7928453249461[/C][C]23.4264656767937[/C][/ROW]
[ROW][C]Trimmed Mean ( 9 / 28 )[/C][C]182.787878787879[/C][C]7.82654365722328[/C][C]23.3548660549769[/C][/ROW]
[ROW][C]Trimmed Mean ( 10 / 28 )[/C][C]183.046875[/C][C]7.85895094551669[/C][C]23.2915151486501[/C][/ROW]
[ROW][C]Trimmed Mean ( 11 / 28 )[/C][C]183.306451612903[/C][C]7.8901631220718[/C][C]23.2322765419292[/C][/ROW]
[ROW][C]Trimmed Mean ( 12 / 28 )[/C][C]183.55[/C][C]7.9229133844297[/C][C]23.1669830394356[/C][/ROW]
[ROW][C]Trimmed Mean ( 13 / 28 )[/C][C]183.775862068966[/C][C]7.95719959979204[/C][C]23.0955450801773[/C][/ROW]
[ROW][C]Trimmed Mean ( 14 / 28 )[/C][C]184.035714285714[/C][C]7.98895196081952[/C][C]23.0362774977602[/C][/ROW]
[ROW][C]Trimmed Mean ( 15 / 28 )[/C][C]184.277777777778[/C][C]8.02169562782081[/C][C]22.9724220822673[/C][/ROW]
[ROW][C]Trimmed Mean ( 16 / 28 )[/C][C]184.538461538462[/C][C]8.04734583051353[/C][C]22.931593276225[/C][/ROW]
[ROW][C]Trimmed Mean ( 17 / 28 )[/C][C]184.84[/C][C]8.06748879826951[/C][C]22.9117144903441[/C][/ROW]
[ROW][C]Trimmed Mean ( 18 / 28 )[/C][C]185.166666666667[/C][C]8.07655817549623[/C][C]22.9264326020025[/C][/ROW]
[ROW][C]Trimmed Mean ( 19 / 28 )[/C][C]185.543478260870[/C][C]8.0846790466106[/C][C]22.9500116443901[/C][/ROW]
[ROW][C]Trimmed Mean ( 20 / 28 )[/C][C]185.909090909091[/C][C]8.08790356795527[/C][C]22.9860667040682[/C][/ROW]
[ROW][C]Trimmed Mean ( 21 / 28 )[/C][C]186.285714285714[/C][C]8.07854054406183[/C][C]23.0593277671478[/C][/ROW]
[ROW][C]Trimmed Mean ( 22 / 28 )[/C][C]186.675[/C][C]8.06427604171156[/C][C]23.1483891467064[/C][/ROW]
[ROW][C]Trimmed Mean ( 23 / 28 )[/C][C]187.052631578947[/C][C]8.03751404994213[/C][C]23.2724484730816[/C][/ROW]
[ROW][C]Trimmed Mean ( 24 / 28 )[/C][C]187.444444444444[/C][C]7.98594444270528[/C][C]23.4717941990774[/C][/ROW]
[ROW][C]Trimmed Mean ( 25 / 28 )[/C][C]187.705882352941[/C][C]7.94326241831924[/C][C]23.6308298111922[/C][/ROW]
[ROW][C]Trimmed Mean ( 26 / 28 )[/C][C]188[/C][C]7.87362379167961[/C][C]23.8771885695971[/C][/ROW]
[ROW][C]Trimmed Mean ( 27 / 28 )[/C][C]188.266666666667[/C][C]7.80611804466235[/C][C]24.1178349583631[/C][/ROW]
[ROW][C]Trimmed Mean ( 28 / 28 )[/C][C]188.428571428571[/C][C]7.72072531536472[/C][C]24.4055530707182[/C][/ROW]
[ROW][C]Median[/C][C]188.5[/C][C][/C][C][/C][/ROW]
[ROW][C]Midrange[/C][C]166.5[/C][C][/C][C][/C][/ROW]
[ROW][C]Midmean - Weighted Average at Xnp[/C][C]184.348837209302[/C][C][/C][C][/C][/ROW]
[ROW][C]Midmean - Weighted Average at X(n+1)p[/C][C]186.285714285714[/C][C][/C][C][/C][/ROW]
[ROW][C]Midmean - Empirical Distribution Function[/C][C]184.348837209302[/C][C][/C][C][/C][/ROW]
[ROW][C]Midmean - Empirical Distribution Function - Averaging[/C][C]186.285714285714[/C][C][/C][C][/C][/ROW]
[ROW][C]Midmean - Empirical Distribution Function - Interpolation[/C][C]186.285714285714[/C][C][/C][C][/C][/ROW]
[ROW][C]Midmean - Closest Observation[/C][C]184.348837209302[/C][C][/C][C][/C][/ROW]
[ROW][C]Midmean - True Basic - Statistics Graphics Toolkit[/C][C]186.285714285714[/C][C][/C][C][/C][/ROW]
[ROW][C]Midmean - MS Excel (old versions)[/C][C]188.826086956522[/C][C][/C][C][/C][/ROW]
[ROW][C]Number of observations[/C][C]84[/C][C][/C][C][/C][/ROW]
[/TABLE]
Source: https://freestatistics.org/blog/index.php?pk=78155&T=1

Globally Unique Identifier (entire table): ba.freestatistics.org/blog/index.php?pk=78155&T=1

As an alternative you can also use a QR Code:  

The GUIDs for individual cells are displayed in the table below:

Central Tendency - Ungrouped Data
MeasureValueS.E.Value/S.E.
Arithmetic Mean180.3571428571437.6785057169398723.4885731033903
Geometric Mean165.034136285773
Harmonic Mean149.346915139109
Quadratic Mean193.448528899378
Winsorized Mean ( 1 / 28 )180.3809523809527.6705677064450723.5159846421002
Winsorized Mean ( 2 / 28 )180.4047619047627.6447237503051323.5985979084674
Winsorized Mean ( 3 / 28 )180.3690476190487.6295049568729723.6409896367606
Winsorized Mean ( 4 / 28 )180.9404761904767.5248746268544924.045646627087
Winsorized Mean ( 5 / 28 )181.1190476190487.4821916086448424.2066839627289
Winsorized Mean ( 6 / 28 )181.1190476190487.4821916086448424.2066839627289
Winsorized Mean ( 7 / 28 )181.1190476190487.4821916086448424.2066839627289
Winsorized Mean ( 8 / 28 )181.1190476190487.4565369974044724.2899683434942
Winsorized Mean ( 9 / 28 )181.0119047619057.4432928690369824.3187938385292
Winsorized Mean ( 10 / 28 )181.1309523809527.4262057067945924.3907803705501
Winsorized Mean ( 11 / 28 )181.3928571428577.3890341028691224.5489267768332
Winsorized Mean ( 12 / 28 )181.6785714285717.34907741260724.7212760498223
Winsorized Mean ( 13 / 28 )181.5238095238107.3300495214521624.7643360379164
Winsorized Mean ( 14 / 28 )181.8571428571437.2840519854526424.966480637472
Winsorized Mean ( 15 / 28 )181.8571428571437.2840519854526424.966480637472
Winsorized Mean ( 16 / 28 )181.6666666666677.2607830929305125.0202580550226
Winsorized Mean ( 17 / 28 )181.6666666666677.2607830929305125.0202580550226
Winsorized Mean ( 18 / 28 )181.4523809523817.1796351881453625.2732034702802
Winsorized Mean ( 19 / 28 )181.9047619047627.1181250925322525.5551510461092
Winsorized Mean ( 20 / 28 )182.1428571428577.0860043802700825.7045927956249
Winsorized Mean ( 21 / 28 )182.3928571428576.9889474635767126.0973284022248
Winsorized Mean ( 22 / 28 )182.9166666666676.919382679455926.4354025699082
Winsorized Mean ( 23 / 28 )183.1904761904766.88326723376226.6138840712065
Winsorized Mean ( 24 / 28 )184.9047619047626.660473723838127.7615030959405
Winsorized Mean ( 25 / 28 )184.9047619047626.5863046385381528.0741283697746
Winsorized Mean ( 26 / 28 )185.5238095238106.3543633436181829.1962859993102
Winsorized Mean ( 27 / 28 )186.8095238095246.1934643478721830.1623636331585
Winsorized Mean ( 28 / 28 )185.1428571428575.9130761981729631.3107511112512
Trimmed Mean ( 1 / 28 )180.6951219512207.6673478552175323.5668350208291
Trimmed Mean ( 2 / 28 )181.0257.6587621492136623.6363261416319
Trimmed Mean ( 3 / 28 )181.3589743589747.6589815329152323.6792546867447
Trimmed Mean ( 4 / 28 )181.7236842105267.6597970447257723.7243471529907
Trimmed Mean ( 5 / 28 )181.9459459459467.688514248432523.6646431373969
Trimmed Mean ( 6 / 28 )182.1388888888897.7257193362648723.5756543774404
Trimmed Mean ( 7 / 28 )182.3428571428577.7606771628910923.4957405540277
Trimmed Mean ( 8 / 28 )182.5588235294127.792845324946123.4264656767937
Trimmed Mean ( 9 / 28 )182.7878787878797.8265436572232823.3548660549769
Trimmed Mean ( 10 / 28 )183.0468757.8589509455166923.2915151486501
Trimmed Mean ( 11 / 28 )183.3064516129037.890163122071823.2322765419292
Trimmed Mean ( 12 / 28 )183.557.922913384429723.1669830394356
Trimmed Mean ( 13 / 28 )183.7758620689667.9571995997920423.0955450801773
Trimmed Mean ( 14 / 28 )184.0357142857147.9889519608195223.0362774977602
Trimmed Mean ( 15 / 28 )184.2777777777788.0216956278208122.9724220822673
Trimmed Mean ( 16 / 28 )184.5384615384628.0473458305135322.931593276225
Trimmed Mean ( 17 / 28 )184.848.0674887982695122.9117144903441
Trimmed Mean ( 18 / 28 )185.1666666666678.0765581754962322.9264326020025
Trimmed Mean ( 19 / 28 )185.5434782608708.084679046610622.9500116443901
Trimmed Mean ( 20 / 28 )185.9090909090918.0879035679552722.9860667040682
Trimmed Mean ( 21 / 28 )186.2857142857148.0785405440618323.0593277671478
Trimmed Mean ( 22 / 28 )186.6758.0642760417115623.1483891467064
Trimmed Mean ( 23 / 28 )187.0526315789478.0375140499421323.2724484730816
Trimmed Mean ( 24 / 28 )187.4444444444447.9859444427052823.4717941990774
Trimmed Mean ( 25 / 28 )187.7058823529417.9432624183192423.6308298111922
Trimmed Mean ( 26 / 28 )1887.8736237916796123.8771885695971
Trimmed Mean ( 27 / 28 )188.2666666666677.8061180446623524.1178349583631
Trimmed Mean ( 28 / 28 )188.4285714285717.7207253153647224.4055530707182
Median188.5
Midrange166.5
Midmean - Weighted Average at Xnp184.348837209302
Midmean - Weighted Average at X(n+1)p186.285714285714
Midmean - Empirical Distribution Function184.348837209302
Midmean - Empirical Distribution Function - Averaging186.285714285714
Midmean - Empirical Distribution Function - Interpolation186.285714285714
Midmean - Closest Observation184.348837209302
Midmean - True Basic - Statistics Graphics Toolkit186.285714285714
Midmean - MS Excel (old versions)188.826086956522
Number of observations84


Parameters (Session):
Parameters (R input):
R code (references can be found in the software module):
geomean <- function(x) {
return(exp(mean(log(x))))
}
harmean <- function(x) {
return(1/mean(1/x))
}
quamean <- function(x) {
return(sqrt(mean(x*x)))
}
winmean <- function(x) {
x <-sort(x[!is.na(x)])
n<-length(x)
denom <- 3
nodenom <- n/denom
if (nodenom>40) denom <- n/40
sqrtn = sqrt(n)
roundnodenom = floor(nodenom)
win <- array(NA,dim=c(roundnodenom,2))
for (j in 1:roundnodenom) {
win[j,1] <- (j*x[j+1]+sum(x[(j+1):(n-j)])+j*x[n-j])/n
win[j,2] <- sd(c(rep(x[j+1],j),x[(j+1):(n-j)],rep(x[n-j],j)))/sqrtn
}
return(win)
}
trimean <- function(x) {
x <-sort(x[!is.na(x)])
n<-length(x)
denom <- 3
nodenom <- n/denom
if (nodenom>40) denom <- n/40
sqrtn = sqrt(n)
roundnodenom = floor(nodenom)
tri <- array(NA,dim=c(roundnodenom,2))
for (j in 1:roundnodenom) {
tri[j,1] <- mean(x,trim=j/n)
tri[j,2] <- sd(x[(j+1):(n-j)]) / sqrt(n-j*2)
}
return(tri)
}
midrange <- function(x) {
return((max(x)+min(x))/2)
}
q1 <- function(data,n,p,i,f) {
np <- n*p;
i <<- floor(np)
f <<- np - i
qvalue <- (1-f)*data[i] + f*data[i+1]
}
q2 <- function(data,n,p,i,f) {
np <- (n+1)*p
i <<- floor(np)
f <<- np - i
qvalue <- (1-f)*data[i] + f*data[i+1]
}
q3 <- function(data,n,p,i,f) {
np <- n*p
i <<- floor(np)
f <<- np - i
if (f==0) {
qvalue <- data[i]
} else {
qvalue <- data[i+1]
}
}
q4 <- function(data,n,p,i,f) {
np <- n*p
i <<- floor(np)
f <<- np - i
if (f==0) {
qvalue <- (data[i]+data[i+1])/2
} else {
qvalue <- data[i+1]
}
}
q5 <- function(data,n,p,i,f) {
np <- (n-1)*p
i <<- floor(np)
f <<- np - i
if (f==0) {
qvalue <- data[i+1]
} else {
qvalue <- data[i+1] + f*(data[i+2]-data[i+1])
}
}
q6 <- function(data,n,p,i,f) {
np <- n*p+0.5
i <<- floor(np)
f <<- np - i
qvalue <- data[i]
}
q7 <- function(data,n,p,i,f) {
np <- (n+1)*p
i <<- floor(np)
f <<- np - i
if (f==0) {
qvalue <- data[i]
} else {
qvalue <- f*data[i] + (1-f)*data[i+1]
}
}
q8 <- function(data,n,p,i,f) {
np <- (n+1)*p
i <<- floor(np)
f <<- np - i
if (f==0) {
qvalue <- data[i]
} else {
if (f == 0.5) {
qvalue <- (data[i]+data[i+1])/2
} else {
if (f < 0.5) {
qvalue <- data[i]
} else {
qvalue <- data[i+1]
}
}
}
}
midmean <- function(x,def) {
x <-sort(x[!is.na(x)])
n<-length(x)
if (def==1) {
qvalue1 <- q1(x,n,0.25,i,f)
qvalue3 <- q1(x,n,0.75,i,f)
}
if (def==2) {
qvalue1 <- q2(x,n,0.25,i,f)
qvalue3 <- q2(x,n,0.75,i,f)
}
if (def==3) {
qvalue1 <- q3(x,n,0.25,i,f)
qvalue3 <- q3(x,n,0.75,i,f)
}
if (def==4) {
qvalue1 <- q4(x,n,0.25,i,f)
qvalue3 <- q4(x,n,0.75,i,f)
}
if (def==5) {
qvalue1 <- q5(x,n,0.25,i,f)
qvalue3 <- q5(x,n,0.75,i,f)
}
if (def==6) {
qvalue1 <- q6(x,n,0.25,i,f)
qvalue3 <- q6(x,n,0.75,i,f)
}
if (def==7) {
qvalue1 <- q7(x,n,0.25,i,f)
qvalue3 <- q7(x,n,0.75,i,f)
}
if (def==8) {
qvalue1 <- q8(x,n,0.25,i,f)
qvalue3 <- q8(x,n,0.75,i,f)
}
midm <- 0
myn <- 0
roundno4 <- round(n/4)
round3no4 <- round(3*n/4)
for (i in 1:n) {
if ((x[i]>=qvalue1) & (x[i]<=qvalue3)){
midm = midm + x[i]
myn = myn + 1
}
}
midm = midm / myn
return(midm)
}
(arm <- mean(x))
sqrtn <- sqrt(length(x))
(armse <- sd(x) / sqrtn)
(armose <- arm / armse)
(geo <- geomean(x))
(har <- harmean(x))
(qua <- quamean(x))
(win <- winmean(x))
(tri <- trimean(x))
(midr <- midrange(x))
midm <- array(NA,dim=8)
for (j in 1:8) midm[j] <- midmean(x,j)
midm
bitmap(file='test1.png')
lb <- win[,1] - 2*win[,2]
ub <- win[,1] + 2*win[,2]
if ((ylimmin == '') | (ylimmax == '')) plot(win[,1],type='b',main=main, xlab='j', pch=19, ylab='Winsorized Mean(j/n)', ylim=c(min(lb),max(ub))) else plot(win[,1],type='l',main=main, xlab='j', pch=19, ylab='Winsorized Mean(j/n)', ylim=c(ylimmin,ylimmax))
lines(ub,lty=3)
lines(lb,lty=3)
grid()
dev.off()
bitmap(file='test2.png')
lb <- tri[,1] - 2*tri[,2]
ub <- tri[,1] + 2*tri[,2]
if ((ylimmin == '') | (ylimmax == '')) plot(tri[,1],type='b',main=main, xlab='j', pch=19, ylab='Trimmed Mean(j/n)', ylim=c(min(lb),max(ub))) else plot(tri[,1],type='l',main=main, xlab='j', pch=19, ylab='Trimmed Mean(j/n)', ylim=c(ylimmin,ylimmax))
lines(ub,lty=3)
lines(lb,lty=3)
grid()
dev.off()
load(file='createtable')
a<-table.start()
a<-table.row.start(a)
a<-table.element(a,'Central Tendency - Ungrouped Data',4,TRUE)
a<-table.row.end(a)
a<-table.row.start(a)
a<-table.element(a,'Measure',header=TRUE)
a<-table.element(a,'Value',header=TRUE)
a<-table.element(a,'S.E.',header=TRUE)
a<-table.element(a,'Value/S.E.',header=TRUE)
a<-table.row.end(a)
a<-table.row.start(a)
a<-table.element(a,hyperlink('arithmetic_mean.htm', 'Arithmetic Mean', 'click to view the definition of the Arithmetic Mean'),header=TRUE)
a<-table.element(a,arm)
a<-table.element(a,hyperlink('arithmetic_mean_standard_error.htm', armse, 'click to view the definition of the Standard Error of the Arithmetic Mean'))
a<-table.element(a,armose)
a<-table.row.end(a)
a<-table.row.start(a)
a<-table.element(a,hyperlink('geometric_mean.htm', 'Geometric Mean', 'click to view the definition of the Geometric Mean'),header=TRUE)
a<-table.element(a,geo)
a<-table.element(a,'')
a<-table.row.end(a)
a<-table.row.start(a)
a<-table.element(a,hyperlink('harmonic_mean.htm', 'Harmonic Mean', 'click to view the definition of the Harmonic Mean'),header=TRUE)
a<-table.element(a,har)
a<-table.element(a,'')
a<-table.row.end(a)
a<-table.row.start(a)
a<-table.element(a,hyperlink('quadratic_mean.htm', 'Quadratic Mean', 'click to view the definition of the Quadratic Mean'),header=TRUE)
a<-table.element(a,qua)
a<-table.element(a,'')
a<-table.row.end(a)
for (j in 1:length(win[,1])) {
a<-table.row.start(a)
mylabel <- paste('Winsorized Mean (',j)
mylabel <- paste(mylabel,'/')
mylabel <- paste(mylabel,length(win[,1]))
mylabel <- paste(mylabel,')')
a<-table.element(a,hyperlink('winsorized_mean.htm', mylabel, 'click to view the definition of the Winsorized Mean'),header=TRUE)
a<-table.element(a,win[j,1])
a<-table.element(a,win[j,2])
a<-table.element(a,win[j,1]/win[j,2])
a<-table.row.end(a)
}
for (j in 1:length(tri[,1])) {
a<-table.row.start(a)
mylabel <- paste('Trimmed Mean (',j)
mylabel <- paste(mylabel,'/')
mylabel <- paste(mylabel,length(tri[,1]))
mylabel <- paste(mylabel,')')
a<-table.element(a,hyperlink('arithmetic_mean.htm', mylabel, 'click to view the definition of the Trimmed Mean'),header=TRUE)
a<-table.element(a,tri[j,1])
a<-table.element(a,tri[j,2])
a<-table.element(a,tri[j,1]/tri[j,2])
a<-table.row.end(a)
}
a<-table.row.start(a)
a<-table.element(a,hyperlink('median_1.htm', 'Median', 'click to view the definition of the Median'),header=TRUE)
a<-table.element(a,median(x))
a<-table.element(a,'')
a<-table.row.end(a)
a<-table.row.start(a)
a<-table.element(a,hyperlink('midrange.htm', 'Midrange', 'click to view the definition of the Midrange'),header=TRUE)
a<-table.element(a,midr)
a<-table.element(a,'')
a<-table.row.end(a)
a<-table.row.start(a)
mymid <- hyperlink('midmean.htm', 'Midmean', 'click to view the definition of the Midmean')
mylabel <- paste(mymid,hyperlink('method_1.htm','Weighted Average at Xnp',''),sep=' - ')
a<-table.element(a,mylabel,header=TRUE)
a<-table.element(a,midm[1])
a<-table.element(a,'')
a<-table.row.end(a)
a<-table.row.start(a)
mymid <- hyperlink('midmean.htm', 'Midmean', 'click to view the definition of the Midmean')
mylabel <- paste(mymid,hyperlink('method_2.htm','Weighted Average at X(n+1)p',''),sep=' - ')
a<-table.element(a,mylabel,header=TRUE)
a<-table.element(a,midm[2])
a<-table.element(a,'')
a<-table.row.end(a)
a<-table.row.start(a)
mymid <- hyperlink('midmean.htm', 'Midmean', 'click to view the definition of the Midmean')
mylabel <- paste(mymid,hyperlink('method_3.htm','Empirical Distribution Function',''),sep=' - ')
a<-table.element(a,mylabel,header=TRUE)
a<-table.element(a,midm[3])
a<-table.element(a,'')
a<-table.row.end(a)
a<-table.row.start(a)
mymid <- hyperlink('midmean.htm', 'Midmean', 'click to view the definition of the Midmean')
mylabel <- paste(mymid,hyperlink('method_4.htm','Empirical Distribution Function - Averaging',''),sep=' - ')
a<-table.element(a,mylabel,header=TRUE)
a<-table.element(a,midm[4])
a<-table.element(a,'')
a<-table.row.end(a)
a<-table.row.start(a)
mymid <- hyperlink('midmean.htm', 'Midmean', 'click to view the definition of the Midmean')
mylabel <- paste(mymid,hyperlink('method_5.htm','Empirical Distribution Function - Interpolation',''),sep=' - ')
a<-table.element(a,mylabel,header=TRUE)
a<-table.element(a,midm[5])
a<-table.element(a,'')
a<-table.row.end(a)
a<-table.row.start(a)
mymid <- hyperlink('midmean.htm', 'Midmean', 'click to view the definition of the Midmean')
mylabel <- paste(mymid,hyperlink('method_6.htm','Closest Observation',''),sep=' - ')
a<-table.element(a,mylabel,header=TRUE)
a<-table.element(a,midm[6])
a<-table.element(a,'')
a<-table.row.end(a)
a<-table.row.start(a)
mymid <- hyperlink('midmean.htm', 'Midmean', 'click to view the definition of the Midmean')
mylabel <- paste(mymid,hyperlink('method_7.htm','True Basic - Statistics Graphics Toolkit',''),sep=' - ')
a<-table.element(a,mylabel,header=TRUE)
a<-table.element(a,midm[7])
a<-table.element(a,'')
a<-table.row.end(a)
a<-table.row.start(a)
mymid <- hyperlink('midmean.htm', 'Midmean', 'click to view the definition of the Midmean')
mylabel <- paste(mymid,hyperlink('method_8.htm','MS Excel (old versions)',''),sep=' - ')
a<-table.element(a,mylabel,header=TRUE)
a<-table.element(a,midm[8])
a<-table.element(a,'')
a<-table.row.end(a)
a<-table.row.start(a)
a<-table.element(a,'Number of observations',header=TRUE)
a<-table.element(a,length(x))
a<-table.element(a,'')
a<-table.row.end(a)
a<-table.end(a)
table.save(a,file='mytable.tab')