Free Statistics

of Irreproducible Research!

Author's title

Author*Unverified author*
R Software Modulerwasp_autocorrelation.wasp
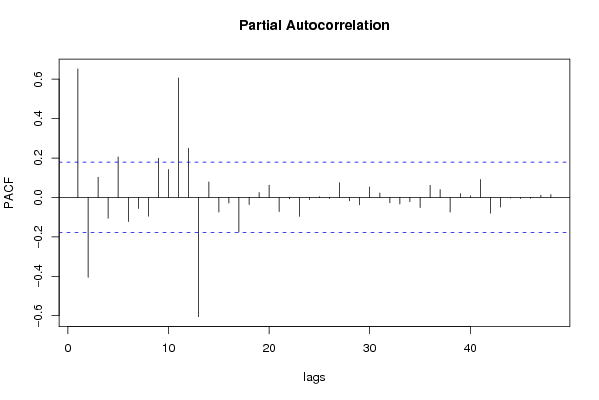
Title produced by software(Partial) Autocorrelation Function
Date of computationWed, 28 Jul 2010 11:44:35 +0000
Cite this page as followsStatistical Computations at FreeStatistics.org, Office for Research Development and Education, URL https://freestatistics.org/blog/index.php?v=date/2010/Jul/28/t1280317546l8ctcxnah8dj81f.htm/, Retrieved Mon, 29 Apr 2024 15:57:21 +0000
Statistical Computations at FreeStatistics.org, Office for Research Development and Education, URL https://freestatistics.org/blog/index.php?pk=78143, Retrieved Mon, 29 Apr 2024 15:57:21 +0000
QR Codes:

Original text written by user:
IsPrivate?No (this computation is public)
User-defined keywordsPatrick Fieremans
Estimated Impact207
Family? (F = Feedback message, R = changed R code, M = changed R Module, P = changed Parameters, D = changed Data)
-       [(Partial) Autocorrelation Function] [Tijdreeks 1 - Sta...] [2010-07-28 11:44:35] [bffa0fb6afa860209dcefcd4361c2008] [Current]
Feedback Forum

Post a new message
Dataseries X:
136
135
134
132
152
151
136
126
127
127
128
130
125
118
111
104
126
131
122
116
115
115
113
122
114
106
93
89
114
122
115
116
120
120
120
121
118
112
99
96
120
135
128
134
134
132
130
125
124
114
101
101
123
143
133
136
137
135
141
136
133
124
110
104
130
160
142
142
137
135
139
135
134
120
103
101
127
159
141
140
135
127
130
128
126
110
101
102
129
169
146
145
138
123
124
137
132
112
105
106
137
175
151
142
140
122
127
135
128
117
107
108
134
171
154
146
148
122
124
135


Summary of computational transaction
Raw Inputview raw input (R code)
Raw Outputview raw output of R engine
Computing time2 seconds
R Server'Sir Ronald Aylmer Fisher' @ 193.190.124.24

\begin{tabular}{lllllllll}
\hline
Summary of computational transaction \tabularnewline
Raw Input & view raw input (R code)  \tabularnewline
Raw Output & view raw output of R engine  \tabularnewline
Computing time & 2 seconds \tabularnewline
R Server & 'Sir Ronald Aylmer Fisher' @ 193.190.124.24 \tabularnewline
\hline
\end{tabular}
%Source: https://freestatistics.org/blog/index.php?pk=78143&T=0

[TABLE]
[ROW][C]Summary of computational transaction[/C][/ROW]
[ROW][C]Raw Input[/C][C]view raw input (R code) [/C][/ROW]
[ROW][C]Raw Output[/C][C]view raw output of R engine [/C][/ROW]
[ROW][C]Computing time[/C][C]2 seconds[/C][/ROW]
[ROW][C]R Server[/C][C]'Sir Ronald Aylmer Fisher' @ 193.190.124.24[/C][/ROW]
[/TABLE]
Source: https://freestatistics.org/blog/index.php?pk=78143&T=0

Globally Unique Identifier (entire table): ba.freestatistics.org/blog/index.php?pk=78143&T=0

As an alternative you can also use a QR Code:  

The GUIDs for individual cells are displayed in the table below:

Summary of computational transaction
Raw Inputview raw input (R code)
Raw Outputview raw output of R engine
Computing time2 seconds
R Server'Sir Ronald Aylmer Fisher' @ 193.190.124.24


Autocorrelation Function
Time lag kACF(k)T-STATP-value
10.6518757.14090
20.1921482.10490.018694
3-0.038566-0.42250.336721
4-0.116413-1.27520.102344
5-0.024828-0.2720.393053
60.0523480.57340.283707
7-0.000294-0.00320.498718
8-0.101691-1.1140.13376
9-0.073257-0.80250.211927
100.1041971.14140.127985
110.4789365.24650
120.7633248.36180
130.458835.02621e-06
140.033710.36930.356289
15-0.178868-1.95940.026192
16-0.251903-2.75950.003349
17-0.166444-1.82330.035373
18-0.071852-0.78710.216388
19-0.086002-0.94210.174017
20-0.156927-1.71910.044092
21-0.142731-1.56350.060279
220.0033430.03660.485425
230.304743.33830.000562
240.5282525.78670
250.2721612.98140.001738
26-0.098721-1.08140.140836
27-0.262161-2.87180.002413
28-0.304476-3.33540.000567
29-0.2243-2.45710.007718
30-0.114992-1.25970.105116
31-0.092737-1.01590.155864
32-0.137704-1.50850.067031
33-0.133128-1.45830.073679
34-0.016075-0.17610.43026
350.2136012.33990.010471
360.3863844.23262.3e-05
370.1869992.04850.021348
38-0.132183-1.4480.075113
39-0.255827-2.80240.002958
40-0.269982-2.95750.001868
41-0.188303-2.06280.020647
42-0.07456-0.81680.207839
43-0.042039-0.46050.32299
44-0.07781-0.85240.197853
45-0.090762-0.99430.161051
46-0.006026-0.0660.47374
470.1697621.85960.032692
480.3082043.37620.000495

\begin{tabular}{lllllllll}
\hline
Autocorrelation Function \tabularnewline
Time lag k & ACF(k) & T-STAT & P-value \tabularnewline
1 & 0.651875 & 7.1409 & 0 \tabularnewline
2 & 0.192148 & 2.1049 & 0.018694 \tabularnewline
3 & -0.038566 & -0.4225 & 0.336721 \tabularnewline
4 & -0.116413 & -1.2752 & 0.102344 \tabularnewline
5 & -0.024828 & -0.272 & 0.393053 \tabularnewline
6 & 0.052348 & 0.5734 & 0.283707 \tabularnewline
7 & -0.000294 & -0.0032 & 0.498718 \tabularnewline
8 & -0.101691 & -1.114 & 0.13376 \tabularnewline
9 & -0.073257 & -0.8025 & 0.211927 \tabularnewline
10 & 0.104197 & 1.1414 & 0.127985 \tabularnewline
11 & 0.478936 & 5.2465 & 0 \tabularnewline
12 & 0.763324 & 8.3618 & 0 \tabularnewline
13 & 0.45883 & 5.0262 & 1e-06 \tabularnewline
14 & 0.03371 & 0.3693 & 0.356289 \tabularnewline
15 & -0.178868 & -1.9594 & 0.026192 \tabularnewline
16 & -0.251903 & -2.7595 & 0.003349 \tabularnewline
17 & -0.166444 & -1.8233 & 0.035373 \tabularnewline
18 & -0.071852 & -0.7871 & 0.216388 \tabularnewline
19 & -0.086002 & -0.9421 & 0.174017 \tabularnewline
20 & -0.156927 & -1.7191 & 0.044092 \tabularnewline
21 & -0.142731 & -1.5635 & 0.060279 \tabularnewline
22 & 0.003343 & 0.0366 & 0.485425 \tabularnewline
23 & 0.30474 & 3.3383 & 0.000562 \tabularnewline
24 & 0.528252 & 5.7867 & 0 \tabularnewline
25 & 0.272161 & 2.9814 & 0.001738 \tabularnewline
26 & -0.098721 & -1.0814 & 0.140836 \tabularnewline
27 & -0.262161 & -2.8718 & 0.002413 \tabularnewline
28 & -0.304476 & -3.3354 & 0.000567 \tabularnewline
29 & -0.2243 & -2.4571 & 0.007718 \tabularnewline
30 & -0.114992 & -1.2597 & 0.105116 \tabularnewline
31 & -0.092737 & -1.0159 & 0.155864 \tabularnewline
32 & -0.137704 & -1.5085 & 0.067031 \tabularnewline
33 & -0.133128 & -1.4583 & 0.073679 \tabularnewline
34 & -0.016075 & -0.1761 & 0.43026 \tabularnewline
35 & 0.213601 & 2.3399 & 0.010471 \tabularnewline
36 & 0.386384 & 4.2326 & 2.3e-05 \tabularnewline
37 & 0.186999 & 2.0485 & 0.021348 \tabularnewline
38 & -0.132183 & -1.448 & 0.075113 \tabularnewline
39 & -0.255827 & -2.8024 & 0.002958 \tabularnewline
40 & -0.269982 & -2.9575 & 0.001868 \tabularnewline
41 & -0.188303 & -2.0628 & 0.020647 \tabularnewline
42 & -0.07456 & -0.8168 & 0.207839 \tabularnewline
43 & -0.042039 & -0.4605 & 0.32299 \tabularnewline
44 & -0.07781 & -0.8524 & 0.197853 \tabularnewline
45 & -0.090762 & -0.9943 & 0.161051 \tabularnewline
46 & -0.006026 & -0.066 & 0.47374 \tabularnewline
47 & 0.169762 & 1.8596 & 0.032692 \tabularnewline
48 & 0.308204 & 3.3762 & 0.000495 \tabularnewline
\hline
\end{tabular}
%Source: https://freestatistics.org/blog/index.php?pk=78143&T=1

[TABLE]
[ROW][C]Autocorrelation Function[/C][/ROW]
[ROW][C]Time lag k[/C][C]ACF(k)[/C][C]T-STAT[/C][C]P-value[/C][/ROW]
[ROW][C]1[/C][C]0.651875[/C][C]7.1409[/C][C]0[/C][/ROW]
[ROW][C]2[/C][C]0.192148[/C][C]2.1049[/C][C]0.018694[/C][/ROW]
[ROW][C]3[/C][C]-0.038566[/C][C]-0.4225[/C][C]0.336721[/C][/ROW]
[ROW][C]4[/C][C]-0.116413[/C][C]-1.2752[/C][C]0.102344[/C][/ROW]
[ROW][C]5[/C][C]-0.024828[/C][C]-0.272[/C][C]0.393053[/C][/ROW]
[ROW][C]6[/C][C]0.052348[/C][C]0.5734[/C][C]0.283707[/C][/ROW]
[ROW][C]7[/C][C]-0.000294[/C][C]-0.0032[/C][C]0.498718[/C][/ROW]
[ROW][C]8[/C][C]-0.101691[/C][C]-1.114[/C][C]0.13376[/C][/ROW]
[ROW][C]9[/C][C]-0.073257[/C][C]-0.8025[/C][C]0.211927[/C][/ROW]
[ROW][C]10[/C][C]0.104197[/C][C]1.1414[/C][C]0.127985[/C][/ROW]
[ROW][C]11[/C][C]0.478936[/C][C]5.2465[/C][C]0[/C][/ROW]
[ROW][C]12[/C][C]0.763324[/C][C]8.3618[/C][C]0[/C][/ROW]
[ROW][C]13[/C][C]0.45883[/C][C]5.0262[/C][C]1e-06[/C][/ROW]
[ROW][C]14[/C][C]0.03371[/C][C]0.3693[/C][C]0.356289[/C][/ROW]
[ROW][C]15[/C][C]-0.178868[/C][C]-1.9594[/C][C]0.026192[/C][/ROW]
[ROW][C]16[/C][C]-0.251903[/C][C]-2.7595[/C][C]0.003349[/C][/ROW]
[ROW][C]17[/C][C]-0.166444[/C][C]-1.8233[/C][C]0.035373[/C][/ROW]
[ROW][C]18[/C][C]-0.071852[/C][C]-0.7871[/C][C]0.216388[/C][/ROW]
[ROW][C]19[/C][C]-0.086002[/C][C]-0.9421[/C][C]0.174017[/C][/ROW]
[ROW][C]20[/C][C]-0.156927[/C][C]-1.7191[/C][C]0.044092[/C][/ROW]
[ROW][C]21[/C][C]-0.142731[/C][C]-1.5635[/C][C]0.060279[/C][/ROW]
[ROW][C]22[/C][C]0.003343[/C][C]0.0366[/C][C]0.485425[/C][/ROW]
[ROW][C]23[/C][C]0.30474[/C][C]3.3383[/C][C]0.000562[/C][/ROW]
[ROW][C]24[/C][C]0.528252[/C][C]5.7867[/C][C]0[/C][/ROW]
[ROW][C]25[/C][C]0.272161[/C][C]2.9814[/C][C]0.001738[/C][/ROW]
[ROW][C]26[/C][C]-0.098721[/C][C]-1.0814[/C][C]0.140836[/C][/ROW]
[ROW][C]27[/C][C]-0.262161[/C][C]-2.8718[/C][C]0.002413[/C][/ROW]
[ROW][C]28[/C][C]-0.304476[/C][C]-3.3354[/C][C]0.000567[/C][/ROW]
[ROW][C]29[/C][C]-0.2243[/C][C]-2.4571[/C][C]0.007718[/C][/ROW]
[ROW][C]30[/C][C]-0.114992[/C][C]-1.2597[/C][C]0.105116[/C][/ROW]
[ROW][C]31[/C][C]-0.092737[/C][C]-1.0159[/C][C]0.155864[/C][/ROW]
[ROW][C]32[/C][C]-0.137704[/C][C]-1.5085[/C][C]0.067031[/C][/ROW]
[ROW][C]33[/C][C]-0.133128[/C][C]-1.4583[/C][C]0.073679[/C][/ROW]
[ROW][C]34[/C][C]-0.016075[/C][C]-0.1761[/C][C]0.43026[/C][/ROW]
[ROW][C]35[/C][C]0.213601[/C][C]2.3399[/C][C]0.010471[/C][/ROW]
[ROW][C]36[/C][C]0.386384[/C][C]4.2326[/C][C]2.3e-05[/C][/ROW]
[ROW][C]37[/C][C]0.186999[/C][C]2.0485[/C][C]0.021348[/C][/ROW]
[ROW][C]38[/C][C]-0.132183[/C][C]-1.448[/C][C]0.075113[/C][/ROW]
[ROW][C]39[/C][C]-0.255827[/C][C]-2.8024[/C][C]0.002958[/C][/ROW]
[ROW][C]40[/C][C]-0.269982[/C][C]-2.9575[/C][C]0.001868[/C][/ROW]
[ROW][C]41[/C][C]-0.188303[/C][C]-2.0628[/C][C]0.020647[/C][/ROW]
[ROW][C]42[/C][C]-0.07456[/C][C]-0.8168[/C][C]0.207839[/C][/ROW]
[ROW][C]43[/C][C]-0.042039[/C][C]-0.4605[/C][C]0.32299[/C][/ROW]
[ROW][C]44[/C][C]-0.07781[/C][C]-0.8524[/C][C]0.197853[/C][/ROW]
[ROW][C]45[/C][C]-0.090762[/C][C]-0.9943[/C][C]0.161051[/C][/ROW]
[ROW][C]46[/C][C]-0.006026[/C][C]-0.066[/C][C]0.47374[/C][/ROW]
[ROW][C]47[/C][C]0.169762[/C][C]1.8596[/C][C]0.032692[/C][/ROW]
[ROW][C]48[/C][C]0.308204[/C][C]3.3762[/C][C]0.000495[/C][/ROW]
[/TABLE]
Source: https://freestatistics.org/blog/index.php?pk=78143&T=1

Globally Unique Identifier (entire table): ba.freestatistics.org/blog/index.php?pk=78143&T=1

As an alternative you can also use a QR Code:  

The GUIDs for individual cells are displayed in the table below:

Autocorrelation Function
Time lag kACF(k)T-STATP-value
10.6518757.14090
20.1921482.10490.018694
3-0.038566-0.42250.336721
4-0.116413-1.27520.102344
5-0.024828-0.2720.393053
60.0523480.57340.283707
7-0.000294-0.00320.498718
8-0.101691-1.1140.13376
9-0.073257-0.80250.211927
100.1041971.14140.127985
110.4789365.24650
120.7633248.36180
130.458835.02621e-06
140.033710.36930.356289
15-0.178868-1.95940.026192
16-0.251903-2.75950.003349
17-0.166444-1.82330.035373
18-0.071852-0.78710.216388
19-0.086002-0.94210.174017
20-0.156927-1.71910.044092
21-0.142731-1.56350.060279
220.0033430.03660.485425
230.304743.33830.000562
240.5282525.78670
250.2721612.98140.001738
26-0.098721-1.08140.140836
27-0.262161-2.87180.002413
28-0.304476-3.33540.000567
29-0.2243-2.45710.007718
30-0.114992-1.25970.105116
31-0.092737-1.01590.155864
32-0.137704-1.50850.067031
33-0.133128-1.45830.073679
34-0.016075-0.17610.43026
350.2136012.33990.010471
360.3863844.23262.3e-05
370.1869992.04850.021348
38-0.132183-1.4480.075113
39-0.255827-2.80240.002958
40-0.269982-2.95750.001868
41-0.188303-2.06280.020647
42-0.07456-0.81680.207839
43-0.042039-0.46050.32299
44-0.07781-0.85240.197853
45-0.090762-0.99430.161051
46-0.006026-0.0660.47374
470.1697621.85960.032692
480.3082043.37620.000495


Partial Autocorrelation Function
Time lag kPACF(k)T-STATP-value
10.6518757.14090
2-0.404816-4.43451e-05
30.1026621.12460.131501
4-0.106287-1.16430.123302
50.2053942.250.013136
6-0.122524-1.34220.091034
7-0.056486-0.61880.268618
8-0.095103-1.04180.149798
90.1986412.1760.015757
100.1420381.55590.061177
110.6058376.63660
120.249692.73520.00359
13-0.604975-6.62720
140.0784010.85880.19607
15-0.073977-0.81040.209664
16-0.028169-0.30860.37909
17-0.175642-1.92410.028357
18-0.036427-0.3990.345286
190.0243380.26660.395113
200.0622390.68180.248342
21-0.071684-0.78530.216926
22-0.006432-0.07050.471972
23-0.096434-1.05640.146459
24-0.010233-0.11210.455467
250.0039830.04360.482637
26-0.005143-0.05630.477584
270.0746060.81730.207699
28-0.017367-0.19020.424718
29-0.037344-0.40910.341605
300.0524860.5750.2832
310.0218950.23980.405428
32-0.027032-0.29610.383825
33-0.033333-0.36510.357822
34-0.021375-0.23420.407634
35-0.051711-0.56650.286068
360.0611720.67010.252038
370.0397060.4350.332189
38-0.073779-0.80820.210285
390.0195570.21420.415363
400.0079270.08680.465474
410.091491.00220.159126
42-0.079861-0.87480.191705
43-0.048321-0.52930.298776
44-0.003492-0.03830.484773
45-0.005979-0.06550.473944
46-0.004158-0.04560.481872
470.011220.12290.451191
480.0142060.15560.438298

\begin{tabular}{lllllllll}
\hline
Partial Autocorrelation Function \tabularnewline
Time lag k & PACF(k) & T-STAT & P-value \tabularnewline
1 & 0.651875 & 7.1409 & 0 \tabularnewline
2 & -0.404816 & -4.4345 & 1e-05 \tabularnewline
3 & 0.102662 & 1.1246 & 0.131501 \tabularnewline
4 & -0.106287 & -1.1643 & 0.123302 \tabularnewline
5 & 0.205394 & 2.25 & 0.013136 \tabularnewline
6 & -0.122524 & -1.3422 & 0.091034 \tabularnewline
7 & -0.056486 & -0.6188 & 0.268618 \tabularnewline
8 & -0.095103 & -1.0418 & 0.149798 \tabularnewline
9 & 0.198641 & 2.176 & 0.015757 \tabularnewline
10 & 0.142038 & 1.5559 & 0.061177 \tabularnewline
11 & 0.605837 & 6.6366 & 0 \tabularnewline
12 & 0.24969 & 2.7352 & 0.00359 \tabularnewline
13 & -0.604975 & -6.6272 & 0 \tabularnewline
14 & 0.078401 & 0.8588 & 0.19607 \tabularnewline
15 & -0.073977 & -0.8104 & 0.209664 \tabularnewline
16 & -0.028169 & -0.3086 & 0.37909 \tabularnewline
17 & -0.175642 & -1.9241 & 0.028357 \tabularnewline
18 & -0.036427 & -0.399 & 0.345286 \tabularnewline
19 & 0.024338 & 0.2666 & 0.395113 \tabularnewline
20 & 0.062239 & 0.6818 & 0.248342 \tabularnewline
21 & -0.071684 & -0.7853 & 0.216926 \tabularnewline
22 & -0.006432 & -0.0705 & 0.471972 \tabularnewline
23 & -0.096434 & -1.0564 & 0.146459 \tabularnewline
24 & -0.010233 & -0.1121 & 0.455467 \tabularnewline
25 & 0.003983 & 0.0436 & 0.482637 \tabularnewline
26 & -0.005143 & -0.0563 & 0.477584 \tabularnewline
27 & 0.074606 & 0.8173 & 0.207699 \tabularnewline
28 & -0.017367 & -0.1902 & 0.424718 \tabularnewline
29 & -0.037344 & -0.4091 & 0.341605 \tabularnewline
30 & 0.052486 & 0.575 & 0.2832 \tabularnewline
31 & 0.021895 & 0.2398 & 0.405428 \tabularnewline
32 & -0.027032 & -0.2961 & 0.383825 \tabularnewline
33 & -0.033333 & -0.3651 & 0.357822 \tabularnewline
34 & -0.021375 & -0.2342 & 0.407634 \tabularnewline
35 & -0.051711 & -0.5665 & 0.286068 \tabularnewline
36 & 0.061172 & 0.6701 & 0.252038 \tabularnewline
37 & 0.039706 & 0.435 & 0.332189 \tabularnewline
38 & -0.073779 & -0.8082 & 0.210285 \tabularnewline
39 & 0.019557 & 0.2142 & 0.415363 \tabularnewline
40 & 0.007927 & 0.0868 & 0.465474 \tabularnewline
41 & 0.09149 & 1.0022 & 0.159126 \tabularnewline
42 & -0.079861 & -0.8748 & 0.191705 \tabularnewline
43 & -0.048321 & -0.5293 & 0.298776 \tabularnewline
44 & -0.003492 & -0.0383 & 0.484773 \tabularnewline
45 & -0.005979 & -0.0655 & 0.473944 \tabularnewline
46 & -0.004158 & -0.0456 & 0.481872 \tabularnewline
47 & 0.01122 & 0.1229 & 0.451191 \tabularnewline
48 & 0.014206 & 0.1556 & 0.438298 \tabularnewline
\hline
\end{tabular}
%Source: https://freestatistics.org/blog/index.php?pk=78143&T=2

[TABLE]
[ROW][C]Partial Autocorrelation Function[/C][/ROW]
[ROW][C]Time lag k[/C][C]PACF(k)[/C][C]T-STAT[/C][C]P-value[/C][/ROW]
[ROW][C]1[/C][C]0.651875[/C][C]7.1409[/C][C]0[/C][/ROW]
[ROW][C]2[/C][C]-0.404816[/C][C]-4.4345[/C][C]1e-05[/C][/ROW]
[ROW][C]3[/C][C]0.102662[/C][C]1.1246[/C][C]0.131501[/C][/ROW]
[ROW][C]4[/C][C]-0.106287[/C][C]-1.1643[/C][C]0.123302[/C][/ROW]
[ROW][C]5[/C][C]0.205394[/C][C]2.25[/C][C]0.013136[/C][/ROW]
[ROW][C]6[/C][C]-0.122524[/C][C]-1.3422[/C][C]0.091034[/C][/ROW]
[ROW][C]7[/C][C]-0.056486[/C][C]-0.6188[/C][C]0.268618[/C][/ROW]
[ROW][C]8[/C][C]-0.095103[/C][C]-1.0418[/C][C]0.149798[/C][/ROW]
[ROW][C]9[/C][C]0.198641[/C][C]2.176[/C][C]0.015757[/C][/ROW]
[ROW][C]10[/C][C]0.142038[/C][C]1.5559[/C][C]0.061177[/C][/ROW]
[ROW][C]11[/C][C]0.605837[/C][C]6.6366[/C][C]0[/C][/ROW]
[ROW][C]12[/C][C]0.24969[/C][C]2.7352[/C][C]0.00359[/C][/ROW]
[ROW][C]13[/C][C]-0.604975[/C][C]-6.6272[/C][C]0[/C][/ROW]
[ROW][C]14[/C][C]0.078401[/C][C]0.8588[/C][C]0.19607[/C][/ROW]
[ROW][C]15[/C][C]-0.073977[/C][C]-0.8104[/C][C]0.209664[/C][/ROW]
[ROW][C]16[/C][C]-0.028169[/C][C]-0.3086[/C][C]0.37909[/C][/ROW]
[ROW][C]17[/C][C]-0.175642[/C][C]-1.9241[/C][C]0.028357[/C][/ROW]
[ROW][C]18[/C][C]-0.036427[/C][C]-0.399[/C][C]0.345286[/C][/ROW]
[ROW][C]19[/C][C]0.024338[/C][C]0.2666[/C][C]0.395113[/C][/ROW]
[ROW][C]20[/C][C]0.062239[/C][C]0.6818[/C][C]0.248342[/C][/ROW]
[ROW][C]21[/C][C]-0.071684[/C][C]-0.7853[/C][C]0.216926[/C][/ROW]
[ROW][C]22[/C][C]-0.006432[/C][C]-0.0705[/C][C]0.471972[/C][/ROW]
[ROW][C]23[/C][C]-0.096434[/C][C]-1.0564[/C][C]0.146459[/C][/ROW]
[ROW][C]24[/C][C]-0.010233[/C][C]-0.1121[/C][C]0.455467[/C][/ROW]
[ROW][C]25[/C][C]0.003983[/C][C]0.0436[/C][C]0.482637[/C][/ROW]
[ROW][C]26[/C][C]-0.005143[/C][C]-0.0563[/C][C]0.477584[/C][/ROW]
[ROW][C]27[/C][C]0.074606[/C][C]0.8173[/C][C]0.207699[/C][/ROW]
[ROW][C]28[/C][C]-0.017367[/C][C]-0.1902[/C][C]0.424718[/C][/ROW]
[ROW][C]29[/C][C]-0.037344[/C][C]-0.4091[/C][C]0.341605[/C][/ROW]
[ROW][C]30[/C][C]0.052486[/C][C]0.575[/C][C]0.2832[/C][/ROW]
[ROW][C]31[/C][C]0.021895[/C][C]0.2398[/C][C]0.405428[/C][/ROW]
[ROW][C]32[/C][C]-0.027032[/C][C]-0.2961[/C][C]0.383825[/C][/ROW]
[ROW][C]33[/C][C]-0.033333[/C][C]-0.3651[/C][C]0.357822[/C][/ROW]
[ROW][C]34[/C][C]-0.021375[/C][C]-0.2342[/C][C]0.407634[/C][/ROW]
[ROW][C]35[/C][C]-0.051711[/C][C]-0.5665[/C][C]0.286068[/C][/ROW]
[ROW][C]36[/C][C]0.061172[/C][C]0.6701[/C][C]0.252038[/C][/ROW]
[ROW][C]37[/C][C]0.039706[/C][C]0.435[/C][C]0.332189[/C][/ROW]
[ROW][C]38[/C][C]-0.073779[/C][C]-0.8082[/C][C]0.210285[/C][/ROW]
[ROW][C]39[/C][C]0.019557[/C][C]0.2142[/C][C]0.415363[/C][/ROW]
[ROW][C]40[/C][C]0.007927[/C][C]0.0868[/C][C]0.465474[/C][/ROW]
[ROW][C]41[/C][C]0.09149[/C][C]1.0022[/C][C]0.159126[/C][/ROW]
[ROW][C]42[/C][C]-0.079861[/C][C]-0.8748[/C][C]0.191705[/C][/ROW]
[ROW][C]43[/C][C]-0.048321[/C][C]-0.5293[/C][C]0.298776[/C][/ROW]
[ROW][C]44[/C][C]-0.003492[/C][C]-0.0383[/C][C]0.484773[/C][/ROW]
[ROW][C]45[/C][C]-0.005979[/C][C]-0.0655[/C][C]0.473944[/C][/ROW]
[ROW][C]46[/C][C]-0.004158[/C][C]-0.0456[/C][C]0.481872[/C][/ROW]
[ROW][C]47[/C][C]0.01122[/C][C]0.1229[/C][C]0.451191[/C][/ROW]
[ROW][C]48[/C][C]0.014206[/C][C]0.1556[/C][C]0.438298[/C][/ROW]
[/TABLE]
Source: https://freestatistics.org/blog/index.php?pk=78143&T=2

Globally Unique Identifier (entire table): ba.freestatistics.org/blog/index.php?pk=78143&T=2

As an alternative you can also use a QR Code:  

The GUIDs for individual cells are displayed in the table below:

Partial Autocorrelation Function
Time lag kPACF(k)T-STATP-value
10.6518757.14090
2-0.404816-4.43451e-05
30.1026621.12460.131501
4-0.106287-1.16430.123302
50.2053942.250.013136
6-0.122524-1.34220.091034
7-0.056486-0.61880.268618
8-0.095103-1.04180.149798
90.1986412.1760.015757
100.1420381.55590.061177
110.6058376.63660
120.249692.73520.00359
13-0.604975-6.62720
140.0784010.85880.19607
15-0.073977-0.81040.209664
16-0.028169-0.30860.37909
17-0.175642-1.92410.028357
18-0.036427-0.3990.345286
190.0243380.26660.395113
200.0622390.68180.248342
21-0.071684-0.78530.216926
22-0.006432-0.07050.471972
23-0.096434-1.05640.146459
24-0.010233-0.11210.455467
250.0039830.04360.482637
26-0.005143-0.05630.477584
270.0746060.81730.207699
28-0.017367-0.19020.424718
29-0.037344-0.40910.341605
300.0524860.5750.2832
310.0218950.23980.405428
32-0.027032-0.29610.383825
33-0.033333-0.36510.357822
34-0.021375-0.23420.407634
35-0.051711-0.56650.286068
360.0611720.67010.252038
370.0397060.4350.332189
38-0.073779-0.80820.210285
390.0195570.21420.415363
400.0079270.08680.465474
410.091491.00220.159126
42-0.079861-0.87480.191705
43-0.048321-0.52930.298776
44-0.003492-0.03830.484773
45-0.005979-0.06550.473944
46-0.004158-0.04560.481872
470.011220.12290.451191
480.0142060.15560.438298


Parameters (Session):
par1 = 48 ; par2 = 1 ; par3 = 0 ; par4 = 0 ; par5 = 12 ; par6 = White Noise ; par7 = 0.95 ;
Parameters (R input):
par1 = 48 ; par2 = 1 ; par3 = 0 ; par4 = 0 ; par5 = 12 ; par6 = White Noise ; par7 = 0.95 ;
R code (references can be found in the software module):
if (par1 == 'Default') {
par1 = 10*log10(length(x))
} else {
par1 <- as.numeric(par1)
}
par2 <- as.numeric(par2)
par3 <- as.numeric(par3)
par4 <- as.numeric(par4)
par5 <- as.numeric(par5)
if (par6 == 'White Noise') par6 <- 'white' else par6 <- 'ma'
par7 <- as.numeric(par7)
if (par2 == 0) {
x <- log(x)
} else {
x <- (x ^ par2 - 1) / par2
}
if (par3 > 0) x <- diff(x,lag=1,difference=par3)
if (par4 > 0) x <- diff(x,lag=par5,difference=par4)
bitmap(file='pic1.png')
racf <- acf(x, par1, main='Autocorrelation', xlab='time lag', ylab='ACF', ci.type=par6, ci=par7, sub=paste('(lambda=',par2,', d=',par3,', D=',par4,', CI=', par7, ', CI type=',par6,')',sep=''))
dev.off()
bitmap(file='pic2.png')
rpacf <- pacf(x,par1,main='Partial Autocorrelation',xlab='lags',ylab='PACF')
dev.off()
(myacf <- c(racf$acf))
(mypacf <- c(rpacf$acf))
lengthx <- length(x)
sqrtn <- sqrt(lengthx)
load(file='createtable')
a<-table.start()
a<-table.row.start(a)
a<-table.element(a,'Autocorrelation Function',4,TRUE)
a<-table.row.end(a)
a<-table.row.start(a)
a<-table.element(a,'Time lag k',header=TRUE)
a<-table.element(a,hyperlink('basics.htm','ACF(k)','click here for more information about the Autocorrelation Function'),header=TRUE)
a<-table.element(a,'T-STAT',header=TRUE)
a<-table.element(a,'P-value',header=TRUE)
a<-table.row.end(a)
for (i in 2:(par1+1)) {
a<-table.row.start(a)
a<-table.element(a,i-1,header=TRUE)
a<-table.element(a,round(myacf[i],6))
mytstat <- myacf[i]*sqrtn
a<-table.element(a,round(mytstat,4))
a<-table.element(a,round(1-pt(abs(mytstat),lengthx),6))
a<-table.row.end(a)
}
a<-table.end(a)
table.save(a,file='mytable.tab')
a<-table.start()
a<-table.row.start(a)
a<-table.element(a,'Partial Autocorrelation Function',4,TRUE)
a<-table.row.end(a)
a<-table.row.start(a)
a<-table.element(a,'Time lag k',header=TRUE)
a<-table.element(a,hyperlink('basics.htm','PACF(k)','click here for more information about the Partial Autocorrelation Function'),header=TRUE)
a<-table.element(a,'T-STAT',header=TRUE)
a<-table.element(a,'P-value',header=TRUE)
a<-table.row.end(a)
for (i in 1:par1) {
a<-table.row.start(a)
a<-table.element(a,i,header=TRUE)
a<-table.element(a,round(mypacf[i],6))
mytstat <- mypacf[i]*sqrtn
a<-table.element(a,round(mytstat,4))
a<-table.element(a,round(1-pt(abs(mytstat),lengthx),6))
a<-table.row.end(a)
}
a<-table.end(a)
table.save(a,file='mytable1.tab')