Free Statistics

of Irreproducible Research!

Author's title

Author*Unverified author*
R Software Modulerwasp_autocorrelation.wasp
Title produced by software(Partial) Autocorrelation Function
Date of computationMon, 26 Jul 2010 15:49:09 +0000
Cite this page as followsStatistical Computations at FreeStatistics.org, Office for Research Development and Education, URL https://freestatistics.org/blog/index.php?v=date/2010/Jul/26/t128015933682ukzpcrkdv1q8k.htm/, Retrieved Sat, 04 May 2024 06:27:20 +0000
Statistical Computations at FreeStatistics.org, Office for Research Development and Education, URL https://freestatistics.org/blog/index.php?pk=78125, Retrieved Sat, 04 May 2024 06:27:20 +0000
QR Codes:

Original text written by user:
IsPrivate?No (this computation is public)
User-defined keywordsHoes Isabelle
Estimated Impact181
Family? (F = Feedback message, R = changed R code, M = changed R Module, P = changed Parameters, D = changed Data)
-       [(Partial) Autocorrelation Function] [TIJDREEKS A - STA...] [2010-07-26 15:49:09] [35611de12c9fa8a4a915f3548e0dcd01] [Current]
Feedback Forum

Post a new message
Dataseries X:
698
697
696
694
714
713
698
688
689
689
690
692
688
679
677
673
694
690
673
659
657
654
644
643
638
626
621
615
640
633
620
610
601
595
585
584
580
574
560
550
580
569
551
536
535
526
517
512
510
501
496
491
524
514
495
479
479
467
451
459
461
460
452
449
483
470
442
419
419
406
393
396
390
389
373
371
407
391
357
327
321
317
300
304
296
296
283
279
319
295
255
227
228
233
210
219
212
209
201
198
245
216
173
144
143
152
127
141
129
127
113
117
174
143
103
81
92
104
81
89


Summary of computational transaction
Raw Inputview raw input (R code)
Raw Outputview raw output of R engine
Computing time1 seconds
R Server'Gwilym Jenkins' @ 72.249.127.135

\begin{tabular}{lllllllll}
\hline
Summary of computational transaction \tabularnewline
Raw Input & view raw input (R code)  \tabularnewline
Raw Output & view raw output of R engine  \tabularnewline
Computing time & 1 seconds \tabularnewline
R Server & 'Gwilym Jenkins' @ 72.249.127.135 \tabularnewline
\hline
\end{tabular}
%Source: https://freestatistics.org/blog/index.php?pk=78125&T=0

[TABLE]
[ROW][C]Summary of computational transaction[/C][/ROW]
[ROW][C]Raw Input[/C][C]view raw input (R code) [/C][/ROW]
[ROW][C]Raw Output[/C][C]view raw output of R engine [/C][/ROW]
[ROW][C]Computing time[/C][C]1 seconds[/C][/ROW]
[ROW][C]R Server[/C][C]'Gwilym Jenkins' @ 72.249.127.135[/C][/ROW]
[/TABLE]
Source: https://freestatistics.org/blog/index.php?pk=78125&T=0

Globally Unique Identifier (entire table): ba.freestatistics.org/blog/index.php?pk=78125&T=0

As an alternative you can also use a QR Code:  

The GUIDs for individual cells are displayed in the table below:

Summary of computational transaction
Raw Inputview raw input (R code)
Raw Outputview raw output of R engine
Computing time1 seconds
R Server'Gwilym Jenkins' @ 72.249.127.135


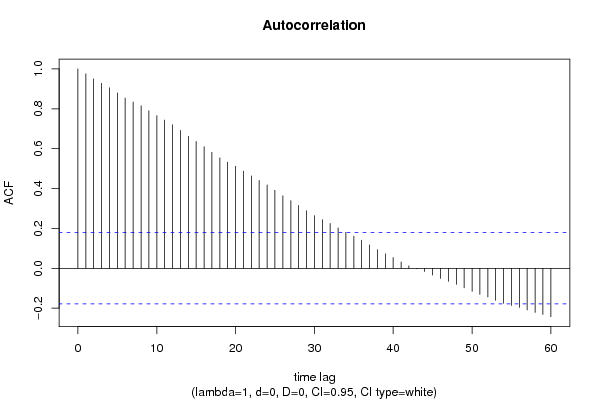
Autocorrelation Function
Time lag kACF(k)T-STATP-value
10.97568410.68810
20.95000810.40680
30.92787310.16430
40.9056039.92040
50.8798839.63860
60.8540669.35580
70.8337849.13370
80.8148088.92580
90.7901848.6560
100.7657118.38790
110.7434678.14430
120.7202747.89020
130.6918277.57860
140.6622487.25460
150.6362076.96930
160.6101916.68430
170.5816566.37170
180.5541056.06990
190.5321945.82990
200.5120175.60890
210.4871855.33680
220.4630445.07241e-06
230.4410134.83112e-06
240.4182644.58196e-06
250.3910384.28361.9e-05
260.3634013.98095.9e-05
270.3392963.71680.000154
280.3155283.45640.000379
290.2890333.16620.000979
300.2638662.89050.002283
310.243582.66830.004339
320.2247862.46240.00761
330.2024222.21740.014239
340.1807731.98030.024981
350.1613411.76740.039851
360.1410171.54480.062519
370.1172281.28420.100779
380.0932651.02170.154497
390.0728270.79780.213286
400.053620.58740.279027
410.0320150.35070.363212
420.0122880.13460.446575
43-0.002904-0.03180.487337
44-0.01668-0.18270.427663
45-0.034013-0.37260.355055
46-0.050783-0.55630.289522
47-0.065275-0.71510.237983
48-0.080178-0.87830.190765
49-0.097954-1.0730.142704
50-0.115535-1.26560.10405
51-0.130676-1.43150.077445
52-0.144156-1.57920.058467
53-0.160538-1.75860.040597
54-0.175462-1.92210.028483
55-0.186395-2.04190.021679
56-0.196098-2.14810.016856
57-0.209004-2.28950.011898
58-0.22119-2.4230.008443
59-0.231389-2.53470.00627
60-0.242634-2.65790.004467

\begin{tabular}{lllllllll}
\hline
Autocorrelation Function \tabularnewline
Time lag k & ACF(k) & T-STAT & P-value \tabularnewline
1 & 0.975684 & 10.6881 & 0 \tabularnewline
2 & 0.950008 & 10.4068 & 0 \tabularnewline
3 & 0.927873 & 10.1643 & 0 \tabularnewline
4 & 0.905603 & 9.9204 & 0 \tabularnewline
5 & 0.879883 & 9.6386 & 0 \tabularnewline
6 & 0.854066 & 9.3558 & 0 \tabularnewline
7 & 0.833784 & 9.1337 & 0 \tabularnewline
8 & 0.814808 & 8.9258 & 0 \tabularnewline
9 & 0.790184 & 8.656 & 0 \tabularnewline
10 & 0.765711 & 8.3879 & 0 \tabularnewline
11 & 0.743467 & 8.1443 & 0 \tabularnewline
12 & 0.720274 & 7.8902 & 0 \tabularnewline
13 & 0.691827 & 7.5786 & 0 \tabularnewline
14 & 0.662248 & 7.2546 & 0 \tabularnewline
15 & 0.636207 & 6.9693 & 0 \tabularnewline
16 & 0.610191 & 6.6843 & 0 \tabularnewline
17 & 0.581656 & 6.3717 & 0 \tabularnewline
18 & 0.554105 & 6.0699 & 0 \tabularnewline
19 & 0.532194 & 5.8299 & 0 \tabularnewline
20 & 0.512017 & 5.6089 & 0 \tabularnewline
21 & 0.487185 & 5.3368 & 0 \tabularnewline
22 & 0.463044 & 5.0724 & 1e-06 \tabularnewline
23 & 0.441013 & 4.8311 & 2e-06 \tabularnewline
24 & 0.418264 & 4.5819 & 6e-06 \tabularnewline
25 & 0.391038 & 4.2836 & 1.9e-05 \tabularnewline
26 & 0.363401 & 3.9809 & 5.9e-05 \tabularnewline
27 & 0.339296 & 3.7168 & 0.000154 \tabularnewline
28 & 0.315528 & 3.4564 & 0.000379 \tabularnewline
29 & 0.289033 & 3.1662 & 0.000979 \tabularnewline
30 & 0.263866 & 2.8905 & 0.002283 \tabularnewline
31 & 0.24358 & 2.6683 & 0.004339 \tabularnewline
32 & 0.224786 & 2.4624 & 0.00761 \tabularnewline
33 & 0.202422 & 2.2174 & 0.014239 \tabularnewline
34 & 0.180773 & 1.9803 & 0.024981 \tabularnewline
35 & 0.161341 & 1.7674 & 0.039851 \tabularnewline
36 & 0.141017 & 1.5448 & 0.062519 \tabularnewline
37 & 0.117228 & 1.2842 & 0.100779 \tabularnewline
38 & 0.093265 & 1.0217 & 0.154497 \tabularnewline
39 & 0.072827 & 0.7978 & 0.213286 \tabularnewline
40 & 0.05362 & 0.5874 & 0.279027 \tabularnewline
41 & 0.032015 & 0.3507 & 0.363212 \tabularnewline
42 & 0.012288 & 0.1346 & 0.446575 \tabularnewline
43 & -0.002904 & -0.0318 & 0.487337 \tabularnewline
44 & -0.01668 & -0.1827 & 0.427663 \tabularnewline
45 & -0.034013 & -0.3726 & 0.355055 \tabularnewline
46 & -0.050783 & -0.5563 & 0.289522 \tabularnewline
47 & -0.065275 & -0.7151 & 0.237983 \tabularnewline
48 & -0.080178 & -0.8783 & 0.190765 \tabularnewline
49 & -0.097954 & -1.073 & 0.142704 \tabularnewline
50 & -0.115535 & -1.2656 & 0.10405 \tabularnewline
51 & -0.130676 & -1.4315 & 0.077445 \tabularnewline
52 & -0.144156 & -1.5792 & 0.058467 \tabularnewline
53 & -0.160538 & -1.7586 & 0.040597 \tabularnewline
54 & -0.175462 & -1.9221 & 0.028483 \tabularnewline
55 & -0.186395 & -2.0419 & 0.021679 \tabularnewline
56 & -0.196098 & -2.1481 & 0.016856 \tabularnewline
57 & -0.209004 & -2.2895 & 0.011898 \tabularnewline
58 & -0.22119 & -2.423 & 0.008443 \tabularnewline
59 & -0.231389 & -2.5347 & 0.00627 \tabularnewline
60 & -0.242634 & -2.6579 & 0.004467 \tabularnewline
\hline
\end{tabular}
%Source: https://freestatistics.org/blog/index.php?pk=78125&T=1

[TABLE]
[ROW][C]Autocorrelation Function[/C][/ROW]
[ROW][C]Time lag k[/C][C]ACF(k)[/C][C]T-STAT[/C][C]P-value[/C][/ROW]
[ROW][C]1[/C][C]0.975684[/C][C]10.6881[/C][C]0[/C][/ROW]
[ROW][C]2[/C][C]0.950008[/C][C]10.4068[/C][C]0[/C][/ROW]
[ROW][C]3[/C][C]0.927873[/C][C]10.1643[/C][C]0[/C][/ROW]
[ROW][C]4[/C][C]0.905603[/C][C]9.9204[/C][C]0[/C][/ROW]
[ROW][C]5[/C][C]0.879883[/C][C]9.6386[/C][C]0[/C][/ROW]
[ROW][C]6[/C][C]0.854066[/C][C]9.3558[/C][C]0[/C][/ROW]
[ROW][C]7[/C][C]0.833784[/C][C]9.1337[/C][C]0[/C][/ROW]
[ROW][C]8[/C][C]0.814808[/C][C]8.9258[/C][C]0[/C][/ROW]
[ROW][C]9[/C][C]0.790184[/C][C]8.656[/C][C]0[/C][/ROW]
[ROW][C]10[/C][C]0.765711[/C][C]8.3879[/C][C]0[/C][/ROW]
[ROW][C]11[/C][C]0.743467[/C][C]8.1443[/C][C]0[/C][/ROW]
[ROW][C]12[/C][C]0.720274[/C][C]7.8902[/C][C]0[/C][/ROW]
[ROW][C]13[/C][C]0.691827[/C][C]7.5786[/C][C]0[/C][/ROW]
[ROW][C]14[/C][C]0.662248[/C][C]7.2546[/C][C]0[/C][/ROW]
[ROW][C]15[/C][C]0.636207[/C][C]6.9693[/C][C]0[/C][/ROW]
[ROW][C]16[/C][C]0.610191[/C][C]6.6843[/C][C]0[/C][/ROW]
[ROW][C]17[/C][C]0.581656[/C][C]6.3717[/C][C]0[/C][/ROW]
[ROW][C]18[/C][C]0.554105[/C][C]6.0699[/C][C]0[/C][/ROW]
[ROW][C]19[/C][C]0.532194[/C][C]5.8299[/C][C]0[/C][/ROW]
[ROW][C]20[/C][C]0.512017[/C][C]5.6089[/C][C]0[/C][/ROW]
[ROW][C]21[/C][C]0.487185[/C][C]5.3368[/C][C]0[/C][/ROW]
[ROW][C]22[/C][C]0.463044[/C][C]5.0724[/C][C]1e-06[/C][/ROW]
[ROW][C]23[/C][C]0.441013[/C][C]4.8311[/C][C]2e-06[/C][/ROW]
[ROW][C]24[/C][C]0.418264[/C][C]4.5819[/C][C]6e-06[/C][/ROW]
[ROW][C]25[/C][C]0.391038[/C][C]4.2836[/C][C]1.9e-05[/C][/ROW]
[ROW][C]26[/C][C]0.363401[/C][C]3.9809[/C][C]5.9e-05[/C][/ROW]
[ROW][C]27[/C][C]0.339296[/C][C]3.7168[/C][C]0.000154[/C][/ROW]
[ROW][C]28[/C][C]0.315528[/C][C]3.4564[/C][C]0.000379[/C][/ROW]
[ROW][C]29[/C][C]0.289033[/C][C]3.1662[/C][C]0.000979[/C][/ROW]
[ROW][C]30[/C][C]0.263866[/C][C]2.8905[/C][C]0.002283[/C][/ROW]
[ROW][C]31[/C][C]0.24358[/C][C]2.6683[/C][C]0.004339[/C][/ROW]
[ROW][C]32[/C][C]0.224786[/C][C]2.4624[/C][C]0.00761[/C][/ROW]
[ROW][C]33[/C][C]0.202422[/C][C]2.2174[/C][C]0.014239[/C][/ROW]
[ROW][C]34[/C][C]0.180773[/C][C]1.9803[/C][C]0.024981[/C][/ROW]
[ROW][C]35[/C][C]0.161341[/C][C]1.7674[/C][C]0.039851[/C][/ROW]
[ROW][C]36[/C][C]0.141017[/C][C]1.5448[/C][C]0.062519[/C][/ROW]
[ROW][C]37[/C][C]0.117228[/C][C]1.2842[/C][C]0.100779[/C][/ROW]
[ROW][C]38[/C][C]0.093265[/C][C]1.0217[/C][C]0.154497[/C][/ROW]
[ROW][C]39[/C][C]0.072827[/C][C]0.7978[/C][C]0.213286[/C][/ROW]
[ROW][C]40[/C][C]0.05362[/C][C]0.5874[/C][C]0.279027[/C][/ROW]
[ROW][C]41[/C][C]0.032015[/C][C]0.3507[/C][C]0.363212[/C][/ROW]
[ROW][C]42[/C][C]0.012288[/C][C]0.1346[/C][C]0.446575[/C][/ROW]
[ROW][C]43[/C][C]-0.002904[/C][C]-0.0318[/C][C]0.487337[/C][/ROW]
[ROW][C]44[/C][C]-0.01668[/C][C]-0.1827[/C][C]0.427663[/C][/ROW]
[ROW][C]45[/C][C]-0.034013[/C][C]-0.3726[/C][C]0.355055[/C][/ROW]
[ROW][C]46[/C][C]-0.050783[/C][C]-0.5563[/C][C]0.289522[/C][/ROW]
[ROW][C]47[/C][C]-0.065275[/C][C]-0.7151[/C][C]0.237983[/C][/ROW]
[ROW][C]48[/C][C]-0.080178[/C][C]-0.8783[/C][C]0.190765[/C][/ROW]
[ROW][C]49[/C][C]-0.097954[/C][C]-1.073[/C][C]0.142704[/C][/ROW]
[ROW][C]50[/C][C]-0.115535[/C][C]-1.2656[/C][C]0.10405[/C][/ROW]
[ROW][C]51[/C][C]-0.130676[/C][C]-1.4315[/C][C]0.077445[/C][/ROW]
[ROW][C]52[/C][C]-0.144156[/C][C]-1.5792[/C][C]0.058467[/C][/ROW]
[ROW][C]53[/C][C]-0.160538[/C][C]-1.7586[/C][C]0.040597[/C][/ROW]
[ROW][C]54[/C][C]-0.175462[/C][C]-1.9221[/C][C]0.028483[/C][/ROW]
[ROW][C]55[/C][C]-0.186395[/C][C]-2.0419[/C][C]0.021679[/C][/ROW]
[ROW][C]56[/C][C]-0.196098[/C][C]-2.1481[/C][C]0.016856[/C][/ROW]
[ROW][C]57[/C][C]-0.209004[/C][C]-2.2895[/C][C]0.011898[/C][/ROW]
[ROW][C]58[/C][C]-0.22119[/C][C]-2.423[/C][C]0.008443[/C][/ROW]
[ROW][C]59[/C][C]-0.231389[/C][C]-2.5347[/C][C]0.00627[/C][/ROW]
[ROW][C]60[/C][C]-0.242634[/C][C]-2.6579[/C][C]0.004467[/C][/ROW]
[/TABLE]
Source: https://freestatistics.org/blog/index.php?pk=78125&T=1

Globally Unique Identifier (entire table): ba.freestatistics.org/blog/index.php?pk=78125&T=1

As an alternative you can also use a QR Code:  

The GUIDs for individual cells are displayed in the table below:

Autocorrelation Function
Time lag kACF(k)T-STATP-value
10.97568410.68810
20.95000810.40680
30.92787310.16430
40.9056039.92040
50.8798839.63860
60.8540669.35580
70.8337849.13370
80.8148088.92580
90.7901848.6560
100.7657118.38790
110.7434678.14430
120.7202747.89020
130.6918277.57860
140.6622487.25460
150.6362076.96930
160.6101916.68430
170.5816566.37170
180.5541056.06990
190.5321945.82990
200.5120175.60890
210.4871855.33680
220.4630445.07241e-06
230.4410134.83112e-06
240.4182644.58196e-06
250.3910384.28361.9e-05
260.3634013.98095.9e-05
270.3392963.71680.000154
280.3155283.45640.000379
290.2890333.16620.000979
300.2638662.89050.002283
310.243582.66830.004339
320.2247862.46240.00761
330.2024222.21740.014239
340.1807731.98030.024981
350.1613411.76740.039851
360.1410171.54480.062519
370.1172281.28420.100779
380.0932651.02170.154497
390.0728270.79780.213286
400.053620.58740.279027
410.0320150.35070.363212
420.0122880.13460.446575
43-0.002904-0.03180.487337
44-0.01668-0.18270.427663
45-0.034013-0.37260.355055
46-0.050783-0.55630.289522
47-0.065275-0.71510.237983
48-0.080178-0.87830.190765
49-0.097954-1.0730.142704
50-0.115535-1.26560.10405
51-0.130676-1.43150.077445
52-0.144156-1.57920.058467
53-0.160538-1.75860.040597
54-0.175462-1.92210.028483
55-0.186395-2.04190.021679
56-0.196098-2.14810.016856
57-0.209004-2.28950.011898
58-0.22119-2.4230.008443
59-0.231389-2.53470.00627
60-0.242634-2.65790.004467


Partial Autocorrelation Function
Time lag kPACF(k)T-STATP-value
10.97568410.68810
2-0.040602-0.44480.328644
30.0614270.67290.251153
4-0.01865-0.20430.419231
5-0.078279-0.85750.196437
6-0.012204-0.13370.446937
70.0929241.01790.155379
80.0101920.11160.455645
9-0.112915-1.23690.109266
10-0.001433-0.01570.49375
110.0062770.06880.472647
12-0.037165-0.40710.342322
13-0.096788-1.06030.145579
14-0.032843-0.35980.359823
150.0239150.2620.396896
16-0.022728-0.2490.401903
17-0.036328-0.3980.345686
180.0034360.03760.485017
190.068160.74670.228366
200.0150910.16530.434488
21-0.074755-0.81890.207234
220.0081980.08980.464296
23-0.010501-0.1150.454305
24-0.028756-0.3150.376651
25-0.067437-0.73870.230754
26-0.017868-0.19570.422573
270.008690.09520.462161
28-0.018508-0.20270.419841
29-0.036283-0.39750.345865
300.0018830.02060.491787
310.0385360.42210.336839
320.0071390.07820.468896
33-0.045931-0.50310.307893
340.0043070.04720.481226
35-0.013476-0.14760.441442
36-0.030678-0.33610.368706
37-0.04023-0.44070.330112
38-0.016946-0.18560.426523
390.004950.05420.478423
400.0012770.0140.494433
41-0.029373-0.32180.374094
420.0098150.10750.457279
430.0277140.30360.380982
440.0072060.07890.468606
45-0.045869-0.50250.308129
460.0013140.01440.494269
47-0.013276-0.14540.442308
48-0.019545-0.21410.415415
49-0.024088-0.26390.396166
50-0.011272-0.12350.450965
51-0.019705-0.21590.414735
520.0100730.11030.45616
53-0.042212-0.46240.322312
54-0.000168-0.00180.499266
550.0158460.17360.431242
560.0043020.04710.481245
57-0.040638-0.44520.328502
580.0069390.0760.469767
59-0.017399-0.19060.424582
60-0.036782-0.40290.343859

\begin{tabular}{lllllllll}
\hline
Partial Autocorrelation Function \tabularnewline
Time lag k & PACF(k) & T-STAT & P-value \tabularnewline
1 & 0.975684 & 10.6881 & 0 \tabularnewline
2 & -0.040602 & -0.4448 & 0.328644 \tabularnewline
3 & 0.061427 & 0.6729 & 0.251153 \tabularnewline
4 & -0.01865 & -0.2043 & 0.419231 \tabularnewline
5 & -0.078279 & -0.8575 & 0.196437 \tabularnewline
6 & -0.012204 & -0.1337 & 0.446937 \tabularnewline
7 & 0.092924 & 1.0179 & 0.155379 \tabularnewline
8 & 0.010192 & 0.1116 & 0.455645 \tabularnewline
9 & -0.112915 & -1.2369 & 0.109266 \tabularnewline
10 & -0.001433 & -0.0157 & 0.49375 \tabularnewline
11 & 0.006277 & 0.0688 & 0.472647 \tabularnewline
12 & -0.037165 & -0.4071 & 0.342322 \tabularnewline
13 & -0.096788 & -1.0603 & 0.145579 \tabularnewline
14 & -0.032843 & -0.3598 & 0.359823 \tabularnewline
15 & 0.023915 & 0.262 & 0.396896 \tabularnewline
16 & -0.022728 & -0.249 & 0.401903 \tabularnewline
17 & -0.036328 & -0.398 & 0.345686 \tabularnewline
18 & 0.003436 & 0.0376 & 0.485017 \tabularnewline
19 & 0.06816 & 0.7467 & 0.228366 \tabularnewline
20 & 0.015091 & 0.1653 & 0.434488 \tabularnewline
21 & -0.074755 & -0.8189 & 0.207234 \tabularnewline
22 & 0.008198 & 0.0898 & 0.464296 \tabularnewline
23 & -0.010501 & -0.115 & 0.454305 \tabularnewline
24 & -0.028756 & -0.315 & 0.376651 \tabularnewline
25 & -0.067437 & -0.7387 & 0.230754 \tabularnewline
26 & -0.017868 & -0.1957 & 0.422573 \tabularnewline
27 & 0.00869 & 0.0952 & 0.462161 \tabularnewline
28 & -0.018508 & -0.2027 & 0.419841 \tabularnewline
29 & -0.036283 & -0.3975 & 0.345865 \tabularnewline
30 & 0.001883 & 0.0206 & 0.491787 \tabularnewline
31 & 0.038536 & 0.4221 & 0.336839 \tabularnewline
32 & 0.007139 & 0.0782 & 0.468896 \tabularnewline
33 & -0.045931 & -0.5031 & 0.307893 \tabularnewline
34 & 0.004307 & 0.0472 & 0.481226 \tabularnewline
35 & -0.013476 & -0.1476 & 0.441442 \tabularnewline
36 & -0.030678 & -0.3361 & 0.368706 \tabularnewline
37 & -0.04023 & -0.4407 & 0.330112 \tabularnewline
38 & -0.016946 & -0.1856 & 0.426523 \tabularnewline
39 & 0.00495 & 0.0542 & 0.478423 \tabularnewline
40 & 0.001277 & 0.014 & 0.494433 \tabularnewline
41 & -0.029373 & -0.3218 & 0.374094 \tabularnewline
42 & 0.009815 & 0.1075 & 0.457279 \tabularnewline
43 & 0.027714 & 0.3036 & 0.380982 \tabularnewline
44 & 0.007206 & 0.0789 & 0.468606 \tabularnewline
45 & -0.045869 & -0.5025 & 0.308129 \tabularnewline
46 & 0.001314 & 0.0144 & 0.494269 \tabularnewline
47 & -0.013276 & -0.1454 & 0.442308 \tabularnewline
48 & -0.019545 & -0.2141 & 0.415415 \tabularnewline
49 & -0.024088 & -0.2639 & 0.396166 \tabularnewline
50 & -0.011272 & -0.1235 & 0.450965 \tabularnewline
51 & -0.019705 & -0.2159 & 0.414735 \tabularnewline
52 & 0.010073 & 0.1103 & 0.45616 \tabularnewline
53 & -0.042212 & -0.4624 & 0.322312 \tabularnewline
54 & -0.000168 & -0.0018 & 0.499266 \tabularnewline
55 & 0.015846 & 0.1736 & 0.431242 \tabularnewline
56 & 0.004302 & 0.0471 & 0.481245 \tabularnewline
57 & -0.040638 & -0.4452 & 0.328502 \tabularnewline
58 & 0.006939 & 0.076 & 0.469767 \tabularnewline
59 & -0.017399 & -0.1906 & 0.424582 \tabularnewline
60 & -0.036782 & -0.4029 & 0.343859 \tabularnewline
\hline
\end{tabular}
%Source: https://freestatistics.org/blog/index.php?pk=78125&T=2

[TABLE]
[ROW][C]Partial Autocorrelation Function[/C][/ROW]
[ROW][C]Time lag k[/C][C]PACF(k)[/C][C]T-STAT[/C][C]P-value[/C][/ROW]
[ROW][C]1[/C][C]0.975684[/C][C]10.6881[/C][C]0[/C][/ROW]
[ROW][C]2[/C][C]-0.040602[/C][C]-0.4448[/C][C]0.328644[/C][/ROW]
[ROW][C]3[/C][C]0.061427[/C][C]0.6729[/C][C]0.251153[/C][/ROW]
[ROW][C]4[/C][C]-0.01865[/C][C]-0.2043[/C][C]0.419231[/C][/ROW]
[ROW][C]5[/C][C]-0.078279[/C][C]-0.8575[/C][C]0.196437[/C][/ROW]
[ROW][C]6[/C][C]-0.012204[/C][C]-0.1337[/C][C]0.446937[/C][/ROW]
[ROW][C]7[/C][C]0.092924[/C][C]1.0179[/C][C]0.155379[/C][/ROW]
[ROW][C]8[/C][C]0.010192[/C][C]0.1116[/C][C]0.455645[/C][/ROW]
[ROW][C]9[/C][C]-0.112915[/C][C]-1.2369[/C][C]0.109266[/C][/ROW]
[ROW][C]10[/C][C]-0.001433[/C][C]-0.0157[/C][C]0.49375[/C][/ROW]
[ROW][C]11[/C][C]0.006277[/C][C]0.0688[/C][C]0.472647[/C][/ROW]
[ROW][C]12[/C][C]-0.037165[/C][C]-0.4071[/C][C]0.342322[/C][/ROW]
[ROW][C]13[/C][C]-0.096788[/C][C]-1.0603[/C][C]0.145579[/C][/ROW]
[ROW][C]14[/C][C]-0.032843[/C][C]-0.3598[/C][C]0.359823[/C][/ROW]
[ROW][C]15[/C][C]0.023915[/C][C]0.262[/C][C]0.396896[/C][/ROW]
[ROW][C]16[/C][C]-0.022728[/C][C]-0.249[/C][C]0.401903[/C][/ROW]
[ROW][C]17[/C][C]-0.036328[/C][C]-0.398[/C][C]0.345686[/C][/ROW]
[ROW][C]18[/C][C]0.003436[/C][C]0.0376[/C][C]0.485017[/C][/ROW]
[ROW][C]19[/C][C]0.06816[/C][C]0.7467[/C][C]0.228366[/C][/ROW]
[ROW][C]20[/C][C]0.015091[/C][C]0.1653[/C][C]0.434488[/C][/ROW]
[ROW][C]21[/C][C]-0.074755[/C][C]-0.8189[/C][C]0.207234[/C][/ROW]
[ROW][C]22[/C][C]0.008198[/C][C]0.0898[/C][C]0.464296[/C][/ROW]
[ROW][C]23[/C][C]-0.010501[/C][C]-0.115[/C][C]0.454305[/C][/ROW]
[ROW][C]24[/C][C]-0.028756[/C][C]-0.315[/C][C]0.376651[/C][/ROW]
[ROW][C]25[/C][C]-0.067437[/C][C]-0.7387[/C][C]0.230754[/C][/ROW]
[ROW][C]26[/C][C]-0.017868[/C][C]-0.1957[/C][C]0.422573[/C][/ROW]
[ROW][C]27[/C][C]0.00869[/C][C]0.0952[/C][C]0.462161[/C][/ROW]
[ROW][C]28[/C][C]-0.018508[/C][C]-0.2027[/C][C]0.419841[/C][/ROW]
[ROW][C]29[/C][C]-0.036283[/C][C]-0.3975[/C][C]0.345865[/C][/ROW]
[ROW][C]30[/C][C]0.001883[/C][C]0.0206[/C][C]0.491787[/C][/ROW]
[ROW][C]31[/C][C]0.038536[/C][C]0.4221[/C][C]0.336839[/C][/ROW]
[ROW][C]32[/C][C]0.007139[/C][C]0.0782[/C][C]0.468896[/C][/ROW]
[ROW][C]33[/C][C]-0.045931[/C][C]-0.5031[/C][C]0.307893[/C][/ROW]
[ROW][C]34[/C][C]0.004307[/C][C]0.0472[/C][C]0.481226[/C][/ROW]
[ROW][C]35[/C][C]-0.013476[/C][C]-0.1476[/C][C]0.441442[/C][/ROW]
[ROW][C]36[/C][C]-0.030678[/C][C]-0.3361[/C][C]0.368706[/C][/ROW]
[ROW][C]37[/C][C]-0.04023[/C][C]-0.4407[/C][C]0.330112[/C][/ROW]
[ROW][C]38[/C][C]-0.016946[/C][C]-0.1856[/C][C]0.426523[/C][/ROW]
[ROW][C]39[/C][C]0.00495[/C][C]0.0542[/C][C]0.478423[/C][/ROW]
[ROW][C]40[/C][C]0.001277[/C][C]0.014[/C][C]0.494433[/C][/ROW]
[ROW][C]41[/C][C]-0.029373[/C][C]-0.3218[/C][C]0.374094[/C][/ROW]
[ROW][C]42[/C][C]0.009815[/C][C]0.1075[/C][C]0.457279[/C][/ROW]
[ROW][C]43[/C][C]0.027714[/C][C]0.3036[/C][C]0.380982[/C][/ROW]
[ROW][C]44[/C][C]0.007206[/C][C]0.0789[/C][C]0.468606[/C][/ROW]
[ROW][C]45[/C][C]-0.045869[/C][C]-0.5025[/C][C]0.308129[/C][/ROW]
[ROW][C]46[/C][C]0.001314[/C][C]0.0144[/C][C]0.494269[/C][/ROW]
[ROW][C]47[/C][C]-0.013276[/C][C]-0.1454[/C][C]0.442308[/C][/ROW]
[ROW][C]48[/C][C]-0.019545[/C][C]-0.2141[/C][C]0.415415[/C][/ROW]
[ROW][C]49[/C][C]-0.024088[/C][C]-0.2639[/C][C]0.396166[/C][/ROW]
[ROW][C]50[/C][C]-0.011272[/C][C]-0.1235[/C][C]0.450965[/C][/ROW]
[ROW][C]51[/C][C]-0.019705[/C][C]-0.2159[/C][C]0.414735[/C][/ROW]
[ROW][C]52[/C][C]0.010073[/C][C]0.1103[/C][C]0.45616[/C][/ROW]
[ROW][C]53[/C][C]-0.042212[/C][C]-0.4624[/C][C]0.322312[/C][/ROW]
[ROW][C]54[/C][C]-0.000168[/C][C]-0.0018[/C][C]0.499266[/C][/ROW]
[ROW][C]55[/C][C]0.015846[/C][C]0.1736[/C][C]0.431242[/C][/ROW]
[ROW][C]56[/C][C]0.004302[/C][C]0.0471[/C][C]0.481245[/C][/ROW]
[ROW][C]57[/C][C]-0.040638[/C][C]-0.4452[/C][C]0.328502[/C][/ROW]
[ROW][C]58[/C][C]0.006939[/C][C]0.076[/C][C]0.469767[/C][/ROW]
[ROW][C]59[/C][C]-0.017399[/C][C]-0.1906[/C][C]0.424582[/C][/ROW]
[ROW][C]60[/C][C]-0.036782[/C][C]-0.4029[/C][C]0.343859[/C][/ROW]
[/TABLE]
Source: https://freestatistics.org/blog/index.php?pk=78125&T=2

Globally Unique Identifier (entire table): ba.freestatistics.org/blog/index.php?pk=78125&T=2

As an alternative you can also use a QR Code:  

The GUIDs for individual cells are displayed in the table below:

Partial Autocorrelation Function
Time lag kPACF(k)T-STATP-value
10.97568410.68810
2-0.040602-0.44480.328644
30.0614270.67290.251153
4-0.01865-0.20430.419231
5-0.078279-0.85750.196437
6-0.012204-0.13370.446937
70.0929241.01790.155379
80.0101920.11160.455645
9-0.112915-1.23690.109266
10-0.001433-0.01570.49375
110.0062770.06880.472647
12-0.037165-0.40710.342322
13-0.096788-1.06030.145579
14-0.032843-0.35980.359823
150.0239150.2620.396896
16-0.022728-0.2490.401903
17-0.036328-0.3980.345686
180.0034360.03760.485017
190.068160.74670.228366
200.0150910.16530.434488
21-0.074755-0.81890.207234
220.0081980.08980.464296
23-0.010501-0.1150.454305
24-0.028756-0.3150.376651
25-0.067437-0.73870.230754
26-0.017868-0.19570.422573
270.008690.09520.462161
28-0.018508-0.20270.419841
29-0.036283-0.39750.345865
300.0018830.02060.491787
310.0385360.42210.336839
320.0071390.07820.468896
33-0.045931-0.50310.307893
340.0043070.04720.481226
35-0.013476-0.14760.441442
36-0.030678-0.33610.368706
37-0.04023-0.44070.330112
38-0.016946-0.18560.426523
390.004950.05420.478423
400.0012770.0140.494433
41-0.029373-0.32180.374094
420.0098150.10750.457279
430.0277140.30360.380982
440.0072060.07890.468606
45-0.045869-0.50250.308129
460.0013140.01440.494269
47-0.013276-0.14540.442308
48-0.019545-0.21410.415415
49-0.024088-0.26390.396166
50-0.011272-0.12350.450965
51-0.019705-0.21590.414735
520.0100730.11030.45616
53-0.042212-0.46240.322312
54-0.000168-0.00180.499266
550.0158460.17360.431242
560.0043020.04710.481245
57-0.040638-0.44520.328502
580.0069390.0760.469767
59-0.017399-0.19060.424582
60-0.036782-0.40290.343859


Parameters (Session):
par1 = 60 ; par2 = 1 ; par3 = 0 ; par4 = 0 ; par5 = 12 ; par6 = White Noise ; par7 = 0.95 ;
Parameters (R input):
par1 = 60 ; par2 = 1 ; par3 = 0 ; par4 = 0 ; par5 = 12 ; par6 = White Noise ; par7 = 0.95 ;
R code (references can be found in the software module):
if (par1 == 'Default') {
par1 = 10*log10(length(x))
} else {
par1 <- as.numeric(par1)
}
par2 <- as.numeric(par2)
par3 <- as.numeric(par3)
par4 <- as.numeric(par4)
par5 <- as.numeric(par5)
if (par6 == 'White Noise') par6 <- 'white' else par6 <- 'ma'
par7 <- as.numeric(par7)
if (par2 == 0) {
x <- log(x)
} else {
x <- (x ^ par2 - 1) / par2
}
if (par3 > 0) x <- diff(x,lag=1,difference=par3)
if (par4 > 0) x <- diff(x,lag=par5,difference=par4)
bitmap(file='pic1.png')
racf <- acf(x, par1, main='Autocorrelation', xlab='time lag', ylab='ACF', ci.type=par6, ci=par7, sub=paste('(lambda=',par2,', d=',par3,', D=',par4,', CI=', par7, ', CI type=',par6,')',sep=''))
dev.off()
bitmap(file='pic2.png')
rpacf <- pacf(x,par1,main='Partial Autocorrelation',xlab='lags',ylab='PACF')
dev.off()
(myacf <- c(racf$acf))
(mypacf <- c(rpacf$acf))
lengthx <- length(x)
sqrtn <- sqrt(lengthx)
load(file='createtable')
a<-table.start()
a<-table.row.start(a)
a<-table.element(a,'Autocorrelation Function',4,TRUE)
a<-table.row.end(a)
a<-table.row.start(a)
a<-table.element(a,'Time lag k',header=TRUE)
a<-table.element(a,hyperlink('basics.htm','ACF(k)','click here for more information about the Autocorrelation Function'),header=TRUE)
a<-table.element(a,'T-STAT',header=TRUE)
a<-table.element(a,'P-value',header=TRUE)
a<-table.row.end(a)
for (i in 2:(par1+1)) {
a<-table.row.start(a)
a<-table.element(a,i-1,header=TRUE)
a<-table.element(a,round(myacf[i],6))
mytstat <- myacf[i]*sqrtn
a<-table.element(a,round(mytstat,4))
a<-table.element(a,round(1-pt(abs(mytstat),lengthx),6))
a<-table.row.end(a)
}
a<-table.end(a)
table.save(a,file='mytable.tab')
a<-table.start()
a<-table.row.start(a)
a<-table.element(a,'Partial Autocorrelation Function',4,TRUE)
a<-table.row.end(a)
a<-table.row.start(a)
a<-table.element(a,'Time lag k',header=TRUE)
a<-table.element(a,hyperlink('basics.htm','PACF(k)','click here for more information about the Partial Autocorrelation Function'),header=TRUE)
a<-table.element(a,'T-STAT',header=TRUE)
a<-table.element(a,'P-value',header=TRUE)
a<-table.row.end(a)
for (i in 1:par1) {
a<-table.row.start(a)
a<-table.element(a,i,header=TRUE)
a<-table.element(a,round(mypacf[i],6))
mytstat <- mypacf[i]*sqrtn
a<-table.element(a,round(mytstat,4))
a<-table.element(a,round(1-pt(abs(mytstat),lengthx),6))
a<-table.row.end(a)
}
a<-table.end(a)
table.save(a,file='mytable1.tab')