Free Statistics

of Irreproducible Research!

Author's title

Author*Unverified author*
R Software Modulerwasp_autocorrelation.wasp
Title produced by software(Partial) Autocorrelation Function
Date of computationSat, 24 Jul 2010 16:10:16 +0000
Cite this page as followsStatistical Computations at FreeStatistics.org, Office for Research Development and Education, URL https://freestatistics.org/blog/index.php?v=date/2010/Jul/24/t1279987812c1lh1cfmxll3uk9.htm/, Retrieved Wed, 01 May 2024 15:04:55 +0000
Statistical Computations at FreeStatistics.org, Office for Research Development and Education, URL https://freestatistics.org/blog/index.php?pk=78095, Retrieved Wed, 01 May 2024 15:04:55 +0000
QR Codes:

Original text written by user:
IsPrivate?No (this computation is public)
User-defined keywordsHabimana Christelle
Estimated Impact222
Family? (F = Feedback message, R = changed R code, M = changed R Module, P = changed Parameters, D = changed Data)
-       [(Partial) Autocorrelation Function] [Tijdreeks 1 - Sta...] [2010-07-24 16:10:16] [ac302f869d0778eba7cafda3b14e71eb] [Current]
Feedback Forum

Post a new message
Dataseries X:
900
899
898
896
916
915
900
890
891
891
892
894
896
889
878
883
901
897
881
866
867
866
862
871
865
856
847
859
870
872
856
839
829
825
822
827
822
812
810
816
820
823
810
793
777
772
765
765
753
742
736
740
742
742
728
707
699
696
689
692
673
653
642
648
654
653
630
609
598
601
592
591
568
538
523
530
529
534
513
491
480
478
462
461
437
411
400
405
395
407
385
366
349
343
332
327
306
276
269
268
260
274
247
226
212
199
188
179
155
124
117
116
105
112
86
64
53
42
32
24


Summary of computational transaction
Raw Inputview raw input (R code)
Raw Outputview raw output of R engine
Computing time5 seconds
R Server'George Udny Yule' @ 72.249.76.132

\begin{tabular}{lllllllll}
\hline
Summary of computational transaction \tabularnewline
Raw Input & view raw input (R code)  \tabularnewline
Raw Output & view raw output of R engine  \tabularnewline
Computing time & 5 seconds \tabularnewline
R Server & 'George Udny Yule' @ 72.249.76.132 \tabularnewline
\hline
\end{tabular}
%Source: https://freestatistics.org/blog/index.php?pk=78095&T=0

[TABLE]
[ROW][C]Summary of computational transaction[/C][/ROW]
[ROW][C]Raw Input[/C][C]view raw input (R code) [/C][/ROW]
[ROW][C]Raw Output[/C][C]view raw output of R engine [/C][/ROW]
[ROW][C]Computing time[/C][C]5 seconds[/C][/ROW]
[ROW][C]R Server[/C][C]'George Udny Yule' @ 72.249.76.132[/C][/ROW]
[/TABLE]
Source: https://freestatistics.org/blog/index.php?pk=78095&T=0

Globally Unique Identifier (entire table): ba.freestatistics.org/blog/index.php?pk=78095&T=0

As an alternative you can also use a QR Code:  

The GUIDs for individual cells are displayed in the table below:

Summary of computational transaction
Raw Inputview raw input (R code)
Raw Outputview raw output of R engine
Computing time5 seconds
R Server'George Udny Yule' @ 72.249.76.132


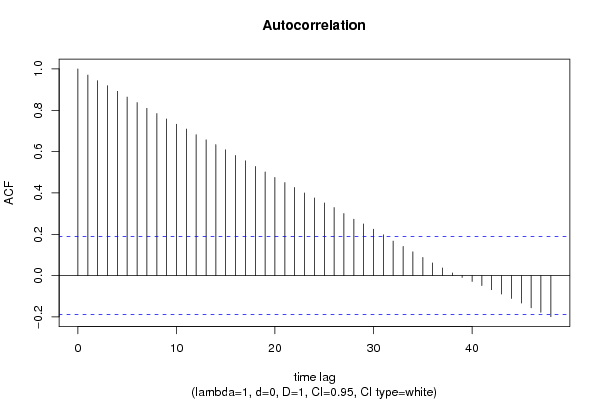
Autocorrelation Function
Time lag kACF(k)T-STATP-value
10.97064610.08720
20.9433739.80380
30.9191289.55190
40.8918419.26830
50.8641548.98060
60.8371148.69950
70.8094198.41170
80.7843078.15080
90.7582087.87950
100.7327467.61490
110.7092447.37070
120.6816517.08390
130.6569846.82760
140.6338496.58720
150.6087916.32670
160.5814276.04240
170.5552255.77010
180.528335.49060
190.501755.21430
200.474994.93621e-06
210.4503644.68034e-06
220.4267064.43451.1e-05
230.4001824.15883.2e-05
240.3759083.90658.2e-05
250.3517473.65550.000199
260.3290783.41990.000443
270.3003473.12130.001155
280.272912.83620.002726
290.2499172.59720.005354
300.2243992.3320.010777
310.1973432.05090.021351
320.1672361.7380.042534
330.1414221.46970.072275
340.1150861.1960.117157
350.0880470.9150.181111
360.0614320.63840.262277
370.0371460.3860.350117
380.0126580.13150.447795
39-0.008609-0.08950.464438
40-0.028222-0.29330.38493
41-0.048113-0.50.309045
42-0.067992-0.70660.240669
43-0.089407-0.92910.177444
44-0.110355-1.14680.126991
45-0.132937-1.38150.084986
46-0.156007-1.62130.053938
47-0.177603-1.84570.033837
48-0.198618-2.06410.020702

\begin{tabular}{lllllllll}
\hline
Autocorrelation Function \tabularnewline
Time lag k & ACF(k) & T-STAT & P-value \tabularnewline
1 & 0.970646 & 10.0872 & 0 \tabularnewline
2 & 0.943373 & 9.8038 & 0 \tabularnewline
3 & 0.919128 & 9.5519 & 0 \tabularnewline
4 & 0.891841 & 9.2683 & 0 \tabularnewline
5 & 0.864154 & 8.9806 & 0 \tabularnewline
6 & 0.837114 & 8.6995 & 0 \tabularnewline
7 & 0.809419 & 8.4117 & 0 \tabularnewline
8 & 0.784307 & 8.1508 & 0 \tabularnewline
9 & 0.758208 & 7.8795 & 0 \tabularnewline
10 & 0.732746 & 7.6149 & 0 \tabularnewline
11 & 0.709244 & 7.3707 & 0 \tabularnewline
12 & 0.681651 & 7.0839 & 0 \tabularnewline
13 & 0.656984 & 6.8276 & 0 \tabularnewline
14 & 0.633849 & 6.5872 & 0 \tabularnewline
15 & 0.608791 & 6.3267 & 0 \tabularnewline
16 & 0.581427 & 6.0424 & 0 \tabularnewline
17 & 0.555225 & 5.7701 & 0 \tabularnewline
18 & 0.52833 & 5.4906 & 0 \tabularnewline
19 & 0.50175 & 5.2143 & 0 \tabularnewline
20 & 0.47499 & 4.9362 & 1e-06 \tabularnewline
21 & 0.450364 & 4.6803 & 4e-06 \tabularnewline
22 & 0.426706 & 4.4345 & 1.1e-05 \tabularnewline
23 & 0.400182 & 4.1588 & 3.2e-05 \tabularnewline
24 & 0.375908 & 3.9065 & 8.2e-05 \tabularnewline
25 & 0.351747 & 3.6555 & 0.000199 \tabularnewline
26 & 0.329078 & 3.4199 & 0.000443 \tabularnewline
27 & 0.300347 & 3.1213 & 0.001155 \tabularnewline
28 & 0.27291 & 2.8362 & 0.002726 \tabularnewline
29 & 0.249917 & 2.5972 & 0.005354 \tabularnewline
30 & 0.224399 & 2.332 & 0.010777 \tabularnewline
31 & 0.197343 & 2.0509 & 0.021351 \tabularnewline
32 & 0.167236 & 1.738 & 0.042534 \tabularnewline
33 & 0.141422 & 1.4697 & 0.072275 \tabularnewline
34 & 0.115086 & 1.196 & 0.117157 \tabularnewline
35 & 0.088047 & 0.915 & 0.181111 \tabularnewline
36 & 0.061432 & 0.6384 & 0.262277 \tabularnewline
37 & 0.037146 & 0.386 & 0.350117 \tabularnewline
38 & 0.012658 & 0.1315 & 0.447795 \tabularnewline
39 & -0.008609 & -0.0895 & 0.464438 \tabularnewline
40 & -0.028222 & -0.2933 & 0.38493 \tabularnewline
41 & -0.048113 & -0.5 & 0.309045 \tabularnewline
42 & -0.067992 & -0.7066 & 0.240669 \tabularnewline
43 & -0.089407 & -0.9291 & 0.177444 \tabularnewline
44 & -0.110355 & -1.1468 & 0.126991 \tabularnewline
45 & -0.132937 & -1.3815 & 0.084986 \tabularnewline
46 & -0.156007 & -1.6213 & 0.053938 \tabularnewline
47 & -0.177603 & -1.8457 & 0.033837 \tabularnewline
48 & -0.198618 & -2.0641 & 0.020702 \tabularnewline
\hline
\end{tabular}
%Source: https://freestatistics.org/blog/index.php?pk=78095&T=1

[TABLE]
[ROW][C]Autocorrelation Function[/C][/ROW]
[ROW][C]Time lag k[/C][C]ACF(k)[/C][C]T-STAT[/C][C]P-value[/C][/ROW]
[ROW][C]1[/C][C]0.970646[/C][C]10.0872[/C][C]0[/C][/ROW]
[ROW][C]2[/C][C]0.943373[/C][C]9.8038[/C][C]0[/C][/ROW]
[ROW][C]3[/C][C]0.919128[/C][C]9.5519[/C][C]0[/C][/ROW]
[ROW][C]4[/C][C]0.891841[/C][C]9.2683[/C][C]0[/C][/ROW]
[ROW][C]5[/C][C]0.864154[/C][C]8.9806[/C][C]0[/C][/ROW]
[ROW][C]6[/C][C]0.837114[/C][C]8.6995[/C][C]0[/C][/ROW]
[ROW][C]7[/C][C]0.809419[/C][C]8.4117[/C][C]0[/C][/ROW]
[ROW][C]8[/C][C]0.784307[/C][C]8.1508[/C][C]0[/C][/ROW]
[ROW][C]9[/C][C]0.758208[/C][C]7.8795[/C][C]0[/C][/ROW]
[ROW][C]10[/C][C]0.732746[/C][C]7.6149[/C][C]0[/C][/ROW]
[ROW][C]11[/C][C]0.709244[/C][C]7.3707[/C][C]0[/C][/ROW]
[ROW][C]12[/C][C]0.681651[/C][C]7.0839[/C][C]0[/C][/ROW]
[ROW][C]13[/C][C]0.656984[/C][C]6.8276[/C][C]0[/C][/ROW]
[ROW][C]14[/C][C]0.633849[/C][C]6.5872[/C][C]0[/C][/ROW]
[ROW][C]15[/C][C]0.608791[/C][C]6.3267[/C][C]0[/C][/ROW]
[ROW][C]16[/C][C]0.581427[/C][C]6.0424[/C][C]0[/C][/ROW]
[ROW][C]17[/C][C]0.555225[/C][C]5.7701[/C][C]0[/C][/ROW]
[ROW][C]18[/C][C]0.52833[/C][C]5.4906[/C][C]0[/C][/ROW]
[ROW][C]19[/C][C]0.50175[/C][C]5.2143[/C][C]0[/C][/ROW]
[ROW][C]20[/C][C]0.47499[/C][C]4.9362[/C][C]1e-06[/C][/ROW]
[ROW][C]21[/C][C]0.450364[/C][C]4.6803[/C][C]4e-06[/C][/ROW]
[ROW][C]22[/C][C]0.426706[/C][C]4.4345[/C][C]1.1e-05[/C][/ROW]
[ROW][C]23[/C][C]0.400182[/C][C]4.1588[/C][C]3.2e-05[/C][/ROW]
[ROW][C]24[/C][C]0.375908[/C][C]3.9065[/C][C]8.2e-05[/C][/ROW]
[ROW][C]25[/C][C]0.351747[/C][C]3.6555[/C][C]0.000199[/C][/ROW]
[ROW][C]26[/C][C]0.329078[/C][C]3.4199[/C][C]0.000443[/C][/ROW]
[ROW][C]27[/C][C]0.300347[/C][C]3.1213[/C][C]0.001155[/C][/ROW]
[ROW][C]28[/C][C]0.27291[/C][C]2.8362[/C][C]0.002726[/C][/ROW]
[ROW][C]29[/C][C]0.249917[/C][C]2.5972[/C][C]0.005354[/C][/ROW]
[ROW][C]30[/C][C]0.224399[/C][C]2.332[/C][C]0.010777[/C][/ROW]
[ROW][C]31[/C][C]0.197343[/C][C]2.0509[/C][C]0.021351[/C][/ROW]
[ROW][C]32[/C][C]0.167236[/C][C]1.738[/C][C]0.042534[/C][/ROW]
[ROW][C]33[/C][C]0.141422[/C][C]1.4697[/C][C]0.072275[/C][/ROW]
[ROW][C]34[/C][C]0.115086[/C][C]1.196[/C][C]0.117157[/C][/ROW]
[ROW][C]35[/C][C]0.088047[/C][C]0.915[/C][C]0.181111[/C][/ROW]
[ROW][C]36[/C][C]0.061432[/C][C]0.6384[/C][C]0.262277[/C][/ROW]
[ROW][C]37[/C][C]0.037146[/C][C]0.386[/C][C]0.350117[/C][/ROW]
[ROW][C]38[/C][C]0.012658[/C][C]0.1315[/C][C]0.447795[/C][/ROW]
[ROW][C]39[/C][C]-0.008609[/C][C]-0.0895[/C][C]0.464438[/C][/ROW]
[ROW][C]40[/C][C]-0.028222[/C][C]-0.2933[/C][C]0.38493[/C][/ROW]
[ROW][C]41[/C][C]-0.048113[/C][C]-0.5[/C][C]0.309045[/C][/ROW]
[ROW][C]42[/C][C]-0.067992[/C][C]-0.7066[/C][C]0.240669[/C][/ROW]
[ROW][C]43[/C][C]-0.089407[/C][C]-0.9291[/C][C]0.177444[/C][/ROW]
[ROW][C]44[/C][C]-0.110355[/C][C]-1.1468[/C][C]0.126991[/C][/ROW]
[ROW][C]45[/C][C]-0.132937[/C][C]-1.3815[/C][C]0.084986[/C][/ROW]
[ROW][C]46[/C][C]-0.156007[/C][C]-1.6213[/C][C]0.053938[/C][/ROW]
[ROW][C]47[/C][C]-0.177603[/C][C]-1.8457[/C][C]0.033837[/C][/ROW]
[ROW][C]48[/C][C]-0.198618[/C][C]-2.0641[/C][C]0.020702[/C][/ROW]
[/TABLE]
Source: https://freestatistics.org/blog/index.php?pk=78095&T=1

Globally Unique Identifier (entire table): ba.freestatistics.org/blog/index.php?pk=78095&T=1

As an alternative you can also use a QR Code:  

The GUIDs for individual cells are displayed in the table below:

Autocorrelation Function
Time lag kACF(k)T-STATP-value
10.97064610.08720
20.9433739.80380
30.9191289.55190
40.8918419.26830
50.8641548.98060
60.8371148.69950
70.8094198.41170
80.7843078.15080
90.7582087.87950
100.7327467.61490
110.7092447.37070
120.6816517.08390
130.6569846.82760
140.6338496.58720
150.6087916.32670
160.5814276.04240
170.5552255.77010
180.528335.49060
190.501755.21430
200.474994.93621e-06
210.4503644.68034e-06
220.4267064.43451.1e-05
230.4001824.15883.2e-05
240.3759083.90658.2e-05
250.3517473.65550.000199
260.3290783.41990.000443
270.3003473.12130.001155
280.272912.83620.002726
290.2499172.59720.005354
300.2243992.3320.010777
310.1973432.05090.021351
320.1672361.7380.042534
330.1414221.46970.072275
340.1150861.1960.117157
350.0880470.9150.181111
360.0614320.63840.262277
370.0371460.3860.350117
380.0126580.13150.447795
39-0.008609-0.08950.464438
40-0.028222-0.29330.38493
41-0.048113-0.50.309045
42-0.067992-0.70660.240669
43-0.089407-0.92910.177444
44-0.110355-1.14680.126991
45-0.132937-1.38150.084986
46-0.156007-1.62130.053938
47-0.177603-1.84570.033837
48-0.198618-2.06410.020702


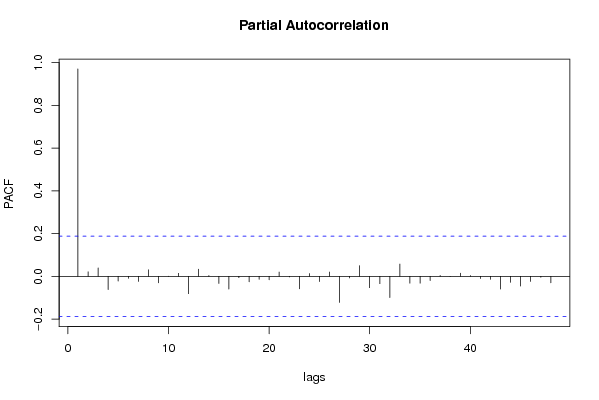
Partial Autocorrelation Function
Time lag kPACF(k)T-STATP-value
10.97064610.08720
20.0210820.21910.413495
30.0395580.41110.340908
4-0.061627-0.64040.261619
5-0.022179-0.23050.409074
6-0.009267-0.09630.46173
7-0.02381-0.24740.402518
80.0305210.31720.375857
9-0.030013-0.31190.377858
100.0005570.00580.497698
110.0144840.15050.440316
12-0.081163-0.84350.200414
130.0336460.34970.363637
140.0035050.03640.485503
15-0.033177-0.34480.365462
16-0.059593-0.61930.268507
17-0.00596-0.06190.475361
18-0.025418-0.26420.396083
19-0.013895-0.14440.442726
20-0.016104-0.16740.433701
210.02030.2110.416656
22-0.002781-0.02890.488499
23-0.058332-0.60620.272827
240.0132830.1380.445234
25-0.02453-0.25490.399634
260.0203330.21130.416522
27-0.122341-1.27140.103157
28-0.007227-0.07510.470135
290.0500390.520.302057
30-0.052945-0.55020.291651
31-0.034626-0.35980.359834
32-0.099176-1.03070.152501
330.0577930.60060.274681
34-0.031798-0.33050.370848
35-0.032017-0.33270.36999
36-0.019748-0.20520.418888
370.0045180.0470.481319
38-0.000217-0.00230.499104
390.0150990.15690.437804
400.0039080.04060.483842
41-0.010552-0.10970.456441
42-0.013749-0.14290.443322
43-0.059663-0.620.268268
44-0.02773-0.28820.386881
45-0.045639-0.47430.318123
46-0.02399-0.24930.401795
47-0.004646-0.04830.480792
48-0.030519-0.31720.375865

\begin{tabular}{lllllllll}
\hline
Partial Autocorrelation Function \tabularnewline
Time lag k & PACF(k) & T-STAT & P-value \tabularnewline
1 & 0.970646 & 10.0872 & 0 \tabularnewline
2 & 0.021082 & 0.2191 & 0.413495 \tabularnewline
3 & 0.039558 & 0.4111 & 0.340908 \tabularnewline
4 & -0.061627 & -0.6404 & 0.261619 \tabularnewline
5 & -0.022179 & -0.2305 & 0.409074 \tabularnewline
6 & -0.009267 & -0.0963 & 0.46173 \tabularnewline
7 & -0.02381 & -0.2474 & 0.402518 \tabularnewline
8 & 0.030521 & 0.3172 & 0.375857 \tabularnewline
9 & -0.030013 & -0.3119 & 0.377858 \tabularnewline
10 & 0.000557 & 0.0058 & 0.497698 \tabularnewline
11 & 0.014484 & 0.1505 & 0.440316 \tabularnewline
12 & -0.081163 & -0.8435 & 0.200414 \tabularnewline
13 & 0.033646 & 0.3497 & 0.363637 \tabularnewline
14 & 0.003505 & 0.0364 & 0.485503 \tabularnewline
15 & -0.033177 & -0.3448 & 0.365462 \tabularnewline
16 & -0.059593 & -0.6193 & 0.268507 \tabularnewline
17 & -0.00596 & -0.0619 & 0.475361 \tabularnewline
18 & -0.025418 & -0.2642 & 0.396083 \tabularnewline
19 & -0.013895 & -0.1444 & 0.442726 \tabularnewline
20 & -0.016104 & -0.1674 & 0.433701 \tabularnewline
21 & 0.0203 & 0.211 & 0.416656 \tabularnewline
22 & -0.002781 & -0.0289 & 0.488499 \tabularnewline
23 & -0.058332 & -0.6062 & 0.272827 \tabularnewline
24 & 0.013283 & 0.138 & 0.445234 \tabularnewline
25 & -0.02453 & -0.2549 & 0.399634 \tabularnewline
26 & 0.020333 & 0.2113 & 0.416522 \tabularnewline
27 & -0.122341 & -1.2714 & 0.103157 \tabularnewline
28 & -0.007227 & -0.0751 & 0.470135 \tabularnewline
29 & 0.050039 & 0.52 & 0.302057 \tabularnewline
30 & -0.052945 & -0.5502 & 0.291651 \tabularnewline
31 & -0.034626 & -0.3598 & 0.359834 \tabularnewline
32 & -0.099176 & -1.0307 & 0.152501 \tabularnewline
33 & 0.057793 & 0.6006 & 0.274681 \tabularnewline
34 & -0.031798 & -0.3305 & 0.370848 \tabularnewline
35 & -0.032017 & -0.3327 & 0.36999 \tabularnewline
36 & -0.019748 & -0.2052 & 0.418888 \tabularnewline
37 & 0.004518 & 0.047 & 0.481319 \tabularnewline
38 & -0.000217 & -0.0023 & 0.499104 \tabularnewline
39 & 0.015099 & 0.1569 & 0.437804 \tabularnewline
40 & 0.003908 & 0.0406 & 0.483842 \tabularnewline
41 & -0.010552 & -0.1097 & 0.456441 \tabularnewline
42 & -0.013749 & -0.1429 & 0.443322 \tabularnewline
43 & -0.059663 & -0.62 & 0.268268 \tabularnewline
44 & -0.02773 & -0.2882 & 0.386881 \tabularnewline
45 & -0.045639 & -0.4743 & 0.318123 \tabularnewline
46 & -0.02399 & -0.2493 & 0.401795 \tabularnewline
47 & -0.004646 & -0.0483 & 0.480792 \tabularnewline
48 & -0.030519 & -0.3172 & 0.375865 \tabularnewline
\hline
\end{tabular}
%Source: https://freestatistics.org/blog/index.php?pk=78095&T=2

[TABLE]
[ROW][C]Partial Autocorrelation Function[/C][/ROW]
[ROW][C]Time lag k[/C][C]PACF(k)[/C][C]T-STAT[/C][C]P-value[/C][/ROW]
[ROW][C]1[/C][C]0.970646[/C][C]10.0872[/C][C]0[/C][/ROW]
[ROW][C]2[/C][C]0.021082[/C][C]0.2191[/C][C]0.413495[/C][/ROW]
[ROW][C]3[/C][C]0.039558[/C][C]0.4111[/C][C]0.340908[/C][/ROW]
[ROW][C]4[/C][C]-0.061627[/C][C]-0.6404[/C][C]0.261619[/C][/ROW]
[ROW][C]5[/C][C]-0.022179[/C][C]-0.2305[/C][C]0.409074[/C][/ROW]
[ROW][C]6[/C][C]-0.009267[/C][C]-0.0963[/C][C]0.46173[/C][/ROW]
[ROW][C]7[/C][C]-0.02381[/C][C]-0.2474[/C][C]0.402518[/C][/ROW]
[ROW][C]8[/C][C]0.030521[/C][C]0.3172[/C][C]0.375857[/C][/ROW]
[ROW][C]9[/C][C]-0.030013[/C][C]-0.3119[/C][C]0.377858[/C][/ROW]
[ROW][C]10[/C][C]0.000557[/C][C]0.0058[/C][C]0.497698[/C][/ROW]
[ROW][C]11[/C][C]0.014484[/C][C]0.1505[/C][C]0.440316[/C][/ROW]
[ROW][C]12[/C][C]-0.081163[/C][C]-0.8435[/C][C]0.200414[/C][/ROW]
[ROW][C]13[/C][C]0.033646[/C][C]0.3497[/C][C]0.363637[/C][/ROW]
[ROW][C]14[/C][C]0.003505[/C][C]0.0364[/C][C]0.485503[/C][/ROW]
[ROW][C]15[/C][C]-0.033177[/C][C]-0.3448[/C][C]0.365462[/C][/ROW]
[ROW][C]16[/C][C]-0.059593[/C][C]-0.6193[/C][C]0.268507[/C][/ROW]
[ROW][C]17[/C][C]-0.00596[/C][C]-0.0619[/C][C]0.475361[/C][/ROW]
[ROW][C]18[/C][C]-0.025418[/C][C]-0.2642[/C][C]0.396083[/C][/ROW]
[ROW][C]19[/C][C]-0.013895[/C][C]-0.1444[/C][C]0.442726[/C][/ROW]
[ROW][C]20[/C][C]-0.016104[/C][C]-0.1674[/C][C]0.433701[/C][/ROW]
[ROW][C]21[/C][C]0.0203[/C][C]0.211[/C][C]0.416656[/C][/ROW]
[ROW][C]22[/C][C]-0.002781[/C][C]-0.0289[/C][C]0.488499[/C][/ROW]
[ROW][C]23[/C][C]-0.058332[/C][C]-0.6062[/C][C]0.272827[/C][/ROW]
[ROW][C]24[/C][C]0.013283[/C][C]0.138[/C][C]0.445234[/C][/ROW]
[ROW][C]25[/C][C]-0.02453[/C][C]-0.2549[/C][C]0.399634[/C][/ROW]
[ROW][C]26[/C][C]0.020333[/C][C]0.2113[/C][C]0.416522[/C][/ROW]
[ROW][C]27[/C][C]-0.122341[/C][C]-1.2714[/C][C]0.103157[/C][/ROW]
[ROW][C]28[/C][C]-0.007227[/C][C]-0.0751[/C][C]0.470135[/C][/ROW]
[ROW][C]29[/C][C]0.050039[/C][C]0.52[/C][C]0.302057[/C][/ROW]
[ROW][C]30[/C][C]-0.052945[/C][C]-0.5502[/C][C]0.291651[/C][/ROW]
[ROW][C]31[/C][C]-0.034626[/C][C]-0.3598[/C][C]0.359834[/C][/ROW]
[ROW][C]32[/C][C]-0.099176[/C][C]-1.0307[/C][C]0.152501[/C][/ROW]
[ROW][C]33[/C][C]0.057793[/C][C]0.6006[/C][C]0.274681[/C][/ROW]
[ROW][C]34[/C][C]-0.031798[/C][C]-0.3305[/C][C]0.370848[/C][/ROW]
[ROW][C]35[/C][C]-0.032017[/C][C]-0.3327[/C][C]0.36999[/C][/ROW]
[ROW][C]36[/C][C]-0.019748[/C][C]-0.2052[/C][C]0.418888[/C][/ROW]
[ROW][C]37[/C][C]0.004518[/C][C]0.047[/C][C]0.481319[/C][/ROW]
[ROW][C]38[/C][C]-0.000217[/C][C]-0.0023[/C][C]0.499104[/C][/ROW]
[ROW][C]39[/C][C]0.015099[/C][C]0.1569[/C][C]0.437804[/C][/ROW]
[ROW][C]40[/C][C]0.003908[/C][C]0.0406[/C][C]0.483842[/C][/ROW]
[ROW][C]41[/C][C]-0.010552[/C][C]-0.1097[/C][C]0.456441[/C][/ROW]
[ROW][C]42[/C][C]-0.013749[/C][C]-0.1429[/C][C]0.443322[/C][/ROW]
[ROW][C]43[/C][C]-0.059663[/C][C]-0.62[/C][C]0.268268[/C][/ROW]
[ROW][C]44[/C][C]-0.02773[/C][C]-0.2882[/C][C]0.386881[/C][/ROW]
[ROW][C]45[/C][C]-0.045639[/C][C]-0.4743[/C][C]0.318123[/C][/ROW]
[ROW][C]46[/C][C]-0.02399[/C][C]-0.2493[/C][C]0.401795[/C][/ROW]
[ROW][C]47[/C][C]-0.004646[/C][C]-0.0483[/C][C]0.480792[/C][/ROW]
[ROW][C]48[/C][C]-0.030519[/C][C]-0.3172[/C][C]0.375865[/C][/ROW]
[/TABLE]
Source: https://freestatistics.org/blog/index.php?pk=78095&T=2

Globally Unique Identifier (entire table): ba.freestatistics.org/blog/index.php?pk=78095&T=2

As an alternative you can also use a QR Code:  

The GUIDs for individual cells are displayed in the table below:

Partial Autocorrelation Function
Time lag kPACF(k)T-STATP-value
10.97064610.08720
20.0210820.21910.413495
30.0395580.41110.340908
4-0.061627-0.64040.261619
5-0.022179-0.23050.409074
6-0.009267-0.09630.46173
7-0.02381-0.24740.402518
80.0305210.31720.375857
9-0.030013-0.31190.377858
100.0005570.00580.497698
110.0144840.15050.440316
12-0.081163-0.84350.200414
130.0336460.34970.363637
140.0035050.03640.485503
15-0.033177-0.34480.365462
16-0.059593-0.61930.268507
17-0.00596-0.06190.475361
18-0.025418-0.26420.396083
19-0.013895-0.14440.442726
20-0.016104-0.16740.433701
210.02030.2110.416656
22-0.002781-0.02890.488499
23-0.058332-0.60620.272827
240.0132830.1380.445234
25-0.02453-0.25490.399634
260.0203330.21130.416522
27-0.122341-1.27140.103157
28-0.007227-0.07510.470135
290.0500390.520.302057
30-0.052945-0.55020.291651
31-0.034626-0.35980.359834
32-0.099176-1.03070.152501
330.0577930.60060.274681
34-0.031798-0.33050.370848
35-0.032017-0.33270.36999
36-0.019748-0.20520.418888
370.0045180.0470.481319
38-0.000217-0.00230.499104
390.0150990.15690.437804
400.0039080.04060.483842
41-0.010552-0.10970.456441
42-0.013749-0.14290.443322
43-0.059663-0.620.268268
44-0.02773-0.28820.386881
45-0.045639-0.47430.318123
46-0.02399-0.24930.401795
47-0.004646-0.04830.480792
48-0.030519-0.31720.375865


Parameters (Session):
par1 = 48 ; par2 = 1 ; par3 = 0 ; par4 = 1 ; par5 = 12 ; par6 = White Noise ; par7 = 0.95 ;
Parameters (R input):
par1 = 48 ; par2 = 1 ; par3 = 0 ; par4 = 1 ; par5 = 12 ; par6 = White Noise ; par7 = 0.95 ;
R code (references can be found in the software module):
if (par1 == 'Default') {
par1 = 10*log10(length(x))
} else {
par1 <- as.numeric(par1)
}
par2 <- as.numeric(par2)
par3 <- as.numeric(par3)
par4 <- as.numeric(par4)
par5 <- as.numeric(par5)
if (par6 == 'White Noise') par6 <- 'white' else par6 <- 'ma'
par7 <- as.numeric(par7)
if (par2 == 0) {
x <- log(x)
} else {
x <- (x ^ par2 - 1) / par2
}
if (par3 > 0) x <- diff(x,lag=1,difference=par3)
if (par4 > 0) x <- diff(x,lag=par5,difference=par4)
bitmap(file='pic1.png')
racf <- acf(x, par1, main='Autocorrelation', xlab='time lag', ylab='ACF', ci.type=par6, ci=par7, sub=paste('(lambda=',par2,', d=',par3,', D=',par4,', CI=', par7, ', CI type=',par6,')',sep=''))
dev.off()
bitmap(file='pic2.png')
rpacf <- pacf(x,par1,main='Partial Autocorrelation',xlab='lags',ylab='PACF')
dev.off()
(myacf <- c(racf$acf))
(mypacf <- c(rpacf$acf))
lengthx <- length(x)
sqrtn <- sqrt(lengthx)
load(file='createtable')
a<-table.start()
a<-table.row.start(a)
a<-table.element(a,'Autocorrelation Function',4,TRUE)
a<-table.row.end(a)
a<-table.row.start(a)
a<-table.element(a,'Time lag k',header=TRUE)
a<-table.element(a,hyperlink('basics.htm','ACF(k)','click here for more information about the Autocorrelation Function'),header=TRUE)
a<-table.element(a,'T-STAT',header=TRUE)
a<-table.element(a,'P-value',header=TRUE)
a<-table.row.end(a)
for (i in 2:(par1+1)) {
a<-table.row.start(a)
a<-table.element(a,i-1,header=TRUE)
a<-table.element(a,round(myacf[i],6))
mytstat <- myacf[i]*sqrtn
a<-table.element(a,round(mytstat,4))
a<-table.element(a,round(1-pt(abs(mytstat),lengthx),6))
a<-table.row.end(a)
}
a<-table.end(a)
table.save(a,file='mytable.tab')
a<-table.start()
a<-table.row.start(a)
a<-table.element(a,'Partial Autocorrelation Function',4,TRUE)
a<-table.row.end(a)
a<-table.row.start(a)
a<-table.element(a,'Time lag k',header=TRUE)
a<-table.element(a,hyperlink('basics.htm','PACF(k)','click here for more information about the Partial Autocorrelation Function'),header=TRUE)
a<-table.element(a,'T-STAT',header=TRUE)
a<-table.element(a,'P-value',header=TRUE)
a<-table.row.end(a)
for (i in 1:par1) {
a<-table.row.start(a)
a<-table.element(a,i,header=TRUE)
a<-table.element(a,round(mypacf[i],6))
mytstat <- mypacf[i]*sqrtn
a<-table.element(a,round(mytstat,4))
a<-table.element(a,round(1-pt(abs(mytstat),lengthx),6))
a<-table.row.end(a)
}
a<-table.end(a)
table.save(a,file='mytable1.tab')