Free Statistics

of Irreproducible Research!

Author's title

Author*Unverified author*
R Software Modulerwasp_autocorrelation.wasp
Title produced by software(Partial) Autocorrelation Function
Date of computationSat, 24 Jul 2010 08:56:01 +0000
Cite this page as followsStatistical Computations at FreeStatistics.org, Office for Research Development and Education, URL https://freestatistics.org/blog/index.php?v=date/2010/Jul/24/t1279961762f80y5g0b4xahq5y.htm/, Retrieved Wed, 01 May 2024 21:03:20 +0000
Statistical Computations at FreeStatistics.org, Office for Research Development and Education, URL https://freestatistics.org/blog/index.php?pk=78082, Retrieved Wed, 01 May 2024 21:03:20 +0000
QR Codes:

Original text written by user:
IsPrivate?No (this computation is public)
User-defined keywordsFebiri Lordina
Estimated Impact193
Family? (F = Feedback message, R = changed R code, M = changed R Module, P = changed Parameters, D = changed Data)
-       [(Partial) Autocorrelation Function] [Autocorrelation O...] [2010-07-24 08:56:01] [ee335b92128d1ec04d3c346475765c6a] [Current]
Feedback Forum

Post a new message
Dataseries X:
297
296
295
293
291
290
291
293
294
294
295
297
302
297
301
298
295
287
290
288
288
287
274
282
296
292
298
296
292
296
293
295
294
291
279
284
299
296
299
299
291
298
288
284
277
270
251
257
269
271
268
268
258
261
255
251
239
229
210
218
226
227
222
215
203
205
194
190
182
179
158
163
165
169
163
154
142
146
133
131
128
120
88
95


Summary of computational transaction
Raw Inputview raw input (R code)
Raw Outputview raw output of R engine
Computing time1 seconds
R Server'Gwilym Jenkins' @ 72.249.127.135

\begin{tabular}{lllllllll}
\hline
Summary of computational transaction \tabularnewline
Raw Input & view raw input (R code)  \tabularnewline
Raw Output & view raw output of R engine  \tabularnewline
Computing time & 1 seconds \tabularnewline
R Server & 'Gwilym Jenkins' @ 72.249.127.135 \tabularnewline
\hline
\end{tabular}
%Source: https://freestatistics.org/blog/index.php?pk=78082&T=0

[TABLE]
[ROW][C]Summary of computational transaction[/C][/ROW]
[ROW][C]Raw Input[/C][C]view raw input (R code) [/C][/ROW]
[ROW][C]Raw Output[/C][C]view raw output of R engine [/C][/ROW]
[ROW][C]Computing time[/C][C]1 seconds[/C][/ROW]
[ROW][C]R Server[/C][C]'Gwilym Jenkins' @ 72.249.127.135[/C][/ROW]
[/TABLE]
Source: https://freestatistics.org/blog/index.php?pk=78082&T=0

Globally Unique Identifier (entire table): ba.freestatistics.org/blog/index.php?pk=78082&T=0

As an alternative you can also use a QR Code:  

The GUIDs for individual cells are displayed in the table below:

Summary of computational transaction
Raw Inputview raw input (R code)
Raw Outputview raw output of R engine
Computing time1 seconds
R Server'Gwilym Jenkins' @ 72.249.127.135


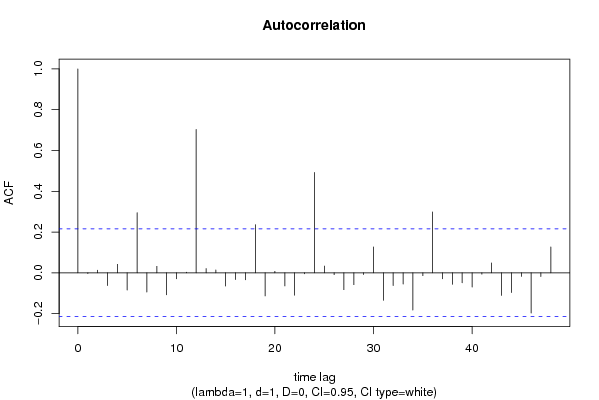
Autocorrelation Function
Time lag kACF(k)T-STATP-value
1-0.003474-0.03160.487415
20.0128180.11680.453658
3-0.062487-0.56930.28535
40.0413240.37650.353759
5-0.084856-0.77310.220837
60.2947822.68560.004371
7-0.094633-0.86210.195545
80.0319980.29150.385691
9-0.108043-0.98430.163909
10-0.029767-0.27120.393459
110.0027550.02510.490019
120.7031546.4060
130.0206130.18780.42575
140.0142190.12950.448622
15-0.065289-0.59480.276795
16-0.033097-0.30150.381885
17-0.034255-0.31210.377881
180.2362032.15190.017155
19-0.113774-1.03650.151482
200.0074730.06810.472941
21-0.064157-0.58450.280234
22-0.109982-1.0020.159632
23-0.005172-0.04710.481266
240.492064.48291.2e-05
250.0329030.29980.382554
26-0.009105-0.0830.467045
27-0.082613-0.75260.226897
28-0.058291-0.53110.2984
29-0.008421-0.07670.469516
300.1271541.15840.125005
31-0.1347-1.22720.111613
32-0.062382-0.56830.285675
33-0.055009-0.50120.308793
34-0.182972-1.6670.049646
35-0.014351-0.13070.448147
360.2984272.71880.003988
37-0.029724-0.27080.393608
38-0.056269-0.51260.304783
39-0.049356-0.44970.327066
40-0.069909-0.63690.26297
41-0.006725-0.06130.475647
420.0481460.43860.331036
43-0.110988-1.01110.157443
44-0.097089-0.88450.189486
45-0.018029-0.16420.434968
46-0.197784-1.80190.037596
47-0.018679-0.17020.432645
480.1271081.1580.125091

\begin{tabular}{lllllllll}
\hline
Autocorrelation Function \tabularnewline
Time lag k & ACF(k) & T-STAT & P-value \tabularnewline
1 & -0.003474 & -0.0316 & 0.487415 \tabularnewline
2 & 0.012818 & 0.1168 & 0.453658 \tabularnewline
3 & -0.062487 & -0.5693 & 0.28535 \tabularnewline
4 & 0.041324 & 0.3765 & 0.353759 \tabularnewline
5 & -0.084856 & -0.7731 & 0.220837 \tabularnewline
6 & 0.294782 & 2.6856 & 0.004371 \tabularnewline
7 & -0.094633 & -0.8621 & 0.195545 \tabularnewline
8 & 0.031998 & 0.2915 & 0.385691 \tabularnewline
9 & -0.108043 & -0.9843 & 0.163909 \tabularnewline
10 & -0.029767 & -0.2712 & 0.393459 \tabularnewline
11 & 0.002755 & 0.0251 & 0.490019 \tabularnewline
12 & 0.703154 & 6.406 & 0 \tabularnewline
13 & 0.020613 & 0.1878 & 0.42575 \tabularnewline
14 & 0.014219 & 0.1295 & 0.448622 \tabularnewline
15 & -0.065289 & -0.5948 & 0.276795 \tabularnewline
16 & -0.033097 & -0.3015 & 0.381885 \tabularnewline
17 & -0.034255 & -0.3121 & 0.377881 \tabularnewline
18 & 0.236203 & 2.1519 & 0.017155 \tabularnewline
19 & -0.113774 & -1.0365 & 0.151482 \tabularnewline
20 & 0.007473 & 0.0681 & 0.472941 \tabularnewline
21 & -0.064157 & -0.5845 & 0.280234 \tabularnewline
22 & -0.109982 & -1.002 & 0.159632 \tabularnewline
23 & -0.005172 & -0.0471 & 0.481266 \tabularnewline
24 & 0.49206 & 4.4829 & 1.2e-05 \tabularnewline
25 & 0.032903 & 0.2998 & 0.382554 \tabularnewline
26 & -0.009105 & -0.083 & 0.467045 \tabularnewline
27 & -0.082613 & -0.7526 & 0.226897 \tabularnewline
28 & -0.058291 & -0.5311 & 0.2984 \tabularnewline
29 & -0.008421 & -0.0767 & 0.469516 \tabularnewline
30 & 0.127154 & 1.1584 & 0.125005 \tabularnewline
31 & -0.1347 & -1.2272 & 0.111613 \tabularnewline
32 & -0.062382 & -0.5683 & 0.285675 \tabularnewline
33 & -0.055009 & -0.5012 & 0.308793 \tabularnewline
34 & -0.182972 & -1.667 & 0.049646 \tabularnewline
35 & -0.014351 & -0.1307 & 0.448147 \tabularnewline
36 & 0.298427 & 2.7188 & 0.003988 \tabularnewline
37 & -0.029724 & -0.2708 & 0.393608 \tabularnewline
38 & -0.056269 & -0.5126 & 0.304783 \tabularnewline
39 & -0.049356 & -0.4497 & 0.327066 \tabularnewline
40 & -0.069909 & -0.6369 & 0.26297 \tabularnewline
41 & -0.006725 & -0.0613 & 0.475647 \tabularnewline
42 & 0.048146 & 0.4386 & 0.331036 \tabularnewline
43 & -0.110988 & -1.0111 & 0.157443 \tabularnewline
44 & -0.097089 & -0.8845 & 0.189486 \tabularnewline
45 & -0.018029 & -0.1642 & 0.434968 \tabularnewline
46 & -0.197784 & -1.8019 & 0.037596 \tabularnewline
47 & -0.018679 & -0.1702 & 0.432645 \tabularnewline
48 & 0.127108 & 1.158 & 0.125091 \tabularnewline
\hline
\end{tabular}
%Source: https://freestatistics.org/blog/index.php?pk=78082&T=1

[TABLE]
[ROW][C]Autocorrelation Function[/C][/ROW]
[ROW][C]Time lag k[/C][C]ACF(k)[/C][C]T-STAT[/C][C]P-value[/C][/ROW]
[ROW][C]1[/C][C]-0.003474[/C][C]-0.0316[/C][C]0.487415[/C][/ROW]
[ROW][C]2[/C][C]0.012818[/C][C]0.1168[/C][C]0.453658[/C][/ROW]
[ROW][C]3[/C][C]-0.062487[/C][C]-0.5693[/C][C]0.28535[/C][/ROW]
[ROW][C]4[/C][C]0.041324[/C][C]0.3765[/C][C]0.353759[/C][/ROW]
[ROW][C]5[/C][C]-0.084856[/C][C]-0.7731[/C][C]0.220837[/C][/ROW]
[ROW][C]6[/C][C]0.294782[/C][C]2.6856[/C][C]0.004371[/C][/ROW]
[ROW][C]7[/C][C]-0.094633[/C][C]-0.8621[/C][C]0.195545[/C][/ROW]
[ROW][C]8[/C][C]0.031998[/C][C]0.2915[/C][C]0.385691[/C][/ROW]
[ROW][C]9[/C][C]-0.108043[/C][C]-0.9843[/C][C]0.163909[/C][/ROW]
[ROW][C]10[/C][C]-0.029767[/C][C]-0.2712[/C][C]0.393459[/C][/ROW]
[ROW][C]11[/C][C]0.002755[/C][C]0.0251[/C][C]0.490019[/C][/ROW]
[ROW][C]12[/C][C]0.703154[/C][C]6.406[/C][C]0[/C][/ROW]
[ROW][C]13[/C][C]0.020613[/C][C]0.1878[/C][C]0.42575[/C][/ROW]
[ROW][C]14[/C][C]0.014219[/C][C]0.1295[/C][C]0.448622[/C][/ROW]
[ROW][C]15[/C][C]-0.065289[/C][C]-0.5948[/C][C]0.276795[/C][/ROW]
[ROW][C]16[/C][C]-0.033097[/C][C]-0.3015[/C][C]0.381885[/C][/ROW]
[ROW][C]17[/C][C]-0.034255[/C][C]-0.3121[/C][C]0.377881[/C][/ROW]
[ROW][C]18[/C][C]0.236203[/C][C]2.1519[/C][C]0.017155[/C][/ROW]
[ROW][C]19[/C][C]-0.113774[/C][C]-1.0365[/C][C]0.151482[/C][/ROW]
[ROW][C]20[/C][C]0.007473[/C][C]0.0681[/C][C]0.472941[/C][/ROW]
[ROW][C]21[/C][C]-0.064157[/C][C]-0.5845[/C][C]0.280234[/C][/ROW]
[ROW][C]22[/C][C]-0.109982[/C][C]-1.002[/C][C]0.159632[/C][/ROW]
[ROW][C]23[/C][C]-0.005172[/C][C]-0.0471[/C][C]0.481266[/C][/ROW]
[ROW][C]24[/C][C]0.49206[/C][C]4.4829[/C][C]1.2e-05[/C][/ROW]
[ROW][C]25[/C][C]0.032903[/C][C]0.2998[/C][C]0.382554[/C][/ROW]
[ROW][C]26[/C][C]-0.009105[/C][C]-0.083[/C][C]0.467045[/C][/ROW]
[ROW][C]27[/C][C]-0.082613[/C][C]-0.7526[/C][C]0.226897[/C][/ROW]
[ROW][C]28[/C][C]-0.058291[/C][C]-0.5311[/C][C]0.2984[/C][/ROW]
[ROW][C]29[/C][C]-0.008421[/C][C]-0.0767[/C][C]0.469516[/C][/ROW]
[ROW][C]30[/C][C]0.127154[/C][C]1.1584[/C][C]0.125005[/C][/ROW]
[ROW][C]31[/C][C]-0.1347[/C][C]-1.2272[/C][C]0.111613[/C][/ROW]
[ROW][C]32[/C][C]-0.062382[/C][C]-0.5683[/C][C]0.285675[/C][/ROW]
[ROW][C]33[/C][C]-0.055009[/C][C]-0.5012[/C][C]0.308793[/C][/ROW]
[ROW][C]34[/C][C]-0.182972[/C][C]-1.667[/C][C]0.049646[/C][/ROW]
[ROW][C]35[/C][C]-0.014351[/C][C]-0.1307[/C][C]0.448147[/C][/ROW]
[ROW][C]36[/C][C]0.298427[/C][C]2.7188[/C][C]0.003988[/C][/ROW]
[ROW][C]37[/C][C]-0.029724[/C][C]-0.2708[/C][C]0.393608[/C][/ROW]
[ROW][C]38[/C][C]-0.056269[/C][C]-0.5126[/C][C]0.304783[/C][/ROW]
[ROW][C]39[/C][C]-0.049356[/C][C]-0.4497[/C][C]0.327066[/C][/ROW]
[ROW][C]40[/C][C]-0.069909[/C][C]-0.6369[/C][C]0.26297[/C][/ROW]
[ROW][C]41[/C][C]-0.006725[/C][C]-0.0613[/C][C]0.475647[/C][/ROW]
[ROW][C]42[/C][C]0.048146[/C][C]0.4386[/C][C]0.331036[/C][/ROW]
[ROW][C]43[/C][C]-0.110988[/C][C]-1.0111[/C][C]0.157443[/C][/ROW]
[ROW][C]44[/C][C]-0.097089[/C][C]-0.8845[/C][C]0.189486[/C][/ROW]
[ROW][C]45[/C][C]-0.018029[/C][C]-0.1642[/C][C]0.434968[/C][/ROW]
[ROW][C]46[/C][C]-0.197784[/C][C]-1.8019[/C][C]0.037596[/C][/ROW]
[ROW][C]47[/C][C]-0.018679[/C][C]-0.1702[/C][C]0.432645[/C][/ROW]
[ROW][C]48[/C][C]0.127108[/C][C]1.158[/C][C]0.125091[/C][/ROW]
[/TABLE]
Source: https://freestatistics.org/blog/index.php?pk=78082&T=1

Globally Unique Identifier (entire table): ba.freestatistics.org/blog/index.php?pk=78082&T=1

As an alternative you can also use a QR Code:  

The GUIDs for individual cells are displayed in the table below:

Autocorrelation Function
Time lag kACF(k)T-STATP-value
1-0.003474-0.03160.487415
20.0128180.11680.453658
3-0.062487-0.56930.28535
40.0413240.37650.353759
5-0.084856-0.77310.220837
60.2947822.68560.004371
7-0.094633-0.86210.195545
80.0319980.29150.385691
9-0.108043-0.98430.163909
10-0.029767-0.27120.393459
110.0027550.02510.490019
120.7031546.4060
130.0206130.18780.42575
140.0142190.12950.448622
15-0.065289-0.59480.276795
16-0.033097-0.30150.381885
17-0.034255-0.31210.377881
180.2362032.15190.017155
19-0.113774-1.03650.151482
200.0074730.06810.472941
21-0.064157-0.58450.280234
22-0.109982-1.0020.159632
23-0.005172-0.04710.481266
240.492064.48291.2e-05
250.0329030.29980.382554
26-0.009105-0.0830.467045
27-0.082613-0.75260.226897
28-0.058291-0.53110.2984
29-0.008421-0.07670.469516
300.1271541.15840.125005
31-0.1347-1.22720.111613
32-0.062382-0.56830.285675
33-0.055009-0.50120.308793
34-0.182972-1.6670.049646
35-0.014351-0.13070.448147
360.2984272.71880.003988
37-0.029724-0.27080.393608
38-0.056269-0.51260.304783
39-0.049356-0.44970.327066
40-0.069909-0.63690.26297
41-0.006725-0.06130.475647
420.0481460.43860.331036
43-0.110988-1.01110.157443
44-0.097089-0.88450.189486
45-0.018029-0.16420.434968
46-0.197784-1.80190.037596
47-0.018679-0.17020.432645
480.1271081.1580.125091


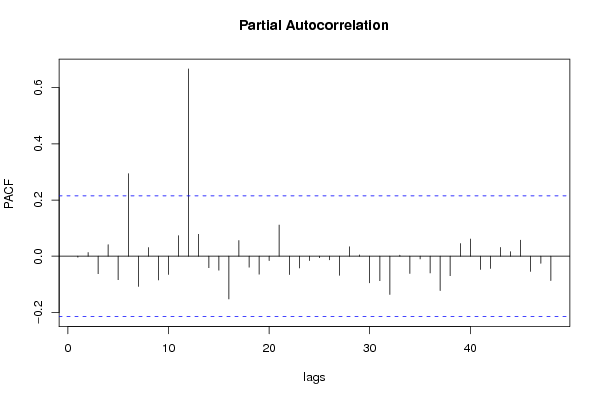
Partial Autocorrelation Function
Time lag kPACF(k)T-STATP-value
1-0.003474-0.03160.487415
20.0128060.11670.453701
3-0.06241-0.56860.285589
40.0409480.37310.355028
5-0.083637-0.7620.224118
60.2938682.67730.004472
7-0.107509-0.97950.1651
80.0309560.2820.389314
9-0.084367-0.76860.22215
10-0.064661-0.58910.2787
110.0729880.6650.253962
120.66666.0730
130.0779920.71050.239681
14-0.0407-0.37080.355866
15-0.049853-0.45420.325442
16-0.152132-1.3860.084732
170.0558080.50840.306248
18-0.039118-0.35640.36123
19-0.064136-0.58430.280299
20-0.015338-0.13970.444605
210.1110421.01160.157326
22-0.065375-0.59560.276535
23-0.041928-0.3820.351727
24-0.015311-0.13950.444701
25-0.005404-0.04920.480425
26-0.012694-0.11570.454104
27-0.067821-0.61790.269174
280.0333880.30420.380876
290.0046110.0420.483295
30-0.094586-0.86170.195661
31-0.08696-0.79220.215239
32-0.13603-1.23930.109365
330.0037810.03440.486301
34-0.061373-0.55910.288789
35-0.009871-0.08990.464281
36-0.059719-0.54410.293926
37-0.122146-1.11280.134502
38-0.069185-0.63030.265112
390.0451460.41130.340957
400.0609030.55490.290243
41-0.04702-0.42840.334743
42-0.043556-0.39680.346261
430.0312350.28460.388344
440.0162270.14780.441416
450.057030.51960.302373
46-0.054413-0.49570.310699
47-0.025153-0.22920.409655
48-0.086699-0.78990.215929

\begin{tabular}{lllllllll}
\hline
Partial Autocorrelation Function \tabularnewline
Time lag k & PACF(k) & T-STAT & P-value \tabularnewline
1 & -0.003474 & -0.0316 & 0.487415 \tabularnewline
2 & 0.012806 & 0.1167 & 0.453701 \tabularnewline
3 & -0.06241 & -0.5686 & 0.285589 \tabularnewline
4 & 0.040948 & 0.3731 & 0.355028 \tabularnewline
5 & -0.083637 & -0.762 & 0.224118 \tabularnewline
6 & 0.293868 & 2.6773 & 0.004472 \tabularnewline
7 & -0.107509 & -0.9795 & 0.1651 \tabularnewline
8 & 0.030956 & 0.282 & 0.389314 \tabularnewline
9 & -0.084367 & -0.7686 & 0.22215 \tabularnewline
10 & -0.064661 & -0.5891 & 0.2787 \tabularnewline
11 & 0.072988 & 0.665 & 0.253962 \tabularnewline
12 & 0.6666 & 6.073 & 0 \tabularnewline
13 & 0.077992 & 0.7105 & 0.239681 \tabularnewline
14 & -0.0407 & -0.3708 & 0.355866 \tabularnewline
15 & -0.049853 & -0.4542 & 0.325442 \tabularnewline
16 & -0.152132 & -1.386 & 0.084732 \tabularnewline
17 & 0.055808 & 0.5084 & 0.306248 \tabularnewline
18 & -0.039118 & -0.3564 & 0.36123 \tabularnewline
19 & -0.064136 & -0.5843 & 0.280299 \tabularnewline
20 & -0.015338 & -0.1397 & 0.444605 \tabularnewline
21 & 0.111042 & 1.0116 & 0.157326 \tabularnewline
22 & -0.065375 & -0.5956 & 0.276535 \tabularnewline
23 & -0.041928 & -0.382 & 0.351727 \tabularnewline
24 & -0.015311 & -0.1395 & 0.444701 \tabularnewline
25 & -0.005404 & -0.0492 & 0.480425 \tabularnewline
26 & -0.012694 & -0.1157 & 0.454104 \tabularnewline
27 & -0.067821 & -0.6179 & 0.269174 \tabularnewline
28 & 0.033388 & 0.3042 & 0.380876 \tabularnewline
29 & 0.004611 & 0.042 & 0.483295 \tabularnewline
30 & -0.094586 & -0.8617 & 0.195661 \tabularnewline
31 & -0.08696 & -0.7922 & 0.215239 \tabularnewline
32 & -0.13603 & -1.2393 & 0.109365 \tabularnewline
33 & 0.003781 & 0.0344 & 0.486301 \tabularnewline
34 & -0.061373 & -0.5591 & 0.288789 \tabularnewline
35 & -0.009871 & -0.0899 & 0.464281 \tabularnewline
36 & -0.059719 & -0.5441 & 0.293926 \tabularnewline
37 & -0.122146 & -1.1128 & 0.134502 \tabularnewline
38 & -0.069185 & -0.6303 & 0.265112 \tabularnewline
39 & 0.045146 & 0.4113 & 0.340957 \tabularnewline
40 & 0.060903 & 0.5549 & 0.290243 \tabularnewline
41 & -0.04702 & -0.4284 & 0.334743 \tabularnewline
42 & -0.043556 & -0.3968 & 0.346261 \tabularnewline
43 & 0.031235 & 0.2846 & 0.388344 \tabularnewline
44 & 0.016227 & 0.1478 & 0.441416 \tabularnewline
45 & 0.05703 & 0.5196 & 0.302373 \tabularnewline
46 & -0.054413 & -0.4957 & 0.310699 \tabularnewline
47 & -0.025153 & -0.2292 & 0.409655 \tabularnewline
48 & -0.086699 & -0.7899 & 0.215929 \tabularnewline
\hline
\end{tabular}
%Source: https://freestatistics.org/blog/index.php?pk=78082&T=2

[TABLE]
[ROW][C]Partial Autocorrelation Function[/C][/ROW]
[ROW][C]Time lag k[/C][C]PACF(k)[/C][C]T-STAT[/C][C]P-value[/C][/ROW]
[ROW][C]1[/C][C]-0.003474[/C][C]-0.0316[/C][C]0.487415[/C][/ROW]
[ROW][C]2[/C][C]0.012806[/C][C]0.1167[/C][C]0.453701[/C][/ROW]
[ROW][C]3[/C][C]-0.06241[/C][C]-0.5686[/C][C]0.285589[/C][/ROW]
[ROW][C]4[/C][C]0.040948[/C][C]0.3731[/C][C]0.355028[/C][/ROW]
[ROW][C]5[/C][C]-0.083637[/C][C]-0.762[/C][C]0.224118[/C][/ROW]
[ROW][C]6[/C][C]0.293868[/C][C]2.6773[/C][C]0.004472[/C][/ROW]
[ROW][C]7[/C][C]-0.107509[/C][C]-0.9795[/C][C]0.1651[/C][/ROW]
[ROW][C]8[/C][C]0.030956[/C][C]0.282[/C][C]0.389314[/C][/ROW]
[ROW][C]9[/C][C]-0.084367[/C][C]-0.7686[/C][C]0.22215[/C][/ROW]
[ROW][C]10[/C][C]-0.064661[/C][C]-0.5891[/C][C]0.2787[/C][/ROW]
[ROW][C]11[/C][C]0.072988[/C][C]0.665[/C][C]0.253962[/C][/ROW]
[ROW][C]12[/C][C]0.6666[/C][C]6.073[/C][C]0[/C][/ROW]
[ROW][C]13[/C][C]0.077992[/C][C]0.7105[/C][C]0.239681[/C][/ROW]
[ROW][C]14[/C][C]-0.0407[/C][C]-0.3708[/C][C]0.355866[/C][/ROW]
[ROW][C]15[/C][C]-0.049853[/C][C]-0.4542[/C][C]0.325442[/C][/ROW]
[ROW][C]16[/C][C]-0.152132[/C][C]-1.386[/C][C]0.084732[/C][/ROW]
[ROW][C]17[/C][C]0.055808[/C][C]0.5084[/C][C]0.306248[/C][/ROW]
[ROW][C]18[/C][C]-0.039118[/C][C]-0.3564[/C][C]0.36123[/C][/ROW]
[ROW][C]19[/C][C]-0.064136[/C][C]-0.5843[/C][C]0.280299[/C][/ROW]
[ROW][C]20[/C][C]-0.015338[/C][C]-0.1397[/C][C]0.444605[/C][/ROW]
[ROW][C]21[/C][C]0.111042[/C][C]1.0116[/C][C]0.157326[/C][/ROW]
[ROW][C]22[/C][C]-0.065375[/C][C]-0.5956[/C][C]0.276535[/C][/ROW]
[ROW][C]23[/C][C]-0.041928[/C][C]-0.382[/C][C]0.351727[/C][/ROW]
[ROW][C]24[/C][C]-0.015311[/C][C]-0.1395[/C][C]0.444701[/C][/ROW]
[ROW][C]25[/C][C]-0.005404[/C][C]-0.0492[/C][C]0.480425[/C][/ROW]
[ROW][C]26[/C][C]-0.012694[/C][C]-0.1157[/C][C]0.454104[/C][/ROW]
[ROW][C]27[/C][C]-0.067821[/C][C]-0.6179[/C][C]0.269174[/C][/ROW]
[ROW][C]28[/C][C]0.033388[/C][C]0.3042[/C][C]0.380876[/C][/ROW]
[ROW][C]29[/C][C]0.004611[/C][C]0.042[/C][C]0.483295[/C][/ROW]
[ROW][C]30[/C][C]-0.094586[/C][C]-0.8617[/C][C]0.195661[/C][/ROW]
[ROW][C]31[/C][C]-0.08696[/C][C]-0.7922[/C][C]0.215239[/C][/ROW]
[ROW][C]32[/C][C]-0.13603[/C][C]-1.2393[/C][C]0.109365[/C][/ROW]
[ROW][C]33[/C][C]0.003781[/C][C]0.0344[/C][C]0.486301[/C][/ROW]
[ROW][C]34[/C][C]-0.061373[/C][C]-0.5591[/C][C]0.288789[/C][/ROW]
[ROW][C]35[/C][C]-0.009871[/C][C]-0.0899[/C][C]0.464281[/C][/ROW]
[ROW][C]36[/C][C]-0.059719[/C][C]-0.5441[/C][C]0.293926[/C][/ROW]
[ROW][C]37[/C][C]-0.122146[/C][C]-1.1128[/C][C]0.134502[/C][/ROW]
[ROW][C]38[/C][C]-0.069185[/C][C]-0.6303[/C][C]0.265112[/C][/ROW]
[ROW][C]39[/C][C]0.045146[/C][C]0.4113[/C][C]0.340957[/C][/ROW]
[ROW][C]40[/C][C]0.060903[/C][C]0.5549[/C][C]0.290243[/C][/ROW]
[ROW][C]41[/C][C]-0.04702[/C][C]-0.4284[/C][C]0.334743[/C][/ROW]
[ROW][C]42[/C][C]-0.043556[/C][C]-0.3968[/C][C]0.346261[/C][/ROW]
[ROW][C]43[/C][C]0.031235[/C][C]0.2846[/C][C]0.388344[/C][/ROW]
[ROW][C]44[/C][C]0.016227[/C][C]0.1478[/C][C]0.441416[/C][/ROW]
[ROW][C]45[/C][C]0.05703[/C][C]0.5196[/C][C]0.302373[/C][/ROW]
[ROW][C]46[/C][C]-0.054413[/C][C]-0.4957[/C][C]0.310699[/C][/ROW]
[ROW][C]47[/C][C]-0.025153[/C][C]-0.2292[/C][C]0.409655[/C][/ROW]
[ROW][C]48[/C][C]-0.086699[/C][C]-0.7899[/C][C]0.215929[/C][/ROW]
[/TABLE]
Source: https://freestatistics.org/blog/index.php?pk=78082&T=2

Globally Unique Identifier (entire table): ba.freestatistics.org/blog/index.php?pk=78082&T=2

As an alternative you can also use a QR Code:  

The GUIDs for individual cells are displayed in the table below:

Partial Autocorrelation Function
Time lag kPACF(k)T-STATP-value
1-0.003474-0.03160.487415
20.0128060.11670.453701
3-0.06241-0.56860.285589
40.0409480.37310.355028
5-0.083637-0.7620.224118
60.2938682.67730.004472
7-0.107509-0.97950.1651
80.0309560.2820.389314
9-0.084367-0.76860.22215
10-0.064661-0.58910.2787
110.0729880.6650.253962
120.66666.0730
130.0779920.71050.239681
14-0.0407-0.37080.355866
15-0.049853-0.45420.325442
16-0.152132-1.3860.084732
170.0558080.50840.306248
18-0.039118-0.35640.36123
19-0.064136-0.58430.280299
20-0.015338-0.13970.444605
210.1110421.01160.157326
22-0.065375-0.59560.276535
23-0.041928-0.3820.351727
24-0.015311-0.13950.444701
25-0.005404-0.04920.480425
26-0.012694-0.11570.454104
27-0.067821-0.61790.269174
280.0333880.30420.380876
290.0046110.0420.483295
30-0.094586-0.86170.195661
31-0.08696-0.79220.215239
32-0.13603-1.23930.109365
330.0037810.03440.486301
34-0.061373-0.55910.288789
35-0.009871-0.08990.464281
36-0.059719-0.54410.293926
37-0.122146-1.11280.134502
38-0.069185-0.63030.265112
390.0451460.41130.340957
400.0609030.55490.290243
41-0.04702-0.42840.334743
42-0.043556-0.39680.346261
430.0312350.28460.388344
440.0162270.14780.441416
450.057030.51960.302373
46-0.054413-0.49570.310699
47-0.025153-0.22920.409655
48-0.086699-0.78990.215929


Parameters (Session):
par1 = 48 ; par2 = 1 ; par3 = 1 ; par4 = 0 ; par5 = 12 ; par6 = White Noise ; par7 = 0.95 ;
Parameters (R input):
par1 = 48 ; par2 = 1 ; par3 = 1 ; par4 = 0 ; par5 = 12 ; par6 = White Noise ; par7 = 0.95 ;
R code (references can be found in the software module):
if (par1 == 'Default') {
par1 = 10*log10(length(x))
} else {
par1 <- as.numeric(par1)
}
par2 <- as.numeric(par2)
par3 <- as.numeric(par3)
par4 <- as.numeric(par4)
par5 <- as.numeric(par5)
if (par6 == 'White Noise') par6 <- 'white' else par6 <- 'ma'
par7 <- as.numeric(par7)
if (par2 == 0) {
x <- log(x)
} else {
x <- (x ^ par2 - 1) / par2
}
if (par3 > 0) x <- diff(x,lag=1,difference=par3)
if (par4 > 0) x <- diff(x,lag=par5,difference=par4)
bitmap(file='pic1.png')
racf <- acf(x, par1, main='Autocorrelation', xlab='time lag', ylab='ACF', ci.type=par6, ci=par7, sub=paste('(lambda=',par2,', d=',par3,', D=',par4,', CI=', par7, ', CI type=',par6,')',sep=''))
dev.off()
bitmap(file='pic2.png')
rpacf <- pacf(x,par1,main='Partial Autocorrelation',xlab='lags',ylab='PACF')
dev.off()
(myacf <- c(racf$acf))
(mypacf <- c(rpacf$acf))
lengthx <- length(x)
sqrtn <- sqrt(lengthx)
load(file='createtable')
a<-table.start()
a<-table.row.start(a)
a<-table.element(a,'Autocorrelation Function',4,TRUE)
a<-table.row.end(a)
a<-table.row.start(a)
a<-table.element(a,'Time lag k',header=TRUE)
a<-table.element(a,hyperlink('basics.htm','ACF(k)','click here for more information about the Autocorrelation Function'),header=TRUE)
a<-table.element(a,'T-STAT',header=TRUE)
a<-table.element(a,'P-value',header=TRUE)
a<-table.row.end(a)
for (i in 2:(par1+1)) {
a<-table.row.start(a)
a<-table.element(a,i-1,header=TRUE)
a<-table.element(a,round(myacf[i],6))
mytstat <- myacf[i]*sqrtn
a<-table.element(a,round(mytstat,4))
a<-table.element(a,round(1-pt(abs(mytstat),lengthx),6))
a<-table.row.end(a)
}
a<-table.end(a)
table.save(a,file='mytable.tab')
a<-table.start()
a<-table.row.start(a)
a<-table.element(a,'Partial Autocorrelation Function',4,TRUE)
a<-table.row.end(a)
a<-table.row.start(a)
a<-table.element(a,'Time lag k',header=TRUE)
a<-table.element(a,hyperlink('basics.htm','PACF(k)','click here for more information about the Partial Autocorrelation Function'),header=TRUE)
a<-table.element(a,'T-STAT',header=TRUE)
a<-table.element(a,'P-value',header=TRUE)
a<-table.row.end(a)
for (i in 1:par1) {
a<-table.row.start(a)
a<-table.element(a,i,header=TRUE)
a<-table.element(a,round(mypacf[i],6))
mytstat <- mypacf[i]*sqrtn
a<-table.element(a,round(mytstat,4))
a<-table.element(a,round(1-pt(abs(mytstat),lengthx),6))
a<-table.row.end(a)
}
a<-table.end(a)
table.save(a,file='mytable1.tab')