Free Statistics

of Irreproducible Research!

Author's title

Author*Unverified author*
R Software Modulerwasp_autocorrelation.wasp
Title produced by software(Partial) Autocorrelation Function
Date of computationSat, 24 Jul 2010 08:51:50 +0000
Cite this page as followsStatistical Computations at FreeStatistics.org, Office for Research Development and Education, URL https://freestatistics.org/blog/index.php?v=date/2010/Jul/24/t1279961516ivbbtxlg79fz6v0.htm/, Retrieved Wed, 01 May 2024 19:59:27 +0000
Statistical Computations at FreeStatistics.org, Office for Research Development and Education, URL https://freestatistics.org/blog/index.php?pk=78081, Retrieved Wed, 01 May 2024 19:59:27 +0000
QR Codes:

Original text written by user:
IsPrivate?No (this computation is public)
User-defined keywordsFebiri Lordina
Estimated Impact191
Family? (F = Feedback message, R = changed R code, M = changed R Module, P = changed Parameters, D = changed Data)
-       [(Partial) Autocorrelation Function] [Autocorrelation O...] [2010-07-24 08:51:50] [ee335b92128d1ec04d3c346475765c6a] [Current]
Feedback Forum

Post a new message
Dataseries X:
297
296
295
293
291
290
291
293
294
294
295
297
302
297
301
298
295
287
290
288
288
287
274
282
296
292
298
296
292
296
293
295
294
291
279
284
299
296
299
299
291
298
288
284
277
270
251
257
269
271
268
268
258
261
255
251
239
229
210
218
226
227
222
215
203
205
194
190
182
179
158
163
165
169
163
154
142
146
133
131
128
120
88
95


Summary of computational transaction
Raw Inputview raw input (R code)
Raw Outputview raw output of R engine
Computing time2 seconds
R Server'RServer@AstonUniversity' @ vre.aston.ac.uk

\begin{tabular}{lllllllll}
\hline
Summary of computational transaction \tabularnewline
Raw Input & view raw input (R code)  \tabularnewline
Raw Output & view raw output of R engine  \tabularnewline
Computing time & 2 seconds \tabularnewline
R Server & 'RServer@AstonUniversity' @ vre.aston.ac.uk \tabularnewline
\hline
\end{tabular}
%Source: https://freestatistics.org/blog/index.php?pk=78081&T=0

[TABLE]
[ROW][C]Summary of computational transaction[/C][/ROW]
[ROW][C]Raw Input[/C][C]view raw input (R code) [/C][/ROW]
[ROW][C]Raw Output[/C][C]view raw output of R engine [/C][/ROW]
[ROW][C]Computing time[/C][C]2 seconds[/C][/ROW]
[ROW][C]R Server[/C][C]'RServer@AstonUniversity' @ vre.aston.ac.uk[/C][/ROW]
[/TABLE]
Source: https://freestatistics.org/blog/index.php?pk=78081&T=0

Globally Unique Identifier (entire table): ba.freestatistics.org/blog/index.php?pk=78081&T=0

As an alternative you can also use a QR Code:  

The GUIDs for individual cells are displayed in the table below:

Summary of computational transaction
Raw Inputview raw input (R code)
Raw Outputview raw output of R engine
Computing time2 seconds
R Server'RServer@AstonUniversity' @ vre.aston.ac.uk


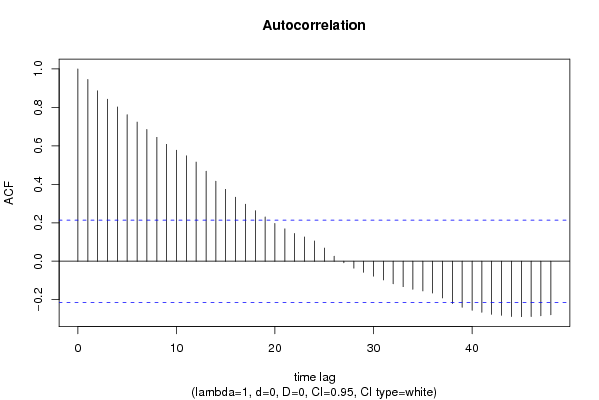
Autocorrelation Function
Time lag kACF(k)T-STATP-value
10.9457538.6680
20.8862468.12260
30.8421787.71870
40.8023097.35330
50.7622366.9860
60.7234156.63020
70.6849826.2780
80.6442945.90510
90.6079345.57180
100.576915.28750
110.5481555.02391e-06
120.5155644.72525e-06
130.4677124.28672.4e-05
140.4162473.8150.00013
150.3737273.42530.000476
160.3331283.05320.001516
170.296632.71870.003981
180.2630332.41070.009051
190.2296862.10510.019135
200.1964411.80040.037693
210.1684241.54360.063219
220.1444081.32350.094627
230.1262231.15680.125307
240.1053330.96540.168559
250.0683670.62660.266314
260.0260510.23880.405935
27-0.008115-0.07440.470446
28-0.036261-0.33230.37023
29-0.057296-0.52510.300439
30-0.077659-0.71180.239293
31-0.097383-0.89250.187329
32-0.117683-1.07860.14193
33-0.132316-1.21270.114323
34-0.146384-1.34160.091666
35-0.154525-1.41620.0802
36-0.165151-1.51360.066936
37-0.190794-1.74870.042001
38-0.219757-2.01410.023599
39-0.239183-2.19210.015568
40-0.255031-2.33740.010899
41-0.265524-2.43360.008536
42-0.275856-2.52830.006667
43-0.280815-2.57370.005908
44-0.287765-2.63740.004976
45-0.288371-2.6430.004901
46-0.288189-2.64130.004924
47-0.283662-2.59980.005509
48-0.27882-2.55540.006204

\begin{tabular}{lllllllll}
\hline
Autocorrelation Function \tabularnewline
Time lag k & ACF(k) & T-STAT & P-value \tabularnewline
1 & 0.945753 & 8.668 & 0 \tabularnewline
2 & 0.886246 & 8.1226 & 0 \tabularnewline
3 & 0.842178 & 7.7187 & 0 \tabularnewline
4 & 0.802309 & 7.3533 & 0 \tabularnewline
5 & 0.762236 & 6.986 & 0 \tabularnewline
6 & 0.723415 & 6.6302 & 0 \tabularnewline
7 & 0.684982 & 6.278 & 0 \tabularnewline
8 & 0.644294 & 5.9051 & 0 \tabularnewline
9 & 0.607934 & 5.5718 & 0 \tabularnewline
10 & 0.57691 & 5.2875 & 0 \tabularnewline
11 & 0.548155 & 5.0239 & 1e-06 \tabularnewline
12 & 0.515564 & 4.7252 & 5e-06 \tabularnewline
13 & 0.467712 & 4.2867 & 2.4e-05 \tabularnewline
14 & 0.416247 & 3.815 & 0.00013 \tabularnewline
15 & 0.373727 & 3.4253 & 0.000476 \tabularnewline
16 & 0.333128 & 3.0532 & 0.001516 \tabularnewline
17 & 0.29663 & 2.7187 & 0.003981 \tabularnewline
18 & 0.263033 & 2.4107 & 0.009051 \tabularnewline
19 & 0.229686 & 2.1051 & 0.019135 \tabularnewline
20 & 0.196441 & 1.8004 & 0.037693 \tabularnewline
21 & 0.168424 & 1.5436 & 0.063219 \tabularnewline
22 & 0.144408 & 1.3235 & 0.094627 \tabularnewline
23 & 0.126223 & 1.1568 & 0.125307 \tabularnewline
24 & 0.105333 & 0.9654 & 0.168559 \tabularnewline
25 & 0.068367 & 0.6266 & 0.266314 \tabularnewline
26 & 0.026051 & 0.2388 & 0.405935 \tabularnewline
27 & -0.008115 & -0.0744 & 0.470446 \tabularnewline
28 & -0.036261 & -0.3323 & 0.37023 \tabularnewline
29 & -0.057296 & -0.5251 & 0.300439 \tabularnewline
30 & -0.077659 & -0.7118 & 0.239293 \tabularnewline
31 & -0.097383 & -0.8925 & 0.187329 \tabularnewline
32 & -0.117683 & -1.0786 & 0.14193 \tabularnewline
33 & -0.132316 & -1.2127 & 0.114323 \tabularnewline
34 & -0.146384 & -1.3416 & 0.091666 \tabularnewline
35 & -0.154525 & -1.4162 & 0.0802 \tabularnewline
36 & -0.165151 & -1.5136 & 0.066936 \tabularnewline
37 & -0.190794 & -1.7487 & 0.042001 \tabularnewline
38 & -0.219757 & -2.0141 & 0.023599 \tabularnewline
39 & -0.239183 & -2.1921 & 0.015568 \tabularnewline
40 & -0.255031 & -2.3374 & 0.010899 \tabularnewline
41 & -0.265524 & -2.4336 & 0.008536 \tabularnewline
42 & -0.275856 & -2.5283 & 0.006667 \tabularnewline
43 & -0.280815 & -2.5737 & 0.005908 \tabularnewline
44 & -0.287765 & -2.6374 & 0.004976 \tabularnewline
45 & -0.288371 & -2.643 & 0.004901 \tabularnewline
46 & -0.288189 & -2.6413 & 0.004924 \tabularnewline
47 & -0.283662 & -2.5998 & 0.005509 \tabularnewline
48 & -0.27882 & -2.5554 & 0.006204 \tabularnewline
\hline
\end{tabular}
%Source: https://freestatistics.org/blog/index.php?pk=78081&T=1

[TABLE]
[ROW][C]Autocorrelation Function[/C][/ROW]
[ROW][C]Time lag k[/C][C]ACF(k)[/C][C]T-STAT[/C][C]P-value[/C][/ROW]
[ROW][C]1[/C][C]0.945753[/C][C]8.668[/C][C]0[/C][/ROW]
[ROW][C]2[/C][C]0.886246[/C][C]8.1226[/C][C]0[/C][/ROW]
[ROW][C]3[/C][C]0.842178[/C][C]7.7187[/C][C]0[/C][/ROW]
[ROW][C]4[/C][C]0.802309[/C][C]7.3533[/C][C]0[/C][/ROW]
[ROW][C]5[/C][C]0.762236[/C][C]6.986[/C][C]0[/C][/ROW]
[ROW][C]6[/C][C]0.723415[/C][C]6.6302[/C][C]0[/C][/ROW]
[ROW][C]7[/C][C]0.684982[/C][C]6.278[/C][C]0[/C][/ROW]
[ROW][C]8[/C][C]0.644294[/C][C]5.9051[/C][C]0[/C][/ROW]
[ROW][C]9[/C][C]0.607934[/C][C]5.5718[/C][C]0[/C][/ROW]
[ROW][C]10[/C][C]0.57691[/C][C]5.2875[/C][C]0[/C][/ROW]
[ROW][C]11[/C][C]0.548155[/C][C]5.0239[/C][C]1e-06[/C][/ROW]
[ROW][C]12[/C][C]0.515564[/C][C]4.7252[/C][C]5e-06[/C][/ROW]
[ROW][C]13[/C][C]0.467712[/C][C]4.2867[/C][C]2.4e-05[/C][/ROW]
[ROW][C]14[/C][C]0.416247[/C][C]3.815[/C][C]0.00013[/C][/ROW]
[ROW][C]15[/C][C]0.373727[/C][C]3.4253[/C][C]0.000476[/C][/ROW]
[ROW][C]16[/C][C]0.333128[/C][C]3.0532[/C][C]0.001516[/C][/ROW]
[ROW][C]17[/C][C]0.29663[/C][C]2.7187[/C][C]0.003981[/C][/ROW]
[ROW][C]18[/C][C]0.263033[/C][C]2.4107[/C][C]0.009051[/C][/ROW]
[ROW][C]19[/C][C]0.229686[/C][C]2.1051[/C][C]0.019135[/C][/ROW]
[ROW][C]20[/C][C]0.196441[/C][C]1.8004[/C][C]0.037693[/C][/ROW]
[ROW][C]21[/C][C]0.168424[/C][C]1.5436[/C][C]0.063219[/C][/ROW]
[ROW][C]22[/C][C]0.144408[/C][C]1.3235[/C][C]0.094627[/C][/ROW]
[ROW][C]23[/C][C]0.126223[/C][C]1.1568[/C][C]0.125307[/C][/ROW]
[ROW][C]24[/C][C]0.105333[/C][C]0.9654[/C][C]0.168559[/C][/ROW]
[ROW][C]25[/C][C]0.068367[/C][C]0.6266[/C][C]0.266314[/C][/ROW]
[ROW][C]26[/C][C]0.026051[/C][C]0.2388[/C][C]0.405935[/C][/ROW]
[ROW][C]27[/C][C]-0.008115[/C][C]-0.0744[/C][C]0.470446[/C][/ROW]
[ROW][C]28[/C][C]-0.036261[/C][C]-0.3323[/C][C]0.37023[/C][/ROW]
[ROW][C]29[/C][C]-0.057296[/C][C]-0.5251[/C][C]0.300439[/C][/ROW]
[ROW][C]30[/C][C]-0.077659[/C][C]-0.7118[/C][C]0.239293[/C][/ROW]
[ROW][C]31[/C][C]-0.097383[/C][C]-0.8925[/C][C]0.187329[/C][/ROW]
[ROW][C]32[/C][C]-0.117683[/C][C]-1.0786[/C][C]0.14193[/C][/ROW]
[ROW][C]33[/C][C]-0.132316[/C][C]-1.2127[/C][C]0.114323[/C][/ROW]
[ROW][C]34[/C][C]-0.146384[/C][C]-1.3416[/C][C]0.091666[/C][/ROW]
[ROW][C]35[/C][C]-0.154525[/C][C]-1.4162[/C][C]0.0802[/C][/ROW]
[ROW][C]36[/C][C]-0.165151[/C][C]-1.5136[/C][C]0.066936[/C][/ROW]
[ROW][C]37[/C][C]-0.190794[/C][C]-1.7487[/C][C]0.042001[/C][/ROW]
[ROW][C]38[/C][C]-0.219757[/C][C]-2.0141[/C][C]0.023599[/C][/ROW]
[ROW][C]39[/C][C]-0.239183[/C][C]-2.1921[/C][C]0.015568[/C][/ROW]
[ROW][C]40[/C][C]-0.255031[/C][C]-2.3374[/C][C]0.010899[/C][/ROW]
[ROW][C]41[/C][C]-0.265524[/C][C]-2.4336[/C][C]0.008536[/C][/ROW]
[ROW][C]42[/C][C]-0.275856[/C][C]-2.5283[/C][C]0.006667[/C][/ROW]
[ROW][C]43[/C][C]-0.280815[/C][C]-2.5737[/C][C]0.005908[/C][/ROW]
[ROW][C]44[/C][C]-0.287765[/C][C]-2.6374[/C][C]0.004976[/C][/ROW]
[ROW][C]45[/C][C]-0.288371[/C][C]-2.643[/C][C]0.004901[/C][/ROW]
[ROW][C]46[/C][C]-0.288189[/C][C]-2.6413[/C][C]0.004924[/C][/ROW]
[ROW][C]47[/C][C]-0.283662[/C][C]-2.5998[/C][C]0.005509[/C][/ROW]
[ROW][C]48[/C][C]-0.27882[/C][C]-2.5554[/C][C]0.006204[/C][/ROW]
[/TABLE]
Source: https://freestatistics.org/blog/index.php?pk=78081&T=1

Globally Unique Identifier (entire table): ba.freestatistics.org/blog/index.php?pk=78081&T=1

As an alternative you can also use a QR Code:  

The GUIDs for individual cells are displayed in the table below:

Autocorrelation Function
Time lag kACF(k)T-STATP-value
10.9457538.6680
20.8862468.12260
30.8421787.71870
40.8023097.35330
50.7622366.9860
60.7234156.63020
70.6849826.2780
80.6442945.90510
90.6079345.57180
100.576915.28750
110.5481555.02391e-06
120.5155644.72525e-06
130.4677124.28672.4e-05
140.4162473.8150.00013
150.3737273.42530.000476
160.3331283.05320.001516
170.296632.71870.003981
180.2630332.41070.009051
190.2296862.10510.019135
200.1964411.80040.037693
210.1684241.54360.063219
220.1444081.32350.094627
230.1262231.15680.125307
240.1053330.96540.168559
250.0683670.62660.266314
260.0260510.23880.405935
27-0.008115-0.07440.470446
28-0.036261-0.33230.37023
29-0.057296-0.52510.300439
30-0.077659-0.71180.239293
31-0.097383-0.89250.187329
32-0.117683-1.07860.14193
33-0.132316-1.21270.114323
34-0.146384-1.34160.091666
35-0.154525-1.41620.0802
36-0.165151-1.51360.066936
37-0.190794-1.74870.042001
38-0.219757-2.01410.023599
39-0.239183-2.19210.015568
40-0.255031-2.33740.010899
41-0.265524-2.43360.008536
42-0.275856-2.52830.006667
43-0.280815-2.57370.005908
44-0.287765-2.63740.004976
45-0.288371-2.6430.004901
46-0.288189-2.64130.004924
47-0.283662-2.59980.005509
48-0.27882-2.55540.006204


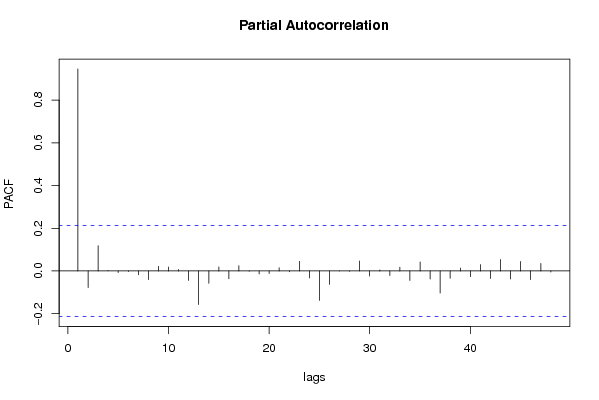
Partial Autocorrelation Function
Time lag kPACF(k)T-STATP-value
10.9457538.6680
2-0.077719-0.71230.239123
30.1179031.08060.141484
40.0006780.00620.497527
5-0.007506-0.06880.47266
6-0.002607-0.02390.490497
7-0.017946-0.16450.434876
8-0.040232-0.36870.356626
90.0216030.1980.421763
100.0188810.1730.431516
110.0072610.06660.473548
12-0.044168-0.40480.343323
13-0.157086-1.43970.076832
14-0.057442-0.52650.299977
150.0187660.1720.431929
16-0.036133-0.33120.370671
170.0247170.22650.410669
18-0.001592-0.01460.494196
19-0.013829-0.12670.449721
20-0.011654-0.10680.457595
210.0155760.14280.443411
22-0.004222-0.03870.484614
230.0450370.41280.340412
24-0.032509-0.2980.383237
25-0.137848-1.26340.10497
26-0.062784-0.57540.283272
27-0.000393-0.00360.498568
28-0.001425-0.01310.494804
290.0467990.42890.334539
30-0.023412-0.21460.41531
310.00460.04220.483237
32-0.021276-0.1950.422932
330.0173320.15880.437085
34-0.044088-0.40410.343593
350.0417790.38290.351376
36-0.037338-0.34220.366523
37-0.103178-0.94560.173521
38-0.033937-0.3110.378271
390.0135310.1240.450801
40-0.02661-0.24390.403958
410.0298520.27360.392533
42-0.035446-0.32490.373044
430.0535540.49080.312414
44-0.037741-0.34590.365141
450.0441510.40460.343382
46-0.040377-0.37010.356135
470.0353040.32360.373534
48-0.004789-0.04390.482546

\begin{tabular}{lllllllll}
\hline
Partial Autocorrelation Function \tabularnewline
Time lag k & PACF(k) & T-STAT & P-value \tabularnewline
1 & 0.945753 & 8.668 & 0 \tabularnewline
2 & -0.077719 & -0.7123 & 0.239123 \tabularnewline
3 & 0.117903 & 1.0806 & 0.141484 \tabularnewline
4 & 0.000678 & 0.0062 & 0.497527 \tabularnewline
5 & -0.007506 & -0.0688 & 0.47266 \tabularnewline
6 & -0.002607 & -0.0239 & 0.490497 \tabularnewline
7 & -0.017946 & -0.1645 & 0.434876 \tabularnewline
8 & -0.040232 & -0.3687 & 0.356626 \tabularnewline
9 & 0.021603 & 0.198 & 0.421763 \tabularnewline
10 & 0.018881 & 0.173 & 0.431516 \tabularnewline
11 & 0.007261 & 0.0666 & 0.473548 \tabularnewline
12 & -0.044168 & -0.4048 & 0.343323 \tabularnewline
13 & -0.157086 & -1.4397 & 0.076832 \tabularnewline
14 & -0.057442 & -0.5265 & 0.299977 \tabularnewline
15 & 0.018766 & 0.172 & 0.431929 \tabularnewline
16 & -0.036133 & -0.3312 & 0.370671 \tabularnewline
17 & 0.024717 & 0.2265 & 0.410669 \tabularnewline
18 & -0.001592 & -0.0146 & 0.494196 \tabularnewline
19 & -0.013829 & -0.1267 & 0.449721 \tabularnewline
20 & -0.011654 & -0.1068 & 0.457595 \tabularnewline
21 & 0.015576 & 0.1428 & 0.443411 \tabularnewline
22 & -0.004222 & -0.0387 & 0.484614 \tabularnewline
23 & 0.045037 & 0.4128 & 0.340412 \tabularnewline
24 & -0.032509 & -0.298 & 0.383237 \tabularnewline
25 & -0.137848 & -1.2634 & 0.10497 \tabularnewline
26 & -0.062784 & -0.5754 & 0.283272 \tabularnewline
27 & -0.000393 & -0.0036 & 0.498568 \tabularnewline
28 & -0.001425 & -0.0131 & 0.494804 \tabularnewline
29 & 0.046799 & 0.4289 & 0.334539 \tabularnewline
30 & -0.023412 & -0.2146 & 0.41531 \tabularnewline
31 & 0.0046 & 0.0422 & 0.483237 \tabularnewline
32 & -0.021276 & -0.195 & 0.422932 \tabularnewline
33 & 0.017332 & 0.1588 & 0.437085 \tabularnewline
34 & -0.044088 & -0.4041 & 0.343593 \tabularnewline
35 & 0.041779 & 0.3829 & 0.351376 \tabularnewline
36 & -0.037338 & -0.3422 & 0.366523 \tabularnewline
37 & -0.103178 & -0.9456 & 0.173521 \tabularnewline
38 & -0.033937 & -0.311 & 0.378271 \tabularnewline
39 & 0.013531 & 0.124 & 0.450801 \tabularnewline
40 & -0.02661 & -0.2439 & 0.403958 \tabularnewline
41 & 0.029852 & 0.2736 & 0.392533 \tabularnewline
42 & -0.035446 & -0.3249 & 0.373044 \tabularnewline
43 & 0.053554 & 0.4908 & 0.312414 \tabularnewline
44 & -0.037741 & -0.3459 & 0.365141 \tabularnewline
45 & 0.044151 & 0.4046 & 0.343382 \tabularnewline
46 & -0.040377 & -0.3701 & 0.356135 \tabularnewline
47 & 0.035304 & 0.3236 & 0.373534 \tabularnewline
48 & -0.004789 & -0.0439 & 0.482546 \tabularnewline
\hline
\end{tabular}
%Source: https://freestatistics.org/blog/index.php?pk=78081&T=2

[TABLE]
[ROW][C]Partial Autocorrelation Function[/C][/ROW]
[ROW][C]Time lag k[/C][C]PACF(k)[/C][C]T-STAT[/C][C]P-value[/C][/ROW]
[ROW][C]1[/C][C]0.945753[/C][C]8.668[/C][C]0[/C][/ROW]
[ROW][C]2[/C][C]-0.077719[/C][C]-0.7123[/C][C]0.239123[/C][/ROW]
[ROW][C]3[/C][C]0.117903[/C][C]1.0806[/C][C]0.141484[/C][/ROW]
[ROW][C]4[/C][C]0.000678[/C][C]0.0062[/C][C]0.497527[/C][/ROW]
[ROW][C]5[/C][C]-0.007506[/C][C]-0.0688[/C][C]0.47266[/C][/ROW]
[ROW][C]6[/C][C]-0.002607[/C][C]-0.0239[/C][C]0.490497[/C][/ROW]
[ROW][C]7[/C][C]-0.017946[/C][C]-0.1645[/C][C]0.434876[/C][/ROW]
[ROW][C]8[/C][C]-0.040232[/C][C]-0.3687[/C][C]0.356626[/C][/ROW]
[ROW][C]9[/C][C]0.021603[/C][C]0.198[/C][C]0.421763[/C][/ROW]
[ROW][C]10[/C][C]0.018881[/C][C]0.173[/C][C]0.431516[/C][/ROW]
[ROW][C]11[/C][C]0.007261[/C][C]0.0666[/C][C]0.473548[/C][/ROW]
[ROW][C]12[/C][C]-0.044168[/C][C]-0.4048[/C][C]0.343323[/C][/ROW]
[ROW][C]13[/C][C]-0.157086[/C][C]-1.4397[/C][C]0.076832[/C][/ROW]
[ROW][C]14[/C][C]-0.057442[/C][C]-0.5265[/C][C]0.299977[/C][/ROW]
[ROW][C]15[/C][C]0.018766[/C][C]0.172[/C][C]0.431929[/C][/ROW]
[ROW][C]16[/C][C]-0.036133[/C][C]-0.3312[/C][C]0.370671[/C][/ROW]
[ROW][C]17[/C][C]0.024717[/C][C]0.2265[/C][C]0.410669[/C][/ROW]
[ROW][C]18[/C][C]-0.001592[/C][C]-0.0146[/C][C]0.494196[/C][/ROW]
[ROW][C]19[/C][C]-0.013829[/C][C]-0.1267[/C][C]0.449721[/C][/ROW]
[ROW][C]20[/C][C]-0.011654[/C][C]-0.1068[/C][C]0.457595[/C][/ROW]
[ROW][C]21[/C][C]0.015576[/C][C]0.1428[/C][C]0.443411[/C][/ROW]
[ROW][C]22[/C][C]-0.004222[/C][C]-0.0387[/C][C]0.484614[/C][/ROW]
[ROW][C]23[/C][C]0.045037[/C][C]0.4128[/C][C]0.340412[/C][/ROW]
[ROW][C]24[/C][C]-0.032509[/C][C]-0.298[/C][C]0.383237[/C][/ROW]
[ROW][C]25[/C][C]-0.137848[/C][C]-1.2634[/C][C]0.10497[/C][/ROW]
[ROW][C]26[/C][C]-0.062784[/C][C]-0.5754[/C][C]0.283272[/C][/ROW]
[ROW][C]27[/C][C]-0.000393[/C][C]-0.0036[/C][C]0.498568[/C][/ROW]
[ROW][C]28[/C][C]-0.001425[/C][C]-0.0131[/C][C]0.494804[/C][/ROW]
[ROW][C]29[/C][C]0.046799[/C][C]0.4289[/C][C]0.334539[/C][/ROW]
[ROW][C]30[/C][C]-0.023412[/C][C]-0.2146[/C][C]0.41531[/C][/ROW]
[ROW][C]31[/C][C]0.0046[/C][C]0.0422[/C][C]0.483237[/C][/ROW]
[ROW][C]32[/C][C]-0.021276[/C][C]-0.195[/C][C]0.422932[/C][/ROW]
[ROW][C]33[/C][C]0.017332[/C][C]0.1588[/C][C]0.437085[/C][/ROW]
[ROW][C]34[/C][C]-0.044088[/C][C]-0.4041[/C][C]0.343593[/C][/ROW]
[ROW][C]35[/C][C]0.041779[/C][C]0.3829[/C][C]0.351376[/C][/ROW]
[ROW][C]36[/C][C]-0.037338[/C][C]-0.3422[/C][C]0.366523[/C][/ROW]
[ROW][C]37[/C][C]-0.103178[/C][C]-0.9456[/C][C]0.173521[/C][/ROW]
[ROW][C]38[/C][C]-0.033937[/C][C]-0.311[/C][C]0.378271[/C][/ROW]
[ROW][C]39[/C][C]0.013531[/C][C]0.124[/C][C]0.450801[/C][/ROW]
[ROW][C]40[/C][C]-0.02661[/C][C]-0.2439[/C][C]0.403958[/C][/ROW]
[ROW][C]41[/C][C]0.029852[/C][C]0.2736[/C][C]0.392533[/C][/ROW]
[ROW][C]42[/C][C]-0.035446[/C][C]-0.3249[/C][C]0.373044[/C][/ROW]
[ROW][C]43[/C][C]0.053554[/C][C]0.4908[/C][C]0.312414[/C][/ROW]
[ROW][C]44[/C][C]-0.037741[/C][C]-0.3459[/C][C]0.365141[/C][/ROW]
[ROW][C]45[/C][C]0.044151[/C][C]0.4046[/C][C]0.343382[/C][/ROW]
[ROW][C]46[/C][C]-0.040377[/C][C]-0.3701[/C][C]0.356135[/C][/ROW]
[ROW][C]47[/C][C]0.035304[/C][C]0.3236[/C][C]0.373534[/C][/ROW]
[ROW][C]48[/C][C]-0.004789[/C][C]-0.0439[/C][C]0.482546[/C][/ROW]
[/TABLE]
Source: https://freestatistics.org/blog/index.php?pk=78081&T=2

Globally Unique Identifier (entire table): ba.freestatistics.org/blog/index.php?pk=78081&T=2

As an alternative you can also use a QR Code:  

The GUIDs for individual cells are displayed in the table below:

Partial Autocorrelation Function
Time lag kPACF(k)T-STATP-value
10.9457538.6680
2-0.077719-0.71230.239123
30.1179031.08060.141484
40.0006780.00620.497527
5-0.007506-0.06880.47266
6-0.002607-0.02390.490497
7-0.017946-0.16450.434876
8-0.040232-0.36870.356626
90.0216030.1980.421763
100.0188810.1730.431516
110.0072610.06660.473548
12-0.044168-0.40480.343323
13-0.157086-1.43970.076832
14-0.057442-0.52650.299977
150.0187660.1720.431929
16-0.036133-0.33120.370671
170.0247170.22650.410669
18-0.001592-0.01460.494196
19-0.013829-0.12670.449721
20-0.011654-0.10680.457595
210.0155760.14280.443411
22-0.004222-0.03870.484614
230.0450370.41280.340412
24-0.032509-0.2980.383237
25-0.137848-1.26340.10497
26-0.062784-0.57540.283272
27-0.000393-0.00360.498568
28-0.001425-0.01310.494804
290.0467990.42890.334539
30-0.023412-0.21460.41531
310.00460.04220.483237
32-0.021276-0.1950.422932
330.0173320.15880.437085
34-0.044088-0.40410.343593
350.0417790.38290.351376
36-0.037338-0.34220.366523
37-0.103178-0.94560.173521
38-0.033937-0.3110.378271
390.0135310.1240.450801
40-0.02661-0.24390.403958
410.0298520.27360.392533
42-0.035446-0.32490.373044
430.0535540.49080.312414
44-0.037741-0.34590.365141
450.0441510.40460.343382
46-0.040377-0.37010.356135
470.0353040.32360.373534
48-0.004789-0.04390.482546


Parameters (Session):
par1 = 48 ; par2 = 1 ; par3 = 0 ; par4 = 0 ; par5 = 12 ; par6 = White Noise ; par7 = 0.95 ;
Parameters (R input):
par1 = 48 ; par2 = 1 ; par3 = 0 ; par4 = 0 ; par5 = 12 ; par6 = White Noise ; par7 = 0.95 ;
R code (references can be found in the software module):
if (par1 == 'Default') {
par1 = 10*log10(length(x))
} else {
par1 <- as.numeric(par1)
}
par2 <- as.numeric(par2)
par3 <- as.numeric(par3)
par4 <- as.numeric(par4)
par5 <- as.numeric(par5)
if (par6 == 'White Noise') par6 <- 'white' else par6 <- 'ma'
par7 <- as.numeric(par7)
if (par2 == 0) {
x <- log(x)
} else {
x <- (x ^ par2 - 1) / par2
}
if (par3 > 0) x <- diff(x,lag=1,difference=par3)
if (par4 > 0) x <- diff(x,lag=par5,difference=par4)
bitmap(file='pic1.png')
racf <- acf(x, par1, main='Autocorrelation', xlab='time lag', ylab='ACF', ci.type=par6, ci=par7, sub=paste('(lambda=',par2,', d=',par3,', D=',par4,', CI=', par7, ', CI type=',par6,')',sep=''))
dev.off()
bitmap(file='pic2.png')
rpacf <- pacf(x,par1,main='Partial Autocorrelation',xlab='lags',ylab='PACF')
dev.off()
(myacf <- c(racf$acf))
(mypacf <- c(rpacf$acf))
lengthx <- length(x)
sqrtn <- sqrt(lengthx)
load(file='createtable')
a<-table.start()
a<-table.row.start(a)
a<-table.element(a,'Autocorrelation Function',4,TRUE)
a<-table.row.end(a)
a<-table.row.start(a)
a<-table.element(a,'Time lag k',header=TRUE)
a<-table.element(a,hyperlink('basics.htm','ACF(k)','click here for more information about the Autocorrelation Function'),header=TRUE)
a<-table.element(a,'T-STAT',header=TRUE)
a<-table.element(a,'P-value',header=TRUE)
a<-table.row.end(a)
for (i in 2:(par1+1)) {
a<-table.row.start(a)
a<-table.element(a,i-1,header=TRUE)
a<-table.element(a,round(myacf[i],6))
mytstat <- myacf[i]*sqrtn
a<-table.element(a,round(mytstat,4))
a<-table.element(a,round(1-pt(abs(mytstat),lengthx),6))
a<-table.row.end(a)
}
a<-table.end(a)
table.save(a,file='mytable.tab')
a<-table.start()
a<-table.row.start(a)
a<-table.element(a,'Partial Autocorrelation Function',4,TRUE)
a<-table.row.end(a)
a<-table.row.start(a)
a<-table.element(a,'Time lag k',header=TRUE)
a<-table.element(a,hyperlink('basics.htm','PACF(k)','click here for more information about the Partial Autocorrelation Function'),header=TRUE)
a<-table.element(a,'T-STAT',header=TRUE)
a<-table.element(a,'P-value',header=TRUE)
a<-table.row.end(a)
for (i in 1:par1) {
a<-table.row.start(a)
a<-table.element(a,i,header=TRUE)
a<-table.element(a,round(mypacf[i],6))
mytstat <- mypacf[i]*sqrtn
a<-table.element(a,round(mytstat,4))
a<-table.element(a,round(1-pt(abs(mytstat),lengthx),6))
a<-table.row.end(a)
}
a<-table.end(a)
table.save(a,file='mytable1.tab')