Free Statistics

of Irreproducible Research!

Author's title

Author*Unverified author*
R Software Modulerwasp_smp.wasp
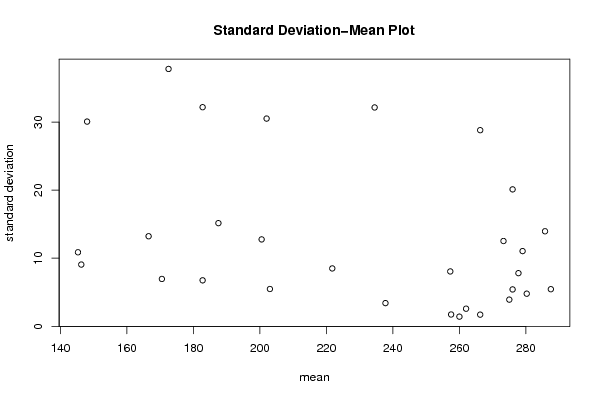
Title produced by softwareStandard Deviation-Mean Plot
Date of computationWed, 21 Jul 2010 11:12:51 +0000
Cite this page as followsStatistical Computations at FreeStatistics.org, Office for Research Development and Education, URL https://freestatistics.org/blog/index.php?v=date/2010/Jul/21/t127971078458lti6kqmq6kvqi.htm/, Retrieved Mon, 29 Apr 2024 03:38:35 +0000
Statistical Computations at FreeStatistics.org, Office for Research Development and Education, URL https://freestatistics.org/blog/index.php?pk=78048, Retrieved Mon, 29 Apr 2024 03:38:35 +0000
QR Codes:

Original text written by user:
IsPrivate?No (this computation is public)
User-defined keywordsVan de Walle Mathias
Estimated Impact215
Family? (F = Feedback message, R = changed R code, M = changed R Module, P = changed Parameters, D = changed Data)
-       [Standard Deviation-Mean Plot] [tijdreeks 1 - sta...] [2010-07-21 11:12:51] [589929edeb20bd59f78e9be1ffd92c80] [Current]
Feedback Forum

Post a new message
Dataseries X:
268
267
266
264
284
283
268
258
259
259
260
262
255
259
258
258
288
289
271
268
274
284
284
279
273
280
276
271
298
297
278
270
280
289
288
293
285
283
275
268
295
290
267
252
268
278
280
278
261
263
259
265
294
285
255
231
246
258
265
260
238
241
239
233
265
255
224
194
210
222
230
225
206
204
207
195
230
221
195
162
182
203
211
206
187
181
189
174
213
201
177
140
165
192
197
196
176
164
177
165
208
195
164
123
147
173
176
170
157
145
148
135
175
168
140
109
129
150
150
152


Summary of computational transaction
Raw Inputview raw input (R code)
Raw Outputview raw output of R engine
Computing time1 seconds
R Server'RServer@AstonUniversity' @ vre.aston.ac.uk

\begin{tabular}{lllllllll}
\hline
Summary of computational transaction \tabularnewline
Raw Input & view raw input (R code)  \tabularnewline
Raw Output & view raw output of R engine  \tabularnewline
Computing time & 1 seconds \tabularnewline
R Server & 'RServer@AstonUniversity' @ vre.aston.ac.uk \tabularnewline
\hline
\end{tabular}
%Source: https://freestatistics.org/blog/index.php?pk=78048&T=0

[TABLE]
[ROW][C]Summary of computational transaction[/C][/ROW]
[ROW][C]Raw Input[/C][C]view raw input (R code) [/C][/ROW]
[ROW][C]Raw Output[/C][C]view raw output of R engine [/C][/ROW]
[ROW][C]Computing time[/C][C]1 seconds[/C][/ROW]
[ROW][C]R Server[/C][C]'RServer@AstonUniversity' @ vre.aston.ac.uk[/C][/ROW]
[/TABLE]
Source: https://freestatistics.org/blog/index.php?pk=78048&T=0

Globally Unique Identifier (entire table): ba.freestatistics.org/blog/index.php?pk=78048&T=0

As an alternative you can also use a QR Code:  

The GUIDs for individual cells are displayed in the table below:

Summary of computational transaction
Raw Inputview raw input (R code)
Raw Outputview raw output of R engine
Computing time1 seconds
R Server'RServer@AstonUniversity' @ vre.aston.ac.uk


Standard Deviation-Mean Plot
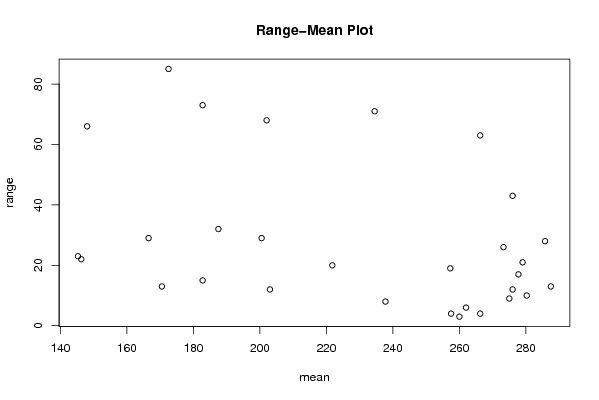
SectionMeanStandard DeviationRange
1266.251.707825127659934
2273.2512.526638282742426
32601.41421356237313
4257.51.732050807568884
527911.045361017187321
6280.254.7871355387816910
72753.915780041490249
8285.7513.961255912942328
9287.55.4467115461227313
10277.757.804912982645417
1127620.116328359486243
122765.4160256030906412
132622.581988897471616
14266.2528.814059068447863
15257.258.0570879768478819
16237.753.403429642777028
17234.532.150686877058671
18221.758.520
192035.4772255750516612
2020230.517754395324368
21200.512.767145334803729
22182.756.751543033509715
23182.7532.190837205639773
24187.515.154757228892432
25170.56.9522178715380713
26172.537.810933163129885
27166.513.22875655532329
28146.259.0691785736085322
2914830.077677215281566
30145.2510.874281585465823

\begin{tabular}{lllllllll}
\hline
Standard Deviation-Mean Plot \tabularnewline
Section & Mean & Standard Deviation & Range \tabularnewline
1 & 266.25 & 1.70782512765993 & 4 \tabularnewline
2 & 273.25 & 12.5266382827424 & 26 \tabularnewline
3 & 260 & 1.4142135623731 & 3 \tabularnewline
4 & 257.5 & 1.73205080756888 & 4 \tabularnewline
5 & 279 & 11.0453610171873 & 21 \tabularnewline
6 & 280.25 & 4.78713553878169 & 10 \tabularnewline
7 & 275 & 3.91578004149024 & 9 \tabularnewline
8 & 285.75 & 13.9612559129423 & 28 \tabularnewline
9 & 287.5 & 5.44671154612273 & 13 \tabularnewline
10 & 277.75 & 7.8049129826454 & 17 \tabularnewline
11 & 276 & 20.1163283594862 & 43 \tabularnewline
12 & 276 & 5.41602560309064 & 12 \tabularnewline
13 & 262 & 2.58198889747161 & 6 \tabularnewline
14 & 266.25 & 28.8140590684478 & 63 \tabularnewline
15 & 257.25 & 8.05708797684788 & 19 \tabularnewline
16 & 237.75 & 3.40342964277702 & 8 \tabularnewline
17 & 234.5 & 32.1506868770586 & 71 \tabularnewline
18 & 221.75 & 8.5 & 20 \tabularnewline
19 & 203 & 5.47722557505166 & 12 \tabularnewline
20 & 202 & 30.5177543953243 & 68 \tabularnewline
21 & 200.5 & 12.7671453348037 & 29 \tabularnewline
22 & 182.75 & 6.7515430335097 & 15 \tabularnewline
23 & 182.75 & 32.1908372056397 & 73 \tabularnewline
24 & 187.5 & 15.1547572288924 & 32 \tabularnewline
25 & 170.5 & 6.95221787153807 & 13 \tabularnewline
26 & 172.5 & 37.8109331631298 & 85 \tabularnewline
27 & 166.5 & 13.228756555323 & 29 \tabularnewline
28 & 146.25 & 9.06917857360853 & 22 \tabularnewline
29 & 148 & 30.0776772152815 & 66 \tabularnewline
30 & 145.25 & 10.8742815854658 & 23 \tabularnewline
\hline
\end{tabular}
%Source: https://freestatistics.org/blog/index.php?pk=78048&T=1

[TABLE]
[ROW][C]Standard Deviation-Mean Plot[/C][/ROW]
[ROW][C]Section[/C][C]Mean[/C][C]Standard Deviation[/C][C]Range[/C][/ROW]
[ROW][C]1[/C][C]266.25[/C][C]1.70782512765993[/C][C]4[/C][/ROW]
[ROW][C]2[/C][C]273.25[/C][C]12.5266382827424[/C][C]26[/C][/ROW]
[ROW][C]3[/C][C]260[/C][C]1.4142135623731[/C][C]3[/C][/ROW]
[ROW][C]4[/C][C]257.5[/C][C]1.73205080756888[/C][C]4[/C][/ROW]
[ROW][C]5[/C][C]279[/C][C]11.0453610171873[/C][C]21[/C][/ROW]
[ROW][C]6[/C][C]280.25[/C][C]4.78713553878169[/C][C]10[/C][/ROW]
[ROW][C]7[/C][C]275[/C][C]3.91578004149024[/C][C]9[/C][/ROW]
[ROW][C]8[/C][C]285.75[/C][C]13.9612559129423[/C][C]28[/C][/ROW]
[ROW][C]9[/C][C]287.5[/C][C]5.44671154612273[/C][C]13[/C][/ROW]
[ROW][C]10[/C][C]277.75[/C][C]7.8049129826454[/C][C]17[/C][/ROW]
[ROW][C]11[/C][C]276[/C][C]20.1163283594862[/C][C]43[/C][/ROW]
[ROW][C]12[/C][C]276[/C][C]5.41602560309064[/C][C]12[/C][/ROW]
[ROW][C]13[/C][C]262[/C][C]2.58198889747161[/C][C]6[/C][/ROW]
[ROW][C]14[/C][C]266.25[/C][C]28.8140590684478[/C][C]63[/C][/ROW]
[ROW][C]15[/C][C]257.25[/C][C]8.05708797684788[/C][C]19[/C][/ROW]
[ROW][C]16[/C][C]237.75[/C][C]3.40342964277702[/C][C]8[/C][/ROW]
[ROW][C]17[/C][C]234.5[/C][C]32.1506868770586[/C][C]71[/C][/ROW]
[ROW][C]18[/C][C]221.75[/C][C]8.5[/C][C]20[/C][/ROW]
[ROW][C]19[/C][C]203[/C][C]5.47722557505166[/C][C]12[/C][/ROW]
[ROW][C]20[/C][C]202[/C][C]30.5177543953243[/C][C]68[/C][/ROW]
[ROW][C]21[/C][C]200.5[/C][C]12.7671453348037[/C][C]29[/C][/ROW]
[ROW][C]22[/C][C]182.75[/C][C]6.7515430335097[/C][C]15[/C][/ROW]
[ROW][C]23[/C][C]182.75[/C][C]32.1908372056397[/C][C]73[/C][/ROW]
[ROW][C]24[/C][C]187.5[/C][C]15.1547572288924[/C][C]32[/C][/ROW]
[ROW][C]25[/C][C]170.5[/C][C]6.95221787153807[/C][C]13[/C][/ROW]
[ROW][C]26[/C][C]172.5[/C][C]37.8109331631298[/C][C]85[/C][/ROW]
[ROW][C]27[/C][C]166.5[/C][C]13.228756555323[/C][C]29[/C][/ROW]
[ROW][C]28[/C][C]146.25[/C][C]9.06917857360853[/C][C]22[/C][/ROW]
[ROW][C]29[/C][C]148[/C][C]30.0776772152815[/C][C]66[/C][/ROW]
[ROW][C]30[/C][C]145.25[/C][C]10.8742815854658[/C][C]23[/C][/ROW]
[/TABLE]
Source: https://freestatistics.org/blog/index.php?pk=78048&T=1

Globally Unique Identifier (entire table): ba.freestatistics.org/blog/index.php?pk=78048&T=1

As an alternative you can also use a QR Code:  

The GUIDs for individual cells are displayed in the table below:

Standard Deviation-Mean Plot
SectionMeanStandard DeviationRange
1266.251.707825127659934
2273.2512.526638282742426
32601.41421356237313
4257.51.732050807568884
527911.045361017187321
6280.254.7871355387816910
72753.915780041490249
8285.7513.961255912942328
9287.55.4467115461227313
10277.757.804912982645417
1127620.116328359486243
122765.4160256030906412
132622.581988897471616
14266.2528.814059068447863
15257.258.0570879768478819
16237.753.403429642777028
17234.532.150686877058671
18221.758.520
192035.4772255750516612
2020230.517754395324368
21200.512.767145334803729
22182.756.751543033509715
23182.7532.190837205639773
24187.515.154757228892432
25170.56.9522178715380713
26172.537.810933163129885
27166.513.22875655532329
28146.259.0691785736085322
2914830.077677215281566
30145.2510.874281585465823


Regression: S.E.(k) = alpha + beta * Mean(k)
alpha31.1217827317606
beta-0.0798400992509438
S.D.0.0389175348184229
T-STAT-2.05151995426876
p-value0.0496759303685089

\begin{tabular}{lllllllll}
\hline
Regression: S.E.(k) = alpha + beta * Mean(k) \tabularnewline
alpha & 31.1217827317606 \tabularnewline
beta & -0.0798400992509438 \tabularnewline
S.D. & 0.0389175348184229 \tabularnewline
T-STAT & -2.05151995426876 \tabularnewline
p-value & 0.0496759303685089 \tabularnewline
\hline
\end{tabular}
%Source: https://freestatistics.org/blog/index.php?pk=78048&T=2

[TABLE]
[ROW][C]Regression: S.E.(k) = alpha + beta * Mean(k)[/C][/ROW]
[ROW][C]alpha[/C][C]31.1217827317606[/C][/ROW]
[ROW][C]beta[/C][C]-0.0798400992509438[/C][/ROW]
[ROW][C]S.D.[/C][C]0.0389175348184229[/C][/ROW]
[ROW][C]T-STAT[/C][C]-2.05151995426876[/C][/ROW]
[ROW][C]p-value[/C][C]0.0496759303685089[/C][/ROW]
[/TABLE]
Source: https://freestatistics.org/blog/index.php?pk=78048&T=2

Globally Unique Identifier (entire table): ba.freestatistics.org/blog/index.php?pk=78048&T=2

As an alternative you can also use a QR Code:  

The GUIDs for individual cells are displayed in the table below:

Regression: S.E.(k) = alpha + beta * Mean(k)
alpha31.1217827317606
beta-0.0798400992509438
S.D.0.0389175348184229
T-STAT-2.05151995426876
p-value0.0496759303685089


Regression: ln S.E.(k) = alpha + beta * ln Mean(k)
alpha10.8291231333678
beta-1.59758331950446
S.D.0.702098848537444
T-STAT-2.27543931005217
p-value0.0307310213465471
Lambda2.59758331950446

\begin{tabular}{lllllllll}
\hline
Regression: ln S.E.(k) = alpha + beta * ln Mean(k) \tabularnewline
alpha & 10.8291231333678 \tabularnewline
beta & -1.59758331950446 \tabularnewline
S.D. & 0.702098848537444 \tabularnewline
T-STAT & -2.27543931005217 \tabularnewline
p-value & 0.0307310213465471 \tabularnewline
Lambda & 2.59758331950446 \tabularnewline
\hline
\end{tabular}
%Source: https://freestatistics.org/blog/index.php?pk=78048&T=3

[TABLE]
[ROW][C]Regression: ln S.E.(k) = alpha + beta * ln Mean(k)[/C][/ROW]
[ROW][C]alpha[/C][C]10.8291231333678[/C][/ROW]
[ROW][C]beta[/C][C]-1.59758331950446[/C][/ROW]
[ROW][C]S.D.[/C][C]0.702098848537444[/C][/ROW]
[ROW][C]T-STAT[/C][C]-2.27543931005217[/C][/ROW]
[ROW][C]p-value[/C][C]0.0307310213465471[/C][/ROW]
[ROW][C]Lambda[/C][C]2.59758331950446[/C][/ROW]
[/TABLE]
Source: https://freestatistics.org/blog/index.php?pk=78048&T=3

Globally Unique Identifier (entire table): ba.freestatistics.org/blog/index.php?pk=78048&T=3

As an alternative you can also use a QR Code:  

The GUIDs for individual cells are displayed in the table below:

Regression: ln S.E.(k) = alpha + beta * ln Mean(k)
alpha10.8291231333678
beta-1.59758331950446
S.D.0.702098848537444
T-STAT-2.27543931005217
p-value0.0307310213465471
Lambda2.59758331950446


Parameters (Session):
par1 = 4 ;
Parameters (R input):
par1 = 4 ;
R code (references can be found in the software module):
par1 <- as.numeric(par1)
(n <- length(x))
(np <- floor(n / par1))
arr <- array(NA,dim=c(par1,np))
j <- 0
k <- 1
for (i in 1:(np*par1))
{
j = j + 1
arr[j,k] <- x[i]
if (j == par1) {
j = 0
k=k+1
}
}
arr
arr.mean <- array(NA,dim=np)
arr.sd <- array(NA,dim=np)
arr.range <- array(NA,dim=np)
for (j in 1:np)
{
arr.mean[j] <- mean(arr[,j],na.rm=TRUE)
arr.sd[j] <- sd(arr[,j],na.rm=TRUE)
arr.range[j] <- max(arr[,j],na.rm=TRUE) - min(arr[,j],na.rm=TRUE)
}
arr.mean
arr.sd
arr.range
(lm1 <- lm(arr.sd~arr.mean))
(lnlm1 <- lm(log(arr.sd)~log(arr.mean)))
(lm2 <- lm(arr.range~arr.mean))
bitmap(file='test1.png')
plot(arr.mean,arr.sd,main='Standard Deviation-Mean Plot',xlab='mean',ylab='standard deviation')
dev.off()
bitmap(file='test2.png')
plot(arr.mean,arr.range,main='Range-Mean Plot',xlab='mean',ylab='range')
dev.off()
load(file='createtable')
a<-table.start()
a<-table.row.start(a)
a<-table.element(a,'Standard Deviation-Mean Plot',4,TRUE)
a<-table.row.end(a)
a<-table.row.start(a)
a<-table.element(a,'Section',header=TRUE)
a<-table.element(a,'Mean',header=TRUE)
a<-table.element(a,'Standard Deviation',header=TRUE)
a<-table.element(a,'Range',header=TRUE)
a<-table.row.end(a)
for (j in 1:np) {
a<-table.row.start(a)
a<-table.element(a,j,header=TRUE)
a<-table.element(a,arr.mean[j])
a<-table.element(a,arr.sd[j] )
a<-table.element(a,arr.range[j] )
a<-table.row.end(a)
}
a<-table.end(a)
table.save(a,file='mytable.tab')
a<-table.start()
a<-table.row.start(a)
a<-table.element(a,'Regression: S.E.(k) = alpha + beta * Mean(k)',2,TRUE)
a<-table.row.end(a)
a<-table.row.start(a)
a<-table.element(a,'alpha',header=TRUE)
a<-table.element(a,lm1$coefficients[[1]])
a<-table.row.end(a)
a<-table.row.start(a)
a<-table.element(a,'beta',header=TRUE)
a<-table.element(a,lm1$coefficients[[2]])
a<-table.row.end(a)
a<-table.row.start(a)
a<-table.element(a,'S.D.',header=TRUE)
a<-table.element(a,summary(lm1)$coefficients[2,2])
a<-table.row.end(a)
a<-table.row.start(a)
a<-table.element(a,'T-STAT',header=TRUE)
a<-table.element(a,summary(lm1)$coefficients[2,3])
a<-table.row.end(a)
a<-table.row.start(a)
a<-table.element(a,'p-value',header=TRUE)
a<-table.element(a,summary(lm1)$coefficients[2,4])
a<-table.row.end(a)
a<-table.end(a)
table.save(a,file='mytable1.tab')
a<-table.start()
a<-table.row.start(a)
a<-table.element(a,'Regression: ln S.E.(k) = alpha + beta * ln Mean(k)',2,TRUE)
a<-table.row.end(a)
a<-table.row.start(a)
a<-table.element(a,'alpha',header=TRUE)
a<-table.element(a,lnlm1$coefficients[[1]])
a<-table.row.end(a)
a<-table.row.start(a)
a<-table.element(a,'beta',header=TRUE)
a<-table.element(a,lnlm1$coefficients[[2]])
a<-table.row.end(a)
a<-table.row.start(a)
a<-table.element(a,'S.D.',header=TRUE)
a<-table.element(a,summary(lnlm1)$coefficients[2,2])
a<-table.row.end(a)
a<-table.row.start(a)
a<-table.element(a,'T-STAT',header=TRUE)
a<-table.element(a,summary(lnlm1)$coefficients[2,3])
a<-table.row.end(a)
a<-table.row.start(a)
a<-table.element(a,'p-value',header=TRUE)
a<-table.element(a,summary(lnlm1)$coefficients[2,4])
a<-table.row.end(a)
a<-table.row.start(a)
a<-table.element(a,'Lambda',header=TRUE)
a<-table.element(a,1-lnlm1$coefficients[[2]])
a<-table.row.end(a)
a<-table.end(a)
table.save(a,file='mytable2.tab')