Free Statistics

of Irreproducible Research!

Author's title

Author*Unverified author*
R Software Modulerwasp_smp.wasp
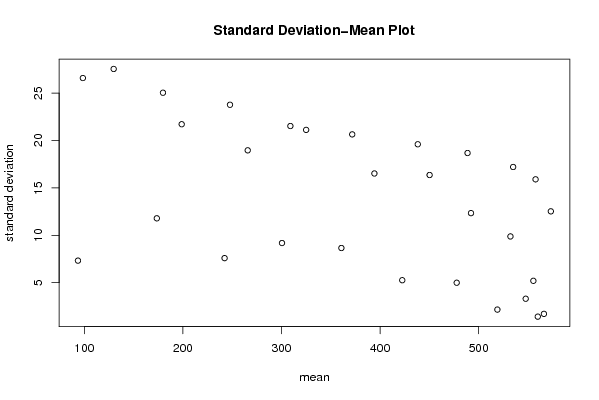
Title produced by softwareStandard Deviation-Mean Plot
Date of computationTue, 20 Jul 2010 11:44:27 +0000
Cite this page as followsStatistical Computations at FreeStatistics.org, Office for Research Development and Education, URL https://freestatistics.org/blog/index.php?v=date/2010/Jul/20/t1279626263gbq5oqdmjhickaj.htm/, Retrieved Sat, 04 May 2024 03:26:43 +0000
Statistical Computations at FreeStatistics.org, Office for Research Development and Education, URL https://freestatistics.org/blog/index.php?pk=78045, Retrieved Sat, 04 May 2024 03:26:43 +0000
QR Codes:

Original text written by user:
IsPrivate?No (this computation is public)
User-defined keywordsVanhille Olivier
Estimated Impact189
Family? (F = Feedback message, R = changed R code, M = changed R Module, P = changed Parameters, D = changed Data)
-       [Standard Deviation-Mean Plot] [tijdreeks 1 - sta...] [2010-07-20 11:44:27] [ddb1c76c3acba5bf82e5ed3b5a08f68d] [Current]
Feedback Forum

Post a new message
Dataseries X:
568
567
566
564
584
583
568
558
559
559
560
562
563
552
552
555
575
567
548
541
544
546
551
550
546
532
523
528
555
543
525
517
519
521
520
516
509
494
484
482
508
500
480
467
471
482
481
477
471
455
441
434
459
448
432
414
415
423
425
427
415
399
386
377
397
379
361
350
348
363
367
365
354
327
312
307
335
317
298
286
288
303
310
301
293
264
255
251
279
253
233
226
232
245
250
242
230
196
188
181
212
186
166
155
157
173
182
182
168
131
114
106
134
103
83
74
83
96
95
100


Summary of computational transaction
Raw Inputview raw input (R code)
Raw Outputview raw output of R engine
Computing time2 seconds
R Server'George Udny Yule' @ 72.249.76.132

\begin{tabular}{lllllllll}
\hline
Summary of computational transaction \tabularnewline
Raw Input & view raw input (R code)  \tabularnewline
Raw Output & view raw output of R engine  \tabularnewline
Computing time & 2 seconds \tabularnewline
R Server & 'George Udny Yule' @ 72.249.76.132 \tabularnewline
\hline
\end{tabular}
%Source: https://freestatistics.org/blog/index.php?pk=78045&T=0

[TABLE]
[ROW][C]Summary of computational transaction[/C][/ROW]
[ROW][C]Raw Input[/C][C]view raw input (R code) [/C][/ROW]
[ROW][C]Raw Output[/C][C]view raw output of R engine [/C][/ROW]
[ROW][C]Computing time[/C][C]2 seconds[/C][/ROW]
[ROW][C]R Server[/C][C]'George Udny Yule' @ 72.249.76.132[/C][/ROW]
[/TABLE]
Source: https://freestatistics.org/blog/index.php?pk=78045&T=0

Globally Unique Identifier (entire table): ba.freestatistics.org/blog/index.php?pk=78045&T=0

As an alternative you can also use a QR Code:  

The GUIDs for individual cells are displayed in the table below:

Summary of computational transaction
Raw Inputview raw input (R code)
Raw Outputview raw output of R engine
Computing time2 seconds
R Server'George Udny Yule' @ 72.249.76.132


Standard Deviation-Mean Plot
SectionMeanStandard DeviationRange
1566.251.707825127659934
2573.2512.526638282742426
35601.414213562373103
4555.55.1961524227066311
5557.7515.903353943953734
6547.753.304037933599837
7532.259.878427675158323
853517.204650534085338
95192.160246899469295
10492.2512.338962679253127
11488.7518.679311193581741
12477.754.9916597106239811
13450.2516.357974609753337
14438.2519.602295783912745
15422.55.2599112793531712
16394.2516.520189667999238
17371.7520.645822822062647
18360.758.6554414483991919
1932521.118712081942947
2030921.525179054617349
21300.59.1833182093039422
22265.7518.962682651284742
23247.7523.767975653527353
24242.257.5883682918881418
25198.7521.715969546242549
26179.7525.038303989421257
27173.511.789826122551625
28129.7527.548442182211862
2998.526.589471600616760
3093.57.3257536586119717

\begin{tabular}{lllllllll}
\hline
Standard Deviation-Mean Plot \tabularnewline
Section & Mean & Standard Deviation & Range \tabularnewline
1 & 566.25 & 1.70782512765993 & 4 \tabularnewline
2 & 573.25 & 12.5266382827424 & 26 \tabularnewline
3 & 560 & 1.41421356237310 & 3 \tabularnewline
4 & 555.5 & 5.19615242270663 & 11 \tabularnewline
5 & 557.75 & 15.9033539439537 & 34 \tabularnewline
6 & 547.75 & 3.30403793359983 & 7 \tabularnewline
7 & 532.25 & 9.8784276751583 & 23 \tabularnewline
8 & 535 & 17.2046505340853 & 38 \tabularnewline
9 & 519 & 2.16024689946929 & 5 \tabularnewline
10 & 492.25 & 12.3389626792531 & 27 \tabularnewline
11 & 488.75 & 18.6793111935817 & 41 \tabularnewline
12 & 477.75 & 4.99165971062398 & 11 \tabularnewline
13 & 450.25 & 16.3579746097533 & 37 \tabularnewline
14 & 438.25 & 19.6022957839127 & 45 \tabularnewline
15 & 422.5 & 5.25991127935317 & 12 \tabularnewline
16 & 394.25 & 16.5201896679992 & 38 \tabularnewline
17 & 371.75 & 20.6458228220626 & 47 \tabularnewline
18 & 360.75 & 8.65544144839919 & 19 \tabularnewline
19 & 325 & 21.1187120819429 & 47 \tabularnewline
20 & 309 & 21.5251790546173 & 49 \tabularnewline
21 & 300.5 & 9.18331820930394 & 22 \tabularnewline
22 & 265.75 & 18.9626826512847 & 42 \tabularnewline
23 & 247.75 & 23.7679756535273 & 53 \tabularnewline
24 & 242.25 & 7.58836829188814 & 18 \tabularnewline
25 & 198.75 & 21.7159695462425 & 49 \tabularnewline
26 & 179.75 & 25.0383039894212 & 57 \tabularnewline
27 & 173.5 & 11.7898261225516 & 25 \tabularnewline
28 & 129.75 & 27.5484421822118 & 62 \tabularnewline
29 & 98.5 & 26.5894716006167 & 60 \tabularnewline
30 & 93.5 & 7.32575365861197 & 17 \tabularnewline
\hline
\end{tabular}
%Source: https://freestatistics.org/blog/index.php?pk=78045&T=1

[TABLE]
[ROW][C]Standard Deviation-Mean Plot[/C][/ROW]
[ROW][C]Section[/C][C]Mean[/C][C]Standard Deviation[/C][C]Range[/C][/ROW]
[ROW][C]1[/C][C]566.25[/C][C]1.70782512765993[/C][C]4[/C][/ROW]
[ROW][C]2[/C][C]573.25[/C][C]12.5266382827424[/C][C]26[/C][/ROW]
[ROW][C]3[/C][C]560[/C][C]1.41421356237310[/C][C]3[/C][/ROW]
[ROW][C]4[/C][C]555.5[/C][C]5.19615242270663[/C][C]11[/C][/ROW]
[ROW][C]5[/C][C]557.75[/C][C]15.9033539439537[/C][C]34[/C][/ROW]
[ROW][C]6[/C][C]547.75[/C][C]3.30403793359983[/C][C]7[/C][/ROW]
[ROW][C]7[/C][C]532.25[/C][C]9.8784276751583[/C][C]23[/C][/ROW]
[ROW][C]8[/C][C]535[/C][C]17.2046505340853[/C][C]38[/C][/ROW]
[ROW][C]9[/C][C]519[/C][C]2.16024689946929[/C][C]5[/C][/ROW]
[ROW][C]10[/C][C]492.25[/C][C]12.3389626792531[/C][C]27[/C][/ROW]
[ROW][C]11[/C][C]488.75[/C][C]18.6793111935817[/C][C]41[/C][/ROW]
[ROW][C]12[/C][C]477.75[/C][C]4.99165971062398[/C][C]11[/C][/ROW]
[ROW][C]13[/C][C]450.25[/C][C]16.3579746097533[/C][C]37[/C][/ROW]
[ROW][C]14[/C][C]438.25[/C][C]19.6022957839127[/C][C]45[/C][/ROW]
[ROW][C]15[/C][C]422.5[/C][C]5.25991127935317[/C][C]12[/C][/ROW]
[ROW][C]16[/C][C]394.25[/C][C]16.5201896679992[/C][C]38[/C][/ROW]
[ROW][C]17[/C][C]371.75[/C][C]20.6458228220626[/C][C]47[/C][/ROW]
[ROW][C]18[/C][C]360.75[/C][C]8.65544144839919[/C][C]19[/C][/ROW]
[ROW][C]19[/C][C]325[/C][C]21.1187120819429[/C][C]47[/C][/ROW]
[ROW][C]20[/C][C]309[/C][C]21.5251790546173[/C][C]49[/C][/ROW]
[ROW][C]21[/C][C]300.5[/C][C]9.18331820930394[/C][C]22[/C][/ROW]
[ROW][C]22[/C][C]265.75[/C][C]18.9626826512847[/C][C]42[/C][/ROW]
[ROW][C]23[/C][C]247.75[/C][C]23.7679756535273[/C][C]53[/C][/ROW]
[ROW][C]24[/C][C]242.25[/C][C]7.58836829188814[/C][C]18[/C][/ROW]
[ROW][C]25[/C][C]198.75[/C][C]21.7159695462425[/C][C]49[/C][/ROW]
[ROW][C]26[/C][C]179.75[/C][C]25.0383039894212[/C][C]57[/C][/ROW]
[ROW][C]27[/C][C]173.5[/C][C]11.7898261225516[/C][C]25[/C][/ROW]
[ROW][C]28[/C][C]129.75[/C][C]27.5484421822118[/C][C]62[/C][/ROW]
[ROW][C]29[/C][C]98.5[/C][C]26.5894716006167[/C][C]60[/C][/ROW]
[ROW][C]30[/C][C]93.5[/C][C]7.32575365861197[/C][C]17[/C][/ROW]
[/TABLE]
Source: https://freestatistics.org/blog/index.php?pk=78045&T=1

Globally Unique Identifier (entire table): ba.freestatistics.org/blog/index.php?pk=78045&T=1

As an alternative you can also use a QR Code:  

The GUIDs for individual cells are displayed in the table below:

Standard Deviation-Mean Plot
SectionMeanStandard DeviationRange
1566.251.707825127659934
2573.2512.526638282742426
35601.414213562373103
4555.55.1961524227066311
5557.7515.903353943953734
6547.753.304037933599837
7532.259.878427675158323
853517.204650534085338
95192.160246899469295
10492.2512.338962679253127
11488.7518.679311193581741
12477.754.9916597106239811
13450.2516.357974609753337
14438.2519.602295783912745
15422.55.2599112793531712
16394.2516.520189667999238
17371.7520.645822822062647
18360.758.6554414483991919
1932521.118712081942947
2030921.525179054617349
21300.59.1833182093039422
22265.7518.962682651284742
23247.7523.767975653527353
24242.257.5883682918881418
25198.7521.715969546242549
26179.7525.038303989421257
27173.511.789826122551625
28129.7527.548442182211862
2998.526.589471600616760
3093.57.3257536586119717


Regression: S.E.(k) = alpha + beta * Mean(k)
alpha24.3515533484539
beta-0.0277056680474883
S.D.0.00806211730842057
T-STAT-3.4365250451703
p-value0.00185862657440863

\begin{tabular}{lllllllll}
\hline
Regression: S.E.(k) = alpha + beta * Mean(k) \tabularnewline
alpha & 24.3515533484539 \tabularnewline
beta & -0.0277056680474883 \tabularnewline
S.D. & 0.00806211730842057 \tabularnewline
T-STAT & -3.4365250451703 \tabularnewline
p-value & 0.00185862657440863 \tabularnewline
\hline
\end{tabular}
%Source: https://freestatistics.org/blog/index.php?pk=78045&T=2

[TABLE]
[ROW][C]Regression: S.E.(k) = alpha + beta * Mean(k)[/C][/ROW]
[ROW][C]alpha[/C][C]24.3515533484539[/C][/ROW]
[ROW][C]beta[/C][C]-0.0277056680474883[/C][/ROW]
[ROW][C]S.D.[/C][C]0.00806211730842057[/C][/ROW]
[ROW][C]T-STAT[/C][C]-3.4365250451703[/C][/ROW]
[ROW][C]p-value[/C][C]0.00185862657440863[/C][/ROW]
[/TABLE]
Source: https://freestatistics.org/blog/index.php?pk=78045&T=2

Globally Unique Identifier (entire table): ba.freestatistics.org/blog/index.php?pk=78045&T=2

As an alternative you can also use a QR Code:  

The GUIDs for individual cells are displayed in the table below:

Regression: S.E.(k) = alpha + beta * Mean(k)
alpha24.3515533484539
beta-0.0277056680474883
S.D.0.00806211730842057
T-STAT-3.4365250451703
p-value0.00185862657440863


Regression: ln S.E.(k) = alpha + beta * ln Mean(k)
alpha6.42450345077569
beta-0.695149180323769
S.D.0.263952931541968
T-STAT-2.63361037993716
p-value0.0136019657463000
Lambda1.69514918032377

\begin{tabular}{lllllllll}
\hline
Regression: ln S.E.(k) = alpha + beta * ln Mean(k) \tabularnewline
alpha & 6.42450345077569 \tabularnewline
beta & -0.695149180323769 \tabularnewline
S.D. & 0.263952931541968 \tabularnewline
T-STAT & -2.63361037993716 \tabularnewline
p-value & 0.0136019657463000 \tabularnewline
Lambda & 1.69514918032377 \tabularnewline
\hline
\end{tabular}
%Source: https://freestatistics.org/blog/index.php?pk=78045&T=3

[TABLE]
[ROW][C]Regression: ln S.E.(k) = alpha + beta * ln Mean(k)[/C][/ROW]
[ROW][C]alpha[/C][C]6.42450345077569[/C][/ROW]
[ROW][C]beta[/C][C]-0.695149180323769[/C][/ROW]
[ROW][C]S.D.[/C][C]0.263952931541968[/C][/ROW]
[ROW][C]T-STAT[/C][C]-2.63361037993716[/C][/ROW]
[ROW][C]p-value[/C][C]0.0136019657463000[/C][/ROW]
[ROW][C]Lambda[/C][C]1.69514918032377[/C][/ROW]
[/TABLE]
Source: https://freestatistics.org/blog/index.php?pk=78045&T=3

Globally Unique Identifier (entire table): ba.freestatistics.org/blog/index.php?pk=78045&T=3

As an alternative you can also use a QR Code:  

The GUIDs for individual cells are displayed in the table below:

Regression: ln S.E.(k) = alpha + beta * ln Mean(k)
alpha6.42450345077569
beta-0.695149180323769
S.D.0.263952931541968
T-STAT-2.63361037993716
p-value0.0136019657463000
Lambda1.69514918032377


Parameters (Session):
par1 = 4 ;
Parameters (R input):
par1 = 4 ;
R code (references can be found in the software module):
par1 <- as.numeric(par1)
(n <- length(x))
(np <- floor(n / par1))
arr <- array(NA,dim=c(par1,np))
j <- 0
k <- 1
for (i in 1:(np*par1))
{
j = j + 1
arr[j,k] <- x[i]
if (j == par1) {
j = 0
k=k+1
}
}
arr
arr.mean <- array(NA,dim=np)
arr.sd <- array(NA,dim=np)
arr.range <- array(NA,dim=np)
for (j in 1:np)
{
arr.mean[j] <- mean(arr[,j],na.rm=TRUE)
arr.sd[j] <- sd(arr[,j],na.rm=TRUE)
arr.range[j] <- max(arr[,j],na.rm=TRUE) - min(arr[,j],na.rm=TRUE)
}
arr.mean
arr.sd
arr.range
(lm1 <- lm(arr.sd~arr.mean))
(lnlm1 <- lm(log(arr.sd)~log(arr.mean)))
(lm2 <- lm(arr.range~arr.mean))
bitmap(file='test1.png')
plot(arr.mean,arr.sd,main='Standard Deviation-Mean Plot',xlab='mean',ylab='standard deviation')
dev.off()
bitmap(file='test2.png')
plot(arr.mean,arr.range,main='Range-Mean Plot',xlab='mean',ylab='range')
dev.off()
load(file='createtable')
a<-table.start()
a<-table.row.start(a)
a<-table.element(a,'Standard Deviation-Mean Plot',4,TRUE)
a<-table.row.end(a)
a<-table.row.start(a)
a<-table.element(a,'Section',header=TRUE)
a<-table.element(a,'Mean',header=TRUE)
a<-table.element(a,'Standard Deviation',header=TRUE)
a<-table.element(a,'Range',header=TRUE)
a<-table.row.end(a)
for (j in 1:np) {
a<-table.row.start(a)
a<-table.element(a,j,header=TRUE)
a<-table.element(a,arr.mean[j])
a<-table.element(a,arr.sd[j] )
a<-table.element(a,arr.range[j] )
a<-table.row.end(a)
}
a<-table.end(a)
table.save(a,file='mytable.tab')
a<-table.start()
a<-table.row.start(a)
a<-table.element(a,'Regression: S.E.(k) = alpha + beta * Mean(k)',2,TRUE)
a<-table.row.end(a)
a<-table.row.start(a)
a<-table.element(a,'alpha',header=TRUE)
a<-table.element(a,lm1$coefficients[[1]])
a<-table.row.end(a)
a<-table.row.start(a)
a<-table.element(a,'beta',header=TRUE)
a<-table.element(a,lm1$coefficients[[2]])
a<-table.row.end(a)
a<-table.row.start(a)
a<-table.element(a,'S.D.',header=TRUE)
a<-table.element(a,summary(lm1)$coefficients[2,2])
a<-table.row.end(a)
a<-table.row.start(a)
a<-table.element(a,'T-STAT',header=TRUE)
a<-table.element(a,summary(lm1)$coefficients[2,3])
a<-table.row.end(a)
a<-table.row.start(a)
a<-table.element(a,'p-value',header=TRUE)
a<-table.element(a,summary(lm1)$coefficients[2,4])
a<-table.row.end(a)
a<-table.end(a)
table.save(a,file='mytable1.tab')
a<-table.start()
a<-table.row.start(a)
a<-table.element(a,'Regression: ln S.E.(k) = alpha + beta * ln Mean(k)',2,TRUE)
a<-table.row.end(a)
a<-table.row.start(a)
a<-table.element(a,'alpha',header=TRUE)
a<-table.element(a,lnlm1$coefficients[[1]])
a<-table.row.end(a)
a<-table.row.start(a)
a<-table.element(a,'beta',header=TRUE)
a<-table.element(a,lnlm1$coefficients[[2]])
a<-table.row.end(a)
a<-table.row.start(a)
a<-table.element(a,'S.D.',header=TRUE)
a<-table.element(a,summary(lnlm1)$coefficients[2,2])
a<-table.row.end(a)
a<-table.row.start(a)
a<-table.element(a,'T-STAT',header=TRUE)
a<-table.element(a,summary(lnlm1)$coefficients[2,3])
a<-table.row.end(a)
a<-table.row.start(a)
a<-table.element(a,'p-value',header=TRUE)
a<-table.element(a,summary(lnlm1)$coefficients[2,4])
a<-table.row.end(a)
a<-table.row.start(a)
a<-table.element(a,'Lambda',header=TRUE)
a<-table.element(a,1-lnlm1$coefficients[[2]])
a<-table.row.end(a)
a<-table.end(a)
table.save(a,file='mytable2.tab')