Free Statistics

of Irreproducible Research!

Author's title

Author*Unverified author*
R Software Modulerwasp_autocorrelation.wasp
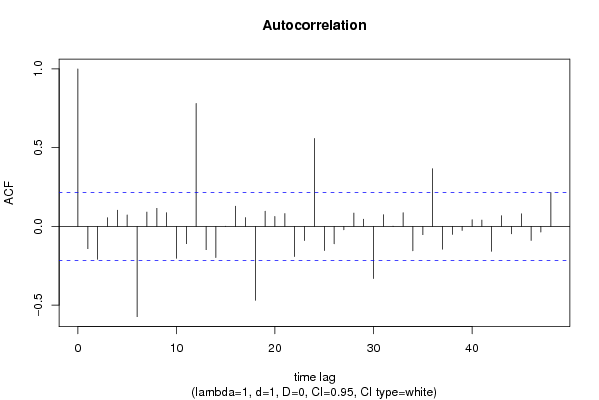
Title produced by software(Partial) Autocorrelation Function
Date of computationTue, 20 Jul 2010 11:08:30 +0000
Cite this page as followsStatistical Computations at FreeStatistics.org, Office for Research Development and Education, URL https://freestatistics.org/blog/index.php?v=date/2010/Jul/20/t1279624214cju4ve5er68ix7y.htm/, Retrieved Fri, 03 May 2024 21:09:26 +0000
Statistical Computations at FreeStatistics.org, Office for Research Development and Education, URL https://freestatistics.org/blog/index.php?pk=78039, Retrieved Fri, 03 May 2024 21:09:26 +0000
QR Codes:

Original text written by user:
IsPrivate?No (this computation is public)
User-defined keywordsVan de Walle Mathias
Estimated Impact199
Family? (F = Feedback message, R = changed R code, M = changed R Module, P = changed Parameters, D = changed Data)
-       [(Partial) Autocorrelation Function] [tijdreeks 1 - sta...] [2010-07-20 11:08:30] [589929edeb20bd59f78e9be1ffd92c80] [Current]
Feedback Forum

Post a new message
Dataseries X:
239
238
237
235
233
232
233
235
236
236
237
239
238
237
244
230
237
244
239
240
230
228
231
228
225
227
238
214
222
233
228
218
203
209
207
203
195
199
207
182
181
189
186
174
153
158
153
147
143
156
168
142
146
150
145
133
111
115
109
105
96
112
127
107
116
125
120
107
86
87
79
83
75
89
104
86
98
98
85
74
49
54
47
56


Summary of computational transaction
Raw Inputview raw input (R code)
Raw Outputview raw output of R engine
Computing time2 seconds
R Server'Sir Ronald Aylmer Fisher' @ 193.190.124.24

\begin{tabular}{lllllllll}
\hline
Summary of computational transaction \tabularnewline
Raw Input & view raw input (R code)  \tabularnewline
Raw Output & view raw output of R engine  \tabularnewline
Computing time & 2 seconds \tabularnewline
R Server & 'Sir Ronald Aylmer Fisher' @ 193.190.124.24 \tabularnewline
\hline
\end{tabular}
%Source: https://freestatistics.org/blog/index.php?pk=78039&T=0

[TABLE]
[ROW][C]Summary of computational transaction[/C][/ROW]
[ROW][C]Raw Input[/C][C]view raw input (R code) [/C][/ROW]
[ROW][C]Raw Output[/C][C]view raw output of R engine [/C][/ROW]
[ROW][C]Computing time[/C][C]2 seconds[/C][/ROW]
[ROW][C]R Server[/C][C]'Sir Ronald Aylmer Fisher' @ 193.190.124.24[/C][/ROW]
[/TABLE]
Source: https://freestatistics.org/blog/index.php?pk=78039&T=0

Globally Unique Identifier (entire table): ba.freestatistics.org/blog/index.php?pk=78039&T=0

As an alternative you can also use a QR Code:  

The GUIDs for individual cells are displayed in the table below:

Summary of computational transaction
Raw Inputview raw input (R code)
Raw Outputview raw output of R engine
Computing time2 seconds
R Server'Sir Ronald Aylmer Fisher' @ 193.190.124.24


Autocorrelation Function
Time lag kACF(k)T-STATP-value
1-0.141208-1.28650.100928
2-0.208505-1.89960.030481
30.0546730.49810.309867
40.1029530.93790.175498
50.0720190.65610.256779
6-0.573245-5.22251e-06
70.0908930.82810.205001
80.1146981.0450.149539
90.0868340.79110.215572
10-0.20274-1.84710.034152
11-0.109747-0.99980.160146
120.7805687.11130
13-0.147593-1.34460.091202
14-0.197977-1.80370.037457
156.9e-056e-040.499751
160.1278261.16450.123769
170.0559180.50940.305898
18-0.468891-4.27182.6e-05
190.0959620.87430.19225
200.0626590.57090.28482
210.0813370.7410.230388
22-0.190853-1.73880.042893
23-0.089715-0.81730.208035
240.5584965.08811e-06
25-0.153811-1.40130.082429
26-0.11051-1.00680.15848
27-0.021568-0.19650.422353
280.0845460.77020.22167
290.0457440.41680.338968
30-0.330834-3.0140.001709
310.0744720.67850.249678
320.0011640.01060.495783
330.0872980.79530.214347
34-0.154984-1.4120.080848
35-0.052346-0.47690.317344
360.3663243.33740.000634
37-0.144637-1.31770.095614
38-0.050864-0.46340.322147
39-0.025449-0.23190.408611
400.0424820.3870.349862
410.0399030.36350.358564
42-0.158357-1.44270.076434
430.0677860.61760.269278
44-0.046909-0.42740.335112
450.0798220.72720.234571
46-0.088937-0.81030.210054
47-0.035291-0.32150.374315
480.2152611.96110.026609

\begin{tabular}{lllllllll}
\hline
Autocorrelation Function \tabularnewline
Time lag k & ACF(k) & T-STAT & P-value \tabularnewline
1 & -0.141208 & -1.2865 & 0.100928 \tabularnewline
2 & -0.208505 & -1.8996 & 0.030481 \tabularnewline
3 & 0.054673 & 0.4981 & 0.309867 \tabularnewline
4 & 0.102953 & 0.9379 & 0.175498 \tabularnewline
5 & 0.072019 & 0.6561 & 0.256779 \tabularnewline
6 & -0.573245 & -5.2225 & 1e-06 \tabularnewline
7 & 0.090893 & 0.8281 & 0.205001 \tabularnewline
8 & 0.114698 & 1.045 & 0.149539 \tabularnewline
9 & 0.086834 & 0.7911 & 0.215572 \tabularnewline
10 & -0.20274 & -1.8471 & 0.034152 \tabularnewline
11 & -0.109747 & -0.9998 & 0.160146 \tabularnewline
12 & 0.780568 & 7.1113 & 0 \tabularnewline
13 & -0.147593 & -1.3446 & 0.091202 \tabularnewline
14 & -0.197977 & -1.8037 & 0.037457 \tabularnewline
15 & 6.9e-05 & 6e-04 & 0.499751 \tabularnewline
16 & 0.127826 & 1.1645 & 0.123769 \tabularnewline
17 & 0.055918 & 0.5094 & 0.305898 \tabularnewline
18 & -0.468891 & -4.2718 & 2.6e-05 \tabularnewline
19 & 0.095962 & 0.8743 & 0.19225 \tabularnewline
20 & 0.062659 & 0.5709 & 0.28482 \tabularnewline
21 & 0.081337 & 0.741 & 0.230388 \tabularnewline
22 & -0.190853 & -1.7388 & 0.042893 \tabularnewline
23 & -0.089715 & -0.8173 & 0.208035 \tabularnewline
24 & 0.558496 & 5.0881 & 1e-06 \tabularnewline
25 & -0.153811 & -1.4013 & 0.082429 \tabularnewline
26 & -0.11051 & -1.0068 & 0.15848 \tabularnewline
27 & -0.021568 & -0.1965 & 0.422353 \tabularnewline
28 & 0.084546 & 0.7702 & 0.22167 \tabularnewline
29 & 0.045744 & 0.4168 & 0.338968 \tabularnewline
30 & -0.330834 & -3.014 & 0.001709 \tabularnewline
31 & 0.074472 & 0.6785 & 0.249678 \tabularnewline
32 & 0.001164 & 0.0106 & 0.495783 \tabularnewline
33 & 0.087298 & 0.7953 & 0.214347 \tabularnewline
34 & -0.154984 & -1.412 & 0.080848 \tabularnewline
35 & -0.052346 & -0.4769 & 0.317344 \tabularnewline
36 & 0.366324 & 3.3374 & 0.000634 \tabularnewline
37 & -0.144637 & -1.3177 & 0.095614 \tabularnewline
38 & -0.050864 & -0.4634 & 0.322147 \tabularnewline
39 & -0.025449 & -0.2319 & 0.408611 \tabularnewline
40 & 0.042482 & 0.387 & 0.349862 \tabularnewline
41 & 0.039903 & 0.3635 & 0.358564 \tabularnewline
42 & -0.158357 & -1.4427 & 0.076434 \tabularnewline
43 & 0.067786 & 0.6176 & 0.269278 \tabularnewline
44 & -0.046909 & -0.4274 & 0.335112 \tabularnewline
45 & 0.079822 & 0.7272 & 0.234571 \tabularnewline
46 & -0.088937 & -0.8103 & 0.210054 \tabularnewline
47 & -0.035291 & -0.3215 & 0.374315 \tabularnewline
48 & 0.215261 & 1.9611 & 0.026609 \tabularnewline
\hline
\end{tabular}
%Source: https://freestatistics.org/blog/index.php?pk=78039&T=1

[TABLE]
[ROW][C]Autocorrelation Function[/C][/ROW]
[ROW][C]Time lag k[/C][C]ACF(k)[/C][C]T-STAT[/C][C]P-value[/C][/ROW]
[ROW][C]1[/C][C]-0.141208[/C][C]-1.2865[/C][C]0.100928[/C][/ROW]
[ROW][C]2[/C][C]-0.208505[/C][C]-1.8996[/C][C]0.030481[/C][/ROW]
[ROW][C]3[/C][C]0.054673[/C][C]0.4981[/C][C]0.309867[/C][/ROW]
[ROW][C]4[/C][C]0.102953[/C][C]0.9379[/C][C]0.175498[/C][/ROW]
[ROW][C]5[/C][C]0.072019[/C][C]0.6561[/C][C]0.256779[/C][/ROW]
[ROW][C]6[/C][C]-0.573245[/C][C]-5.2225[/C][C]1e-06[/C][/ROW]
[ROW][C]7[/C][C]0.090893[/C][C]0.8281[/C][C]0.205001[/C][/ROW]
[ROW][C]8[/C][C]0.114698[/C][C]1.045[/C][C]0.149539[/C][/ROW]
[ROW][C]9[/C][C]0.086834[/C][C]0.7911[/C][C]0.215572[/C][/ROW]
[ROW][C]10[/C][C]-0.20274[/C][C]-1.8471[/C][C]0.034152[/C][/ROW]
[ROW][C]11[/C][C]-0.109747[/C][C]-0.9998[/C][C]0.160146[/C][/ROW]
[ROW][C]12[/C][C]0.780568[/C][C]7.1113[/C][C]0[/C][/ROW]
[ROW][C]13[/C][C]-0.147593[/C][C]-1.3446[/C][C]0.091202[/C][/ROW]
[ROW][C]14[/C][C]-0.197977[/C][C]-1.8037[/C][C]0.037457[/C][/ROW]
[ROW][C]15[/C][C]6.9e-05[/C][C]6e-04[/C][C]0.499751[/C][/ROW]
[ROW][C]16[/C][C]0.127826[/C][C]1.1645[/C][C]0.123769[/C][/ROW]
[ROW][C]17[/C][C]0.055918[/C][C]0.5094[/C][C]0.305898[/C][/ROW]
[ROW][C]18[/C][C]-0.468891[/C][C]-4.2718[/C][C]2.6e-05[/C][/ROW]
[ROW][C]19[/C][C]0.095962[/C][C]0.8743[/C][C]0.19225[/C][/ROW]
[ROW][C]20[/C][C]0.062659[/C][C]0.5709[/C][C]0.28482[/C][/ROW]
[ROW][C]21[/C][C]0.081337[/C][C]0.741[/C][C]0.230388[/C][/ROW]
[ROW][C]22[/C][C]-0.190853[/C][C]-1.7388[/C][C]0.042893[/C][/ROW]
[ROW][C]23[/C][C]-0.089715[/C][C]-0.8173[/C][C]0.208035[/C][/ROW]
[ROW][C]24[/C][C]0.558496[/C][C]5.0881[/C][C]1e-06[/C][/ROW]
[ROW][C]25[/C][C]-0.153811[/C][C]-1.4013[/C][C]0.082429[/C][/ROW]
[ROW][C]26[/C][C]-0.11051[/C][C]-1.0068[/C][C]0.15848[/C][/ROW]
[ROW][C]27[/C][C]-0.021568[/C][C]-0.1965[/C][C]0.422353[/C][/ROW]
[ROW][C]28[/C][C]0.084546[/C][C]0.7702[/C][C]0.22167[/C][/ROW]
[ROW][C]29[/C][C]0.045744[/C][C]0.4168[/C][C]0.338968[/C][/ROW]
[ROW][C]30[/C][C]-0.330834[/C][C]-3.014[/C][C]0.001709[/C][/ROW]
[ROW][C]31[/C][C]0.074472[/C][C]0.6785[/C][C]0.249678[/C][/ROW]
[ROW][C]32[/C][C]0.001164[/C][C]0.0106[/C][C]0.495783[/C][/ROW]
[ROW][C]33[/C][C]0.087298[/C][C]0.7953[/C][C]0.214347[/C][/ROW]
[ROW][C]34[/C][C]-0.154984[/C][C]-1.412[/C][C]0.080848[/C][/ROW]
[ROW][C]35[/C][C]-0.052346[/C][C]-0.4769[/C][C]0.317344[/C][/ROW]
[ROW][C]36[/C][C]0.366324[/C][C]3.3374[/C][C]0.000634[/C][/ROW]
[ROW][C]37[/C][C]-0.144637[/C][C]-1.3177[/C][C]0.095614[/C][/ROW]
[ROW][C]38[/C][C]-0.050864[/C][C]-0.4634[/C][C]0.322147[/C][/ROW]
[ROW][C]39[/C][C]-0.025449[/C][C]-0.2319[/C][C]0.408611[/C][/ROW]
[ROW][C]40[/C][C]0.042482[/C][C]0.387[/C][C]0.349862[/C][/ROW]
[ROW][C]41[/C][C]0.039903[/C][C]0.3635[/C][C]0.358564[/C][/ROW]
[ROW][C]42[/C][C]-0.158357[/C][C]-1.4427[/C][C]0.076434[/C][/ROW]
[ROW][C]43[/C][C]0.067786[/C][C]0.6176[/C][C]0.269278[/C][/ROW]
[ROW][C]44[/C][C]-0.046909[/C][C]-0.4274[/C][C]0.335112[/C][/ROW]
[ROW][C]45[/C][C]0.079822[/C][C]0.7272[/C][C]0.234571[/C][/ROW]
[ROW][C]46[/C][C]-0.088937[/C][C]-0.8103[/C][C]0.210054[/C][/ROW]
[ROW][C]47[/C][C]-0.035291[/C][C]-0.3215[/C][C]0.374315[/C][/ROW]
[ROW][C]48[/C][C]0.215261[/C][C]1.9611[/C][C]0.026609[/C][/ROW]
[/TABLE]
Source: https://freestatistics.org/blog/index.php?pk=78039&T=1

Globally Unique Identifier (entire table): ba.freestatistics.org/blog/index.php?pk=78039&T=1

As an alternative you can also use a QR Code:  

The GUIDs for individual cells are displayed in the table below:

Autocorrelation Function
Time lag kACF(k)T-STATP-value
1-0.141208-1.28650.100928
2-0.208505-1.89960.030481
30.0546730.49810.309867
40.1029530.93790.175498
50.0720190.65610.256779
6-0.573245-5.22251e-06
70.0908930.82810.205001
80.1146981.0450.149539
90.0868340.79110.215572
10-0.20274-1.84710.034152
11-0.109747-0.99980.160146
120.7805687.11130
13-0.147593-1.34460.091202
14-0.197977-1.80370.037457
156.9e-056e-040.499751
160.1278261.16450.123769
170.0559180.50940.305898
18-0.468891-4.27182.6e-05
190.0959620.87430.19225
200.0626590.57090.28482
210.0813370.7410.230388
22-0.190853-1.73880.042893
23-0.089715-0.81730.208035
240.5584965.08811e-06
25-0.153811-1.40130.082429
26-0.11051-1.00680.15848
27-0.021568-0.19650.422353
280.0845460.77020.22167
290.0457440.41680.338968
30-0.330834-3.0140.001709
310.0744720.67850.249678
320.0011640.01060.495783
330.0872980.79530.214347
34-0.154984-1.4120.080848
35-0.052346-0.47690.317344
360.3663243.33740.000634
37-0.144637-1.31770.095614
38-0.050864-0.46340.322147
39-0.025449-0.23190.408611
400.0424820.3870.349862
410.0399030.36350.358564
42-0.158357-1.44270.076434
430.0677860.61760.269278
44-0.046909-0.42740.335112
450.0798220.72720.234571
46-0.088937-0.81030.210054
47-0.035291-0.32150.374315
480.2152611.96110.026609


Partial Autocorrelation Function
Time lag kPACF(k)T-STATP-value
1-0.141208-1.28650.100928
2-0.233093-2.12360.018341
3-0.015696-0.1430.44332
40.0661410.60260.274218
50.1200771.0940.13857
6-0.553632-5.04381e-06
7-0.064563-0.58820.278997
8-0.15045-1.37070.087088
90.2315712.10970.018948
10-0.22763-2.07380.020599
11-0.053785-0.490.312711
120.6051875.51350
130.0237680.21650.414549
14-0.019192-0.17480.430813
15-0.04758-0.43350.332898
160.0309110.28160.389472
17-0.004966-0.04520.482012
180.1633141.48790.070288
19-0.002213-0.02020.491983
20-0.155555-1.41720.080087
21-0.112728-1.0270.153701
220.0084770.07720.469312
230.0061860.05640.477598
24-0.129939-1.18380.119936
25-0.100382-0.91450.181547
260.0762610.69480.244569
270.0196620.17910.429135
28-0.151793-1.38290.085202
29-0.038868-0.35410.362081
300.066460.60550.273256
31-0.042748-0.38950.34897
32-0.025533-0.23260.408317
330.0334030.30430.380825
34-0.050235-0.45770.324197
350.0021470.01960.492221
36-0.018308-0.16680.43397
37-0.003177-0.02890.488491
38-0.132019-1.20270.116247
390.0035670.03250.487076
400.0034820.03170.487385
410.0478890.43630.33188
420.0636260.57970.281858
430.03790.34530.365375
44-0.019336-0.17620.430298
45-0.035802-0.32620.372558
460.065760.59910.275367
470.0286390.26090.397402
480.0305380.27820.390771

\begin{tabular}{lllllllll}
\hline
Partial Autocorrelation Function \tabularnewline
Time lag k & PACF(k) & T-STAT & P-value \tabularnewline
1 & -0.141208 & -1.2865 & 0.100928 \tabularnewline
2 & -0.233093 & -2.1236 & 0.018341 \tabularnewline
3 & -0.015696 & -0.143 & 0.44332 \tabularnewline
4 & 0.066141 & 0.6026 & 0.274218 \tabularnewline
5 & 0.120077 & 1.094 & 0.13857 \tabularnewline
6 & -0.553632 & -5.0438 & 1e-06 \tabularnewline
7 & -0.064563 & -0.5882 & 0.278997 \tabularnewline
8 & -0.15045 & -1.3707 & 0.087088 \tabularnewline
9 & 0.231571 & 2.1097 & 0.018948 \tabularnewline
10 & -0.22763 & -2.0738 & 0.020599 \tabularnewline
11 & -0.053785 & -0.49 & 0.312711 \tabularnewline
12 & 0.605187 & 5.5135 & 0 \tabularnewline
13 & 0.023768 & 0.2165 & 0.414549 \tabularnewline
14 & -0.019192 & -0.1748 & 0.430813 \tabularnewline
15 & -0.04758 & -0.4335 & 0.332898 \tabularnewline
16 & 0.030911 & 0.2816 & 0.389472 \tabularnewline
17 & -0.004966 & -0.0452 & 0.482012 \tabularnewline
18 & 0.163314 & 1.4879 & 0.070288 \tabularnewline
19 & -0.002213 & -0.0202 & 0.491983 \tabularnewline
20 & -0.155555 & -1.4172 & 0.080087 \tabularnewline
21 & -0.112728 & -1.027 & 0.153701 \tabularnewline
22 & 0.008477 & 0.0772 & 0.469312 \tabularnewline
23 & 0.006186 & 0.0564 & 0.477598 \tabularnewline
24 & -0.129939 & -1.1838 & 0.119936 \tabularnewline
25 & -0.100382 & -0.9145 & 0.181547 \tabularnewline
26 & 0.076261 & 0.6948 & 0.244569 \tabularnewline
27 & 0.019662 & 0.1791 & 0.429135 \tabularnewline
28 & -0.151793 & -1.3829 & 0.085202 \tabularnewline
29 & -0.038868 & -0.3541 & 0.362081 \tabularnewline
30 & 0.06646 & 0.6055 & 0.273256 \tabularnewline
31 & -0.042748 & -0.3895 & 0.34897 \tabularnewline
32 & -0.025533 & -0.2326 & 0.408317 \tabularnewline
33 & 0.033403 & 0.3043 & 0.380825 \tabularnewline
34 & -0.050235 & -0.4577 & 0.324197 \tabularnewline
35 & 0.002147 & 0.0196 & 0.492221 \tabularnewline
36 & -0.018308 & -0.1668 & 0.43397 \tabularnewline
37 & -0.003177 & -0.0289 & 0.488491 \tabularnewline
38 & -0.132019 & -1.2027 & 0.116247 \tabularnewline
39 & 0.003567 & 0.0325 & 0.487076 \tabularnewline
40 & 0.003482 & 0.0317 & 0.487385 \tabularnewline
41 & 0.047889 & 0.4363 & 0.33188 \tabularnewline
42 & 0.063626 & 0.5797 & 0.281858 \tabularnewline
43 & 0.0379 & 0.3453 & 0.365375 \tabularnewline
44 & -0.019336 & -0.1762 & 0.430298 \tabularnewline
45 & -0.035802 & -0.3262 & 0.372558 \tabularnewline
46 & 0.06576 & 0.5991 & 0.275367 \tabularnewline
47 & 0.028639 & 0.2609 & 0.397402 \tabularnewline
48 & 0.030538 & 0.2782 & 0.390771 \tabularnewline
\hline
\end{tabular}
%Source: https://freestatistics.org/blog/index.php?pk=78039&T=2

[TABLE]
[ROW][C]Partial Autocorrelation Function[/C][/ROW]
[ROW][C]Time lag k[/C][C]PACF(k)[/C][C]T-STAT[/C][C]P-value[/C][/ROW]
[ROW][C]1[/C][C]-0.141208[/C][C]-1.2865[/C][C]0.100928[/C][/ROW]
[ROW][C]2[/C][C]-0.233093[/C][C]-2.1236[/C][C]0.018341[/C][/ROW]
[ROW][C]3[/C][C]-0.015696[/C][C]-0.143[/C][C]0.44332[/C][/ROW]
[ROW][C]4[/C][C]0.066141[/C][C]0.6026[/C][C]0.274218[/C][/ROW]
[ROW][C]5[/C][C]0.120077[/C][C]1.094[/C][C]0.13857[/C][/ROW]
[ROW][C]6[/C][C]-0.553632[/C][C]-5.0438[/C][C]1e-06[/C][/ROW]
[ROW][C]7[/C][C]-0.064563[/C][C]-0.5882[/C][C]0.278997[/C][/ROW]
[ROW][C]8[/C][C]-0.15045[/C][C]-1.3707[/C][C]0.087088[/C][/ROW]
[ROW][C]9[/C][C]0.231571[/C][C]2.1097[/C][C]0.018948[/C][/ROW]
[ROW][C]10[/C][C]-0.22763[/C][C]-2.0738[/C][C]0.020599[/C][/ROW]
[ROW][C]11[/C][C]-0.053785[/C][C]-0.49[/C][C]0.312711[/C][/ROW]
[ROW][C]12[/C][C]0.605187[/C][C]5.5135[/C][C]0[/C][/ROW]
[ROW][C]13[/C][C]0.023768[/C][C]0.2165[/C][C]0.414549[/C][/ROW]
[ROW][C]14[/C][C]-0.019192[/C][C]-0.1748[/C][C]0.430813[/C][/ROW]
[ROW][C]15[/C][C]-0.04758[/C][C]-0.4335[/C][C]0.332898[/C][/ROW]
[ROW][C]16[/C][C]0.030911[/C][C]0.2816[/C][C]0.389472[/C][/ROW]
[ROW][C]17[/C][C]-0.004966[/C][C]-0.0452[/C][C]0.482012[/C][/ROW]
[ROW][C]18[/C][C]0.163314[/C][C]1.4879[/C][C]0.070288[/C][/ROW]
[ROW][C]19[/C][C]-0.002213[/C][C]-0.0202[/C][C]0.491983[/C][/ROW]
[ROW][C]20[/C][C]-0.155555[/C][C]-1.4172[/C][C]0.080087[/C][/ROW]
[ROW][C]21[/C][C]-0.112728[/C][C]-1.027[/C][C]0.153701[/C][/ROW]
[ROW][C]22[/C][C]0.008477[/C][C]0.0772[/C][C]0.469312[/C][/ROW]
[ROW][C]23[/C][C]0.006186[/C][C]0.0564[/C][C]0.477598[/C][/ROW]
[ROW][C]24[/C][C]-0.129939[/C][C]-1.1838[/C][C]0.119936[/C][/ROW]
[ROW][C]25[/C][C]-0.100382[/C][C]-0.9145[/C][C]0.181547[/C][/ROW]
[ROW][C]26[/C][C]0.076261[/C][C]0.6948[/C][C]0.244569[/C][/ROW]
[ROW][C]27[/C][C]0.019662[/C][C]0.1791[/C][C]0.429135[/C][/ROW]
[ROW][C]28[/C][C]-0.151793[/C][C]-1.3829[/C][C]0.085202[/C][/ROW]
[ROW][C]29[/C][C]-0.038868[/C][C]-0.3541[/C][C]0.362081[/C][/ROW]
[ROW][C]30[/C][C]0.06646[/C][C]0.6055[/C][C]0.273256[/C][/ROW]
[ROW][C]31[/C][C]-0.042748[/C][C]-0.3895[/C][C]0.34897[/C][/ROW]
[ROW][C]32[/C][C]-0.025533[/C][C]-0.2326[/C][C]0.408317[/C][/ROW]
[ROW][C]33[/C][C]0.033403[/C][C]0.3043[/C][C]0.380825[/C][/ROW]
[ROW][C]34[/C][C]-0.050235[/C][C]-0.4577[/C][C]0.324197[/C][/ROW]
[ROW][C]35[/C][C]0.002147[/C][C]0.0196[/C][C]0.492221[/C][/ROW]
[ROW][C]36[/C][C]-0.018308[/C][C]-0.1668[/C][C]0.43397[/C][/ROW]
[ROW][C]37[/C][C]-0.003177[/C][C]-0.0289[/C][C]0.488491[/C][/ROW]
[ROW][C]38[/C][C]-0.132019[/C][C]-1.2027[/C][C]0.116247[/C][/ROW]
[ROW][C]39[/C][C]0.003567[/C][C]0.0325[/C][C]0.487076[/C][/ROW]
[ROW][C]40[/C][C]0.003482[/C][C]0.0317[/C][C]0.487385[/C][/ROW]
[ROW][C]41[/C][C]0.047889[/C][C]0.4363[/C][C]0.33188[/C][/ROW]
[ROW][C]42[/C][C]0.063626[/C][C]0.5797[/C][C]0.281858[/C][/ROW]
[ROW][C]43[/C][C]0.0379[/C][C]0.3453[/C][C]0.365375[/C][/ROW]
[ROW][C]44[/C][C]-0.019336[/C][C]-0.1762[/C][C]0.430298[/C][/ROW]
[ROW][C]45[/C][C]-0.035802[/C][C]-0.3262[/C][C]0.372558[/C][/ROW]
[ROW][C]46[/C][C]0.06576[/C][C]0.5991[/C][C]0.275367[/C][/ROW]
[ROW][C]47[/C][C]0.028639[/C][C]0.2609[/C][C]0.397402[/C][/ROW]
[ROW][C]48[/C][C]0.030538[/C][C]0.2782[/C][C]0.390771[/C][/ROW]
[/TABLE]
Source: https://freestatistics.org/blog/index.php?pk=78039&T=2

Globally Unique Identifier (entire table): ba.freestatistics.org/blog/index.php?pk=78039&T=2

As an alternative you can also use a QR Code:  

The GUIDs for individual cells are displayed in the table below:

Partial Autocorrelation Function
Time lag kPACF(k)T-STATP-value
1-0.141208-1.28650.100928
2-0.233093-2.12360.018341
3-0.015696-0.1430.44332
40.0661410.60260.274218
50.1200771.0940.13857
6-0.553632-5.04381e-06
7-0.064563-0.58820.278997
8-0.15045-1.37070.087088
90.2315712.10970.018948
10-0.22763-2.07380.020599
11-0.053785-0.490.312711
120.6051875.51350
130.0237680.21650.414549
14-0.019192-0.17480.430813
15-0.04758-0.43350.332898
160.0309110.28160.389472
17-0.004966-0.04520.482012
180.1633141.48790.070288
19-0.002213-0.02020.491983
20-0.155555-1.41720.080087
21-0.112728-1.0270.153701
220.0084770.07720.469312
230.0061860.05640.477598
24-0.129939-1.18380.119936
25-0.100382-0.91450.181547
260.0762610.69480.244569
270.0196620.17910.429135
28-0.151793-1.38290.085202
29-0.038868-0.35410.362081
300.066460.60550.273256
31-0.042748-0.38950.34897
32-0.025533-0.23260.408317
330.0334030.30430.380825
34-0.050235-0.45770.324197
350.0021470.01960.492221
36-0.018308-0.16680.43397
37-0.003177-0.02890.488491
38-0.132019-1.20270.116247
390.0035670.03250.487076
400.0034820.03170.487385
410.0478890.43630.33188
420.0636260.57970.281858
430.03790.34530.365375
44-0.019336-0.17620.430298
45-0.035802-0.32620.372558
460.065760.59910.275367
470.0286390.26090.397402
480.0305380.27820.390771


Parameters (Session):
par1 = 48 ; par2 = 1 ; par3 = 1 ; par4 = 0 ; par5 = 12 ; par6 = White Noise ; par7 = 0.95 ;
Parameters (R input):
par1 = 48 ; par2 = 1 ; par3 = 1 ; par4 = 0 ; par5 = 12 ; par6 = White Noise ; par7 = 0.95 ;
R code (references can be found in the software module):
if (par1 == 'Default') {
par1 = 10*log10(length(x))
} else {
par1 <- as.numeric(par1)
}
par2 <- as.numeric(par2)
par3 <- as.numeric(par3)
par4 <- as.numeric(par4)
par5 <- as.numeric(par5)
if (par6 == 'White Noise') par6 <- 'white' else par6 <- 'ma'
par7 <- as.numeric(par7)
if (par2 == 0) {
x <- log(x)
} else {
x <- (x ^ par2 - 1) / par2
}
if (par3 > 0) x <- diff(x,lag=1,difference=par3)
if (par4 > 0) x <- diff(x,lag=par5,difference=par4)
bitmap(file='pic1.png')
racf <- acf(x, par1, main='Autocorrelation', xlab='time lag', ylab='ACF', ci.type=par6, ci=par7, sub=paste('(lambda=',par2,', d=',par3,', D=',par4,', CI=', par7, ', CI type=',par6,')',sep=''))
dev.off()
bitmap(file='pic2.png')
rpacf <- pacf(x,par1,main='Partial Autocorrelation',xlab='lags',ylab='PACF')
dev.off()
(myacf <- c(racf$acf))
(mypacf <- c(rpacf$acf))
lengthx <- length(x)
sqrtn <- sqrt(lengthx)
load(file='createtable')
a<-table.start()
a<-table.row.start(a)
a<-table.element(a,'Autocorrelation Function',4,TRUE)
a<-table.row.end(a)
a<-table.row.start(a)
a<-table.element(a,'Time lag k',header=TRUE)
a<-table.element(a,hyperlink('basics.htm','ACF(k)','click here for more information about the Autocorrelation Function'),header=TRUE)
a<-table.element(a,'T-STAT',header=TRUE)
a<-table.element(a,'P-value',header=TRUE)
a<-table.row.end(a)
for (i in 2:(par1+1)) {
a<-table.row.start(a)
a<-table.element(a,i-1,header=TRUE)
a<-table.element(a,round(myacf[i],6))
mytstat <- myacf[i]*sqrtn
a<-table.element(a,round(mytstat,4))
a<-table.element(a,round(1-pt(abs(mytstat),lengthx),6))
a<-table.row.end(a)
}
a<-table.end(a)
table.save(a,file='mytable.tab')
a<-table.start()
a<-table.row.start(a)
a<-table.element(a,'Partial Autocorrelation Function',4,TRUE)
a<-table.row.end(a)
a<-table.row.start(a)
a<-table.element(a,'Time lag k',header=TRUE)
a<-table.element(a,hyperlink('basics.htm','PACF(k)','click here for more information about the Partial Autocorrelation Function'),header=TRUE)
a<-table.element(a,'T-STAT',header=TRUE)
a<-table.element(a,'P-value',header=TRUE)
a<-table.row.end(a)
for (i in 1:par1) {
a<-table.row.start(a)
a<-table.element(a,i,header=TRUE)
a<-table.element(a,round(mypacf[i],6))
mytstat <- mypacf[i]*sqrtn
a<-table.element(a,round(mytstat,4))
a<-table.element(a,round(1-pt(abs(mytstat),lengthx),6))
a<-table.row.end(a)
}
a<-table.end(a)
table.save(a,file='mytable1.tab')