Free Statistics

of Irreproducible Research!

Author's title

Author*Unverified author*
R Software Modulerwasp_autocorrelation.wasp
Title produced by software(Partial) Autocorrelation Function
Date of computationTue, 20 Jul 2010 10:39:24 +0000
Cite this page as followsStatistical Computations at FreeStatistics.org, Office for Research Development and Education, URL https://freestatistics.org/blog/index.php?v=date/2010/Jul/20/t1279622353pqbkakftu4iampk.htm/, Retrieved Sat, 04 May 2024 02:56:52 +0000
Statistical Computations at FreeStatistics.org, Office for Research Development and Education, URL https://freestatistics.org/blog/index.php?pk=78037, Retrieved Sat, 04 May 2024 02:56:52 +0000
QR Codes:

Original text written by user:
IsPrivate?No (this computation is public)
User-defined keywordsVan de Walle Mathias
Estimated Impact194
Family? (F = Feedback message, R = changed R code, M = changed R Module, P = changed Parameters, D = changed Data)
-       [(Partial) Autocorrelation Function] [tijdreeks 1 - sta...] [2010-07-20 10:39:24] [589929edeb20bd59f78e9be1ffd92c80] [Current]
Feedback Forum

Post a new message
Dataseries X:
239
238
237
235
233
232
233
235
236
236
237
239
238
237
244
230
237
244
239
240
230
228
231
228
225
227
238
214
222
233
228
218
203
209
207
203
195
199
207
182
181
189
186
174
153
158
153
147
143
156
168
142
146
150
145
133
111
115
109
105
96
112
127
107
116
125
120
107
86
87
79
83
75
89
104
86
98
98
85
74
49
54
47
56


Summary of computational transaction
Raw Inputview raw input (R code)
Raw Outputview raw output of R engine
Computing time1 seconds
R Server'George Udny Yule' @ 72.249.76.132

\begin{tabular}{lllllllll}
\hline
Summary of computational transaction \tabularnewline
Raw Input & view raw input (R code)  \tabularnewline
Raw Output & view raw output of R engine  \tabularnewline
Computing time & 1 seconds \tabularnewline
R Server & 'George Udny Yule' @ 72.249.76.132 \tabularnewline
\hline
\end{tabular}
%Source: https://freestatistics.org/blog/index.php?pk=78037&T=0

[TABLE]
[ROW][C]Summary of computational transaction[/C][/ROW]
[ROW][C]Raw Input[/C][C]view raw input (R code) [/C][/ROW]
[ROW][C]Raw Output[/C][C]view raw output of R engine [/C][/ROW]
[ROW][C]Computing time[/C][C]1 seconds[/C][/ROW]
[ROW][C]R Server[/C][C]'George Udny Yule' @ 72.249.76.132[/C][/ROW]
[/TABLE]
Source: https://freestatistics.org/blog/index.php?pk=78037&T=0

Globally Unique Identifier (entire table): ba.freestatistics.org/blog/index.php?pk=78037&T=0

As an alternative you can also use a QR Code:  

The GUIDs for individual cells are displayed in the table below:

Summary of computational transaction
Raw Inputview raw input (R code)
Raw Outputview raw output of R engine
Computing time1 seconds
R Server'George Udny Yule' @ 72.249.76.132


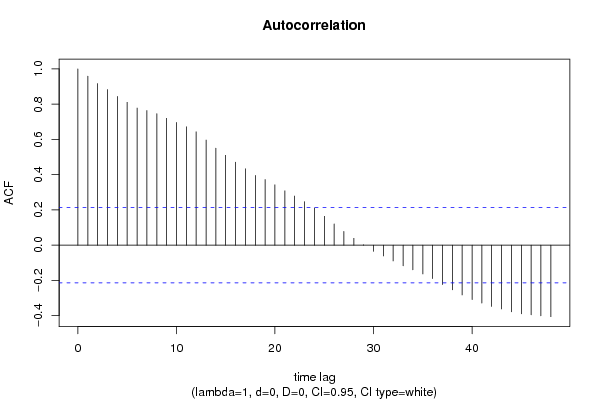
Autocorrelation Function
Time lag kACF(k)T-STATP-value
10.9589418.78880
20.9173718.40780
30.8826818.08990
40.8439297.73470
50.8104647.4280
60.7780737.13120
70.7641067.00310
80.7462736.83970
90.7198766.59780
100.6964286.38290
110.6717286.15650
120.6433315.89620
130.5961165.46350
140.5503465.0441e-06
150.5097944.67236e-06
160.4707144.31422.2e-05
170.4329423.9687.6e-05
180.3956143.62590.000246
190.3724293.41340.000495
200.3422333.13660.001178
210.3082732.82540.002949
220.2785682.55310.006242
230.2468812.26270.013117
240.2113911.93740.028027
250.1637791.50110.068545
260.1200081.09990.137261
270.0776370.71160.239357
280.0385240.35310.362458
290.0020920.01920.492375
30-0.034777-0.31870.375358
31-0.061078-0.55980.288556
32-0.08953-0.82060.207111
33-0.117058-1.07290.143205
34-0.139899-1.28220.10165
35-0.16326-1.49630.069162
36-0.189837-1.73990.042771
37-0.22382-2.05130.021675
38-0.253629-2.32460.011255
39-0.282988-2.59360.005601
40-0.308795-2.83020.00291
41-0.328837-3.01380.001705
42-0.348114-3.19050.000999
43-0.362131-3.3190.000669
44-0.378726-3.47110.000411
45-0.389657-3.57130.000295
46-0.395406-3.6240.000248
47-0.400892-3.67420.000209
48-0.405922-3.72030.000179

\begin{tabular}{lllllllll}
\hline
Autocorrelation Function \tabularnewline
Time lag k & ACF(k) & T-STAT & P-value \tabularnewline
1 & 0.958941 & 8.7888 & 0 \tabularnewline
2 & 0.917371 & 8.4078 & 0 \tabularnewline
3 & 0.882681 & 8.0899 & 0 \tabularnewline
4 & 0.843929 & 7.7347 & 0 \tabularnewline
5 & 0.810464 & 7.428 & 0 \tabularnewline
6 & 0.778073 & 7.1312 & 0 \tabularnewline
7 & 0.764106 & 7.0031 & 0 \tabularnewline
8 & 0.746273 & 6.8397 & 0 \tabularnewline
9 & 0.719876 & 6.5978 & 0 \tabularnewline
10 & 0.696428 & 6.3829 & 0 \tabularnewline
11 & 0.671728 & 6.1565 & 0 \tabularnewline
12 & 0.643331 & 5.8962 & 0 \tabularnewline
13 & 0.596116 & 5.4635 & 0 \tabularnewline
14 & 0.550346 & 5.044 & 1e-06 \tabularnewline
15 & 0.509794 & 4.6723 & 6e-06 \tabularnewline
16 & 0.470714 & 4.3142 & 2.2e-05 \tabularnewline
17 & 0.432942 & 3.968 & 7.6e-05 \tabularnewline
18 & 0.395614 & 3.6259 & 0.000246 \tabularnewline
19 & 0.372429 & 3.4134 & 0.000495 \tabularnewline
20 & 0.342233 & 3.1366 & 0.001178 \tabularnewline
21 & 0.308273 & 2.8254 & 0.002949 \tabularnewline
22 & 0.278568 & 2.5531 & 0.006242 \tabularnewline
23 & 0.246881 & 2.2627 & 0.013117 \tabularnewline
24 & 0.211391 & 1.9374 & 0.028027 \tabularnewline
25 & 0.163779 & 1.5011 & 0.068545 \tabularnewline
26 & 0.120008 & 1.0999 & 0.137261 \tabularnewline
27 & 0.077637 & 0.7116 & 0.239357 \tabularnewline
28 & 0.038524 & 0.3531 & 0.362458 \tabularnewline
29 & 0.002092 & 0.0192 & 0.492375 \tabularnewline
30 & -0.034777 & -0.3187 & 0.375358 \tabularnewline
31 & -0.061078 & -0.5598 & 0.288556 \tabularnewline
32 & -0.08953 & -0.8206 & 0.207111 \tabularnewline
33 & -0.117058 & -1.0729 & 0.143205 \tabularnewline
34 & -0.139899 & -1.2822 & 0.10165 \tabularnewline
35 & -0.16326 & -1.4963 & 0.069162 \tabularnewline
36 & -0.189837 & -1.7399 & 0.042771 \tabularnewline
37 & -0.22382 & -2.0513 & 0.021675 \tabularnewline
38 & -0.253629 & -2.3246 & 0.011255 \tabularnewline
39 & -0.282988 & -2.5936 & 0.005601 \tabularnewline
40 & -0.308795 & -2.8302 & 0.00291 \tabularnewline
41 & -0.328837 & -3.0138 & 0.001705 \tabularnewline
42 & -0.348114 & -3.1905 & 0.000999 \tabularnewline
43 & -0.362131 & -3.319 & 0.000669 \tabularnewline
44 & -0.378726 & -3.4711 & 0.000411 \tabularnewline
45 & -0.389657 & -3.5713 & 0.000295 \tabularnewline
46 & -0.395406 & -3.624 & 0.000248 \tabularnewline
47 & -0.400892 & -3.6742 & 0.000209 \tabularnewline
48 & -0.405922 & -3.7203 & 0.000179 \tabularnewline
\hline
\end{tabular}
%Source: https://freestatistics.org/blog/index.php?pk=78037&T=1

[TABLE]
[ROW][C]Autocorrelation Function[/C][/ROW]
[ROW][C]Time lag k[/C][C]ACF(k)[/C][C]T-STAT[/C][C]P-value[/C][/ROW]
[ROW][C]1[/C][C]0.958941[/C][C]8.7888[/C][C]0[/C][/ROW]
[ROW][C]2[/C][C]0.917371[/C][C]8.4078[/C][C]0[/C][/ROW]
[ROW][C]3[/C][C]0.882681[/C][C]8.0899[/C][C]0[/C][/ROW]
[ROW][C]4[/C][C]0.843929[/C][C]7.7347[/C][C]0[/C][/ROW]
[ROW][C]5[/C][C]0.810464[/C][C]7.428[/C][C]0[/C][/ROW]
[ROW][C]6[/C][C]0.778073[/C][C]7.1312[/C][C]0[/C][/ROW]
[ROW][C]7[/C][C]0.764106[/C][C]7.0031[/C][C]0[/C][/ROW]
[ROW][C]8[/C][C]0.746273[/C][C]6.8397[/C][C]0[/C][/ROW]
[ROW][C]9[/C][C]0.719876[/C][C]6.5978[/C][C]0[/C][/ROW]
[ROW][C]10[/C][C]0.696428[/C][C]6.3829[/C][C]0[/C][/ROW]
[ROW][C]11[/C][C]0.671728[/C][C]6.1565[/C][C]0[/C][/ROW]
[ROW][C]12[/C][C]0.643331[/C][C]5.8962[/C][C]0[/C][/ROW]
[ROW][C]13[/C][C]0.596116[/C][C]5.4635[/C][C]0[/C][/ROW]
[ROW][C]14[/C][C]0.550346[/C][C]5.044[/C][C]1e-06[/C][/ROW]
[ROW][C]15[/C][C]0.509794[/C][C]4.6723[/C][C]6e-06[/C][/ROW]
[ROW][C]16[/C][C]0.470714[/C][C]4.3142[/C][C]2.2e-05[/C][/ROW]
[ROW][C]17[/C][C]0.432942[/C][C]3.968[/C][C]7.6e-05[/C][/ROW]
[ROW][C]18[/C][C]0.395614[/C][C]3.6259[/C][C]0.000246[/C][/ROW]
[ROW][C]19[/C][C]0.372429[/C][C]3.4134[/C][C]0.000495[/C][/ROW]
[ROW][C]20[/C][C]0.342233[/C][C]3.1366[/C][C]0.001178[/C][/ROW]
[ROW][C]21[/C][C]0.308273[/C][C]2.8254[/C][C]0.002949[/C][/ROW]
[ROW][C]22[/C][C]0.278568[/C][C]2.5531[/C][C]0.006242[/C][/ROW]
[ROW][C]23[/C][C]0.246881[/C][C]2.2627[/C][C]0.013117[/C][/ROW]
[ROW][C]24[/C][C]0.211391[/C][C]1.9374[/C][C]0.028027[/C][/ROW]
[ROW][C]25[/C][C]0.163779[/C][C]1.5011[/C][C]0.068545[/C][/ROW]
[ROW][C]26[/C][C]0.120008[/C][C]1.0999[/C][C]0.137261[/C][/ROW]
[ROW][C]27[/C][C]0.077637[/C][C]0.7116[/C][C]0.239357[/C][/ROW]
[ROW][C]28[/C][C]0.038524[/C][C]0.3531[/C][C]0.362458[/C][/ROW]
[ROW][C]29[/C][C]0.002092[/C][C]0.0192[/C][C]0.492375[/C][/ROW]
[ROW][C]30[/C][C]-0.034777[/C][C]-0.3187[/C][C]0.375358[/C][/ROW]
[ROW][C]31[/C][C]-0.061078[/C][C]-0.5598[/C][C]0.288556[/C][/ROW]
[ROW][C]32[/C][C]-0.08953[/C][C]-0.8206[/C][C]0.207111[/C][/ROW]
[ROW][C]33[/C][C]-0.117058[/C][C]-1.0729[/C][C]0.143205[/C][/ROW]
[ROW][C]34[/C][C]-0.139899[/C][C]-1.2822[/C][C]0.10165[/C][/ROW]
[ROW][C]35[/C][C]-0.16326[/C][C]-1.4963[/C][C]0.069162[/C][/ROW]
[ROW][C]36[/C][C]-0.189837[/C][C]-1.7399[/C][C]0.042771[/C][/ROW]
[ROW][C]37[/C][C]-0.22382[/C][C]-2.0513[/C][C]0.021675[/C][/ROW]
[ROW][C]38[/C][C]-0.253629[/C][C]-2.3246[/C][C]0.011255[/C][/ROW]
[ROW][C]39[/C][C]-0.282988[/C][C]-2.5936[/C][C]0.005601[/C][/ROW]
[ROW][C]40[/C][C]-0.308795[/C][C]-2.8302[/C][C]0.00291[/C][/ROW]
[ROW][C]41[/C][C]-0.328837[/C][C]-3.0138[/C][C]0.001705[/C][/ROW]
[ROW][C]42[/C][C]-0.348114[/C][C]-3.1905[/C][C]0.000999[/C][/ROW]
[ROW][C]43[/C][C]-0.362131[/C][C]-3.319[/C][C]0.000669[/C][/ROW]
[ROW][C]44[/C][C]-0.378726[/C][C]-3.4711[/C][C]0.000411[/C][/ROW]
[ROW][C]45[/C][C]-0.389657[/C][C]-3.5713[/C][C]0.000295[/C][/ROW]
[ROW][C]46[/C][C]-0.395406[/C][C]-3.624[/C][C]0.000248[/C][/ROW]
[ROW][C]47[/C][C]-0.400892[/C][C]-3.6742[/C][C]0.000209[/C][/ROW]
[ROW][C]48[/C][C]-0.405922[/C][C]-3.7203[/C][C]0.000179[/C][/ROW]
[/TABLE]
Source: https://freestatistics.org/blog/index.php?pk=78037&T=1

Globally Unique Identifier (entire table): ba.freestatistics.org/blog/index.php?pk=78037&T=1

As an alternative you can also use a QR Code:  

The GUIDs for individual cells are displayed in the table below:

Autocorrelation Function
Time lag kACF(k)T-STATP-value
10.9589418.78880
20.9173718.40780
30.8826818.08990
40.8439297.73470
50.8104647.4280
60.7780737.13120
70.7641067.00310
80.7462736.83970
90.7198766.59780
100.6964286.38290
110.6717286.15650
120.6433315.89620
130.5961165.46350
140.5503465.0441e-06
150.5097944.67236e-06
160.4707144.31422.2e-05
170.4329423.9687.6e-05
180.3956143.62590.000246
190.3724293.41340.000495
200.3422333.13660.001178
210.3082732.82540.002949
220.2785682.55310.006242
230.2468812.26270.013117
240.2113911.93740.028027
250.1637791.50110.068545
260.1200081.09990.137261
270.0776370.71160.239357
280.0385240.35310.362458
290.0020920.01920.492375
30-0.034777-0.31870.375358
31-0.061078-0.55980.288556
32-0.08953-0.82060.207111
33-0.117058-1.07290.143205
34-0.139899-1.28220.10165
35-0.16326-1.49630.069162
36-0.189837-1.73990.042771
37-0.22382-2.05130.021675
38-0.253629-2.32460.011255
39-0.282988-2.59360.005601
40-0.308795-2.83020.00291
41-0.328837-3.01380.001705
42-0.348114-3.19050.000999
43-0.362131-3.3190.000669
44-0.378726-3.47110.000411
45-0.389657-3.57130.000295
46-0.395406-3.6240.000248
47-0.400892-3.67420.000209
48-0.405922-3.72030.000179


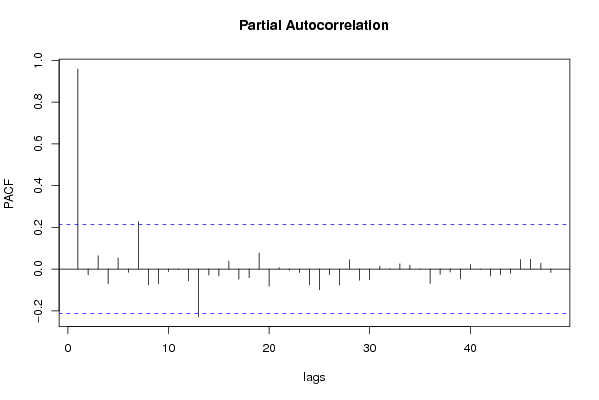
Partial Autocorrelation Function
Time lag kPACF(k)T-STATP-value
10.9589418.78880
2-0.027301-0.25020.401516
30.0639520.58610.279681
4-0.070532-0.64640.259879
50.0534230.48960.312836
6-0.015592-0.14290.443354
70.2279652.08930.019852
8-0.076114-0.69760.243679
9-0.070563-0.64670.259789
10-0.011923-0.10930.456624
11-0.002436-0.02230.491122
12-0.056321-0.51620.303538
13-0.227934-2.08910.019865
14-0.028745-0.26340.396425
15-0.032786-0.30050.382274
160.0379270.34760.364504
17-0.048228-0.4420.329807
18-0.041251-0.37810.353164
190.0768240.70410.241659
20-0.081897-0.75060.227495
210.0068980.06320.474869
22-0.005304-0.04860.480671
23-0.016584-0.1520.439779
24-0.075896-0.69560.2443
25-0.098988-0.90720.183437
26-0.026708-0.24480.403611
27-0.076855-0.70440.241571
280.0451250.41360.340119
29-0.0531-0.48670.313879
30-0.051107-0.46840.320355
310.0141370.12960.448609
320.002240.02050.491833
330.0250170.22930.409602
340.0183970.16860.433252
350.0011340.01040.495866
36-0.069057-0.63290.264252
37-0.025122-0.23020.409231
38-0.014442-0.13240.447506
39-0.046966-0.43040.333985
400.0221910.20340.419665
41-0.000822-0.00750.497005
42-0.033065-0.3030.381304
43-0.027644-0.25340.400303
44-0.020622-0.1890.425273
450.0458920.42060.337559
460.047250.43310.333042
470.0282870.25930.398037
48-0.015944-0.14610.442085

\begin{tabular}{lllllllll}
\hline
Partial Autocorrelation Function \tabularnewline
Time lag k & PACF(k) & T-STAT & P-value \tabularnewline
1 & 0.958941 & 8.7888 & 0 \tabularnewline
2 & -0.027301 & -0.2502 & 0.401516 \tabularnewline
3 & 0.063952 & 0.5861 & 0.279681 \tabularnewline
4 & -0.070532 & -0.6464 & 0.259879 \tabularnewline
5 & 0.053423 & 0.4896 & 0.312836 \tabularnewline
6 & -0.015592 & -0.1429 & 0.443354 \tabularnewline
7 & 0.227965 & 2.0893 & 0.019852 \tabularnewline
8 & -0.076114 & -0.6976 & 0.243679 \tabularnewline
9 & -0.070563 & -0.6467 & 0.259789 \tabularnewline
10 & -0.011923 & -0.1093 & 0.456624 \tabularnewline
11 & -0.002436 & -0.0223 & 0.491122 \tabularnewline
12 & -0.056321 & -0.5162 & 0.303538 \tabularnewline
13 & -0.227934 & -2.0891 & 0.019865 \tabularnewline
14 & -0.028745 & -0.2634 & 0.396425 \tabularnewline
15 & -0.032786 & -0.3005 & 0.382274 \tabularnewline
16 & 0.037927 & 0.3476 & 0.364504 \tabularnewline
17 & -0.048228 & -0.442 & 0.329807 \tabularnewline
18 & -0.041251 & -0.3781 & 0.353164 \tabularnewline
19 & 0.076824 & 0.7041 & 0.241659 \tabularnewline
20 & -0.081897 & -0.7506 & 0.227495 \tabularnewline
21 & 0.006898 & 0.0632 & 0.474869 \tabularnewline
22 & -0.005304 & -0.0486 & 0.480671 \tabularnewline
23 & -0.016584 & -0.152 & 0.439779 \tabularnewline
24 & -0.075896 & -0.6956 & 0.2443 \tabularnewline
25 & -0.098988 & -0.9072 & 0.183437 \tabularnewline
26 & -0.026708 & -0.2448 & 0.403611 \tabularnewline
27 & -0.076855 & -0.7044 & 0.241571 \tabularnewline
28 & 0.045125 & 0.4136 & 0.340119 \tabularnewline
29 & -0.0531 & -0.4867 & 0.313879 \tabularnewline
30 & -0.051107 & -0.4684 & 0.320355 \tabularnewline
31 & 0.014137 & 0.1296 & 0.448609 \tabularnewline
32 & 0.00224 & 0.0205 & 0.491833 \tabularnewline
33 & 0.025017 & 0.2293 & 0.409602 \tabularnewline
34 & 0.018397 & 0.1686 & 0.433252 \tabularnewline
35 & 0.001134 & 0.0104 & 0.495866 \tabularnewline
36 & -0.069057 & -0.6329 & 0.264252 \tabularnewline
37 & -0.025122 & -0.2302 & 0.409231 \tabularnewline
38 & -0.014442 & -0.1324 & 0.447506 \tabularnewline
39 & -0.046966 & -0.4304 & 0.333985 \tabularnewline
40 & 0.022191 & 0.2034 & 0.419665 \tabularnewline
41 & -0.000822 & -0.0075 & 0.497005 \tabularnewline
42 & -0.033065 & -0.303 & 0.381304 \tabularnewline
43 & -0.027644 & -0.2534 & 0.400303 \tabularnewline
44 & -0.020622 & -0.189 & 0.425273 \tabularnewline
45 & 0.045892 & 0.4206 & 0.337559 \tabularnewline
46 & 0.04725 & 0.4331 & 0.333042 \tabularnewline
47 & 0.028287 & 0.2593 & 0.398037 \tabularnewline
48 & -0.015944 & -0.1461 & 0.442085 \tabularnewline
\hline
\end{tabular}
%Source: https://freestatistics.org/blog/index.php?pk=78037&T=2

[TABLE]
[ROW][C]Partial Autocorrelation Function[/C][/ROW]
[ROW][C]Time lag k[/C][C]PACF(k)[/C][C]T-STAT[/C][C]P-value[/C][/ROW]
[ROW][C]1[/C][C]0.958941[/C][C]8.7888[/C][C]0[/C][/ROW]
[ROW][C]2[/C][C]-0.027301[/C][C]-0.2502[/C][C]0.401516[/C][/ROW]
[ROW][C]3[/C][C]0.063952[/C][C]0.5861[/C][C]0.279681[/C][/ROW]
[ROW][C]4[/C][C]-0.070532[/C][C]-0.6464[/C][C]0.259879[/C][/ROW]
[ROW][C]5[/C][C]0.053423[/C][C]0.4896[/C][C]0.312836[/C][/ROW]
[ROW][C]6[/C][C]-0.015592[/C][C]-0.1429[/C][C]0.443354[/C][/ROW]
[ROW][C]7[/C][C]0.227965[/C][C]2.0893[/C][C]0.019852[/C][/ROW]
[ROW][C]8[/C][C]-0.076114[/C][C]-0.6976[/C][C]0.243679[/C][/ROW]
[ROW][C]9[/C][C]-0.070563[/C][C]-0.6467[/C][C]0.259789[/C][/ROW]
[ROW][C]10[/C][C]-0.011923[/C][C]-0.1093[/C][C]0.456624[/C][/ROW]
[ROW][C]11[/C][C]-0.002436[/C][C]-0.0223[/C][C]0.491122[/C][/ROW]
[ROW][C]12[/C][C]-0.056321[/C][C]-0.5162[/C][C]0.303538[/C][/ROW]
[ROW][C]13[/C][C]-0.227934[/C][C]-2.0891[/C][C]0.019865[/C][/ROW]
[ROW][C]14[/C][C]-0.028745[/C][C]-0.2634[/C][C]0.396425[/C][/ROW]
[ROW][C]15[/C][C]-0.032786[/C][C]-0.3005[/C][C]0.382274[/C][/ROW]
[ROW][C]16[/C][C]0.037927[/C][C]0.3476[/C][C]0.364504[/C][/ROW]
[ROW][C]17[/C][C]-0.048228[/C][C]-0.442[/C][C]0.329807[/C][/ROW]
[ROW][C]18[/C][C]-0.041251[/C][C]-0.3781[/C][C]0.353164[/C][/ROW]
[ROW][C]19[/C][C]0.076824[/C][C]0.7041[/C][C]0.241659[/C][/ROW]
[ROW][C]20[/C][C]-0.081897[/C][C]-0.7506[/C][C]0.227495[/C][/ROW]
[ROW][C]21[/C][C]0.006898[/C][C]0.0632[/C][C]0.474869[/C][/ROW]
[ROW][C]22[/C][C]-0.005304[/C][C]-0.0486[/C][C]0.480671[/C][/ROW]
[ROW][C]23[/C][C]-0.016584[/C][C]-0.152[/C][C]0.439779[/C][/ROW]
[ROW][C]24[/C][C]-0.075896[/C][C]-0.6956[/C][C]0.2443[/C][/ROW]
[ROW][C]25[/C][C]-0.098988[/C][C]-0.9072[/C][C]0.183437[/C][/ROW]
[ROW][C]26[/C][C]-0.026708[/C][C]-0.2448[/C][C]0.403611[/C][/ROW]
[ROW][C]27[/C][C]-0.076855[/C][C]-0.7044[/C][C]0.241571[/C][/ROW]
[ROW][C]28[/C][C]0.045125[/C][C]0.4136[/C][C]0.340119[/C][/ROW]
[ROW][C]29[/C][C]-0.0531[/C][C]-0.4867[/C][C]0.313879[/C][/ROW]
[ROW][C]30[/C][C]-0.051107[/C][C]-0.4684[/C][C]0.320355[/C][/ROW]
[ROW][C]31[/C][C]0.014137[/C][C]0.1296[/C][C]0.448609[/C][/ROW]
[ROW][C]32[/C][C]0.00224[/C][C]0.0205[/C][C]0.491833[/C][/ROW]
[ROW][C]33[/C][C]0.025017[/C][C]0.2293[/C][C]0.409602[/C][/ROW]
[ROW][C]34[/C][C]0.018397[/C][C]0.1686[/C][C]0.433252[/C][/ROW]
[ROW][C]35[/C][C]0.001134[/C][C]0.0104[/C][C]0.495866[/C][/ROW]
[ROW][C]36[/C][C]-0.069057[/C][C]-0.6329[/C][C]0.264252[/C][/ROW]
[ROW][C]37[/C][C]-0.025122[/C][C]-0.2302[/C][C]0.409231[/C][/ROW]
[ROW][C]38[/C][C]-0.014442[/C][C]-0.1324[/C][C]0.447506[/C][/ROW]
[ROW][C]39[/C][C]-0.046966[/C][C]-0.4304[/C][C]0.333985[/C][/ROW]
[ROW][C]40[/C][C]0.022191[/C][C]0.2034[/C][C]0.419665[/C][/ROW]
[ROW][C]41[/C][C]-0.000822[/C][C]-0.0075[/C][C]0.497005[/C][/ROW]
[ROW][C]42[/C][C]-0.033065[/C][C]-0.303[/C][C]0.381304[/C][/ROW]
[ROW][C]43[/C][C]-0.027644[/C][C]-0.2534[/C][C]0.400303[/C][/ROW]
[ROW][C]44[/C][C]-0.020622[/C][C]-0.189[/C][C]0.425273[/C][/ROW]
[ROW][C]45[/C][C]0.045892[/C][C]0.4206[/C][C]0.337559[/C][/ROW]
[ROW][C]46[/C][C]0.04725[/C][C]0.4331[/C][C]0.333042[/C][/ROW]
[ROW][C]47[/C][C]0.028287[/C][C]0.2593[/C][C]0.398037[/C][/ROW]
[ROW][C]48[/C][C]-0.015944[/C][C]-0.1461[/C][C]0.442085[/C][/ROW]
[/TABLE]
Source: https://freestatistics.org/blog/index.php?pk=78037&T=2

Globally Unique Identifier (entire table): ba.freestatistics.org/blog/index.php?pk=78037&T=2

As an alternative you can also use a QR Code:  

The GUIDs for individual cells are displayed in the table below:

Partial Autocorrelation Function
Time lag kPACF(k)T-STATP-value
10.9589418.78880
2-0.027301-0.25020.401516
30.0639520.58610.279681
4-0.070532-0.64640.259879
50.0534230.48960.312836
6-0.015592-0.14290.443354
70.2279652.08930.019852
8-0.076114-0.69760.243679
9-0.070563-0.64670.259789
10-0.011923-0.10930.456624
11-0.002436-0.02230.491122
12-0.056321-0.51620.303538
13-0.227934-2.08910.019865
14-0.028745-0.26340.396425
15-0.032786-0.30050.382274
160.0379270.34760.364504
17-0.048228-0.4420.329807
18-0.041251-0.37810.353164
190.0768240.70410.241659
20-0.081897-0.75060.227495
210.0068980.06320.474869
22-0.005304-0.04860.480671
23-0.016584-0.1520.439779
24-0.075896-0.69560.2443
25-0.098988-0.90720.183437
26-0.026708-0.24480.403611
27-0.076855-0.70440.241571
280.0451250.41360.340119
29-0.0531-0.48670.313879
30-0.051107-0.46840.320355
310.0141370.12960.448609
320.002240.02050.491833
330.0250170.22930.409602
340.0183970.16860.433252
350.0011340.01040.495866
36-0.069057-0.63290.264252
37-0.025122-0.23020.409231
38-0.014442-0.13240.447506
39-0.046966-0.43040.333985
400.0221910.20340.419665
41-0.000822-0.00750.497005
42-0.033065-0.3030.381304
43-0.027644-0.25340.400303
44-0.020622-0.1890.425273
450.0458920.42060.337559
460.047250.43310.333042
470.0282870.25930.398037
48-0.015944-0.14610.442085


Parameters (Session):
par1 = 48 ; par2 = 1 ; par3 = 0 ; par4 = 0 ; par5 = 12 ; par6 = White Noise ; par7 = 0.95 ;
Parameters (R input):
par1 = 48 ; par2 = 1 ; par3 = 0 ; par4 = 0 ; par5 = 12 ; par6 = White Noise ; par7 = 0.95 ;
R code (references can be found in the software module):
if (par1 == 'Default') {
par1 = 10*log10(length(x))
} else {
par1 <- as.numeric(par1)
}
par2 <- as.numeric(par2)
par3 <- as.numeric(par3)
par4 <- as.numeric(par4)
par5 <- as.numeric(par5)
if (par6 == 'White Noise') par6 <- 'white' else par6 <- 'ma'
par7 <- as.numeric(par7)
if (par2 == 0) {
x <- log(x)
} else {
x <- (x ^ par2 - 1) / par2
}
if (par3 > 0) x <- diff(x,lag=1,difference=par3)
if (par4 > 0) x <- diff(x,lag=par5,difference=par4)
bitmap(file='pic1.png')
racf <- acf(x, par1, main='Autocorrelation', xlab='time lag', ylab='ACF', ci.type=par6, ci=par7, sub=paste('(lambda=',par2,', d=',par3,', D=',par4,', CI=', par7, ', CI type=',par6,')',sep=''))
dev.off()
bitmap(file='pic2.png')
rpacf <- pacf(x,par1,main='Partial Autocorrelation',xlab='lags',ylab='PACF')
dev.off()
(myacf <- c(racf$acf))
(mypacf <- c(rpacf$acf))
lengthx <- length(x)
sqrtn <- sqrt(lengthx)
load(file='createtable')
a<-table.start()
a<-table.row.start(a)
a<-table.element(a,'Autocorrelation Function',4,TRUE)
a<-table.row.end(a)
a<-table.row.start(a)
a<-table.element(a,'Time lag k',header=TRUE)
a<-table.element(a,hyperlink('basics.htm','ACF(k)','click here for more information about the Autocorrelation Function'),header=TRUE)
a<-table.element(a,'T-STAT',header=TRUE)
a<-table.element(a,'P-value',header=TRUE)
a<-table.row.end(a)
for (i in 2:(par1+1)) {
a<-table.row.start(a)
a<-table.element(a,i-1,header=TRUE)
a<-table.element(a,round(myacf[i],6))
mytstat <- myacf[i]*sqrtn
a<-table.element(a,round(mytstat,4))
a<-table.element(a,round(1-pt(abs(mytstat),lengthx),6))
a<-table.row.end(a)
}
a<-table.end(a)
table.save(a,file='mytable.tab')
a<-table.start()
a<-table.row.start(a)
a<-table.element(a,'Partial Autocorrelation Function',4,TRUE)
a<-table.row.end(a)
a<-table.row.start(a)
a<-table.element(a,'Time lag k',header=TRUE)
a<-table.element(a,hyperlink('basics.htm','PACF(k)','click here for more information about the Partial Autocorrelation Function'),header=TRUE)
a<-table.element(a,'T-STAT',header=TRUE)
a<-table.element(a,'P-value',header=TRUE)
a<-table.row.end(a)
for (i in 1:par1) {
a<-table.row.start(a)
a<-table.element(a,i,header=TRUE)
a<-table.element(a,round(mypacf[i],6))
mytstat <- mypacf[i]*sqrtn
a<-table.element(a,round(mytstat,4))
a<-table.element(a,round(1-pt(abs(mytstat),lengthx),6))
a<-table.row.end(a)
}
a<-table.end(a)
table.save(a,file='mytable1.tab')