Free Statistics

of Irreproducible Research!

Author's title

Author*Unverified author*
R Software Modulerwasp_smp.wasp
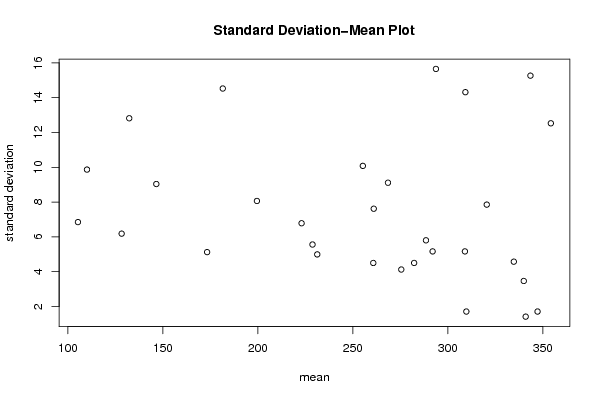
Title produced by softwareStandard Deviation-Mean Plot
Date of computationMon, 19 Jul 2010 15:02:03 +0000
Cite this page as followsStatistical Computations at FreeStatistics.org, Office for Research Development and Education, URL https://freestatistics.org/blog/index.php?v=date/2010/Jul/19/t12795530924afb0nivxxpvqry.htm/, Retrieved Fri, 03 May 2024 08:24:14 +0000
Statistical Computations at FreeStatistics.org, Office for Research Development and Education, URL https://freestatistics.org/blog/index.php?pk=78021, Retrieved Fri, 03 May 2024 08:24:14 +0000
QR Codes:

Original text written by user:
IsPrivate?No (this computation is public)
User-defined keywordsVan Puyenbroeck Cassandra
Estimated Impact221
Family? (F = Feedback message, R = changed R code, M = changed R Module, P = changed Parameters, D = changed Data)
-       [Standard Deviation-Mean Plot] [Tijdreeks 1 - Sta...] [2010-07-19 15:02:03] [0e5311d1fc10a1511b42f76588fb6510] [Current]
Feedback Forum

Post a new message
Dataseries X:
349
348
347
345
365
364
349
339
340
340
341
343
341
343
341
335
355
357
337
325
336
338
337
328
326
327
319
310
320
322
303
292
303
315
311
307
308
312
309
310
309
304
287
275
290
298
294
286
294
292
287
281
280
271
264
259
271
279
279
273
286
286
280
277
269
255
252
245
257
267
261
258
271
262
258
253
236
228
235
226
231
235
227
222
233
221
218
220
204
196
208
190
191
194
179
162
179
176
168
170
153
142
155
136
136
144
135
114
135
132
123
123
103
97
113
108
111
121
111
97


Summary of computational transaction
Raw Inputview raw input (R code)
Raw Outputview raw output of R engine
Computing time1 seconds
R Server'RServer@AstonUniversity' @ vre.aston.ac.uk

\begin{tabular}{lllllllll}
\hline
Summary of computational transaction \tabularnewline
Raw Input & view raw input (R code)  \tabularnewline
Raw Output & view raw output of R engine  \tabularnewline
Computing time & 1 seconds \tabularnewline
R Server & 'RServer@AstonUniversity' @ vre.aston.ac.uk \tabularnewline
\hline
\end{tabular}
%Source: https://freestatistics.org/blog/index.php?pk=78021&T=0

[TABLE]
[ROW][C]Summary of computational transaction[/C][/ROW]
[ROW][C]Raw Input[/C][C]view raw input (R code) [/C][/ROW]
[ROW][C]Raw Output[/C][C]view raw output of R engine [/C][/ROW]
[ROW][C]Computing time[/C][C]1 seconds[/C][/ROW]
[ROW][C]R Server[/C][C]'RServer@AstonUniversity' @ vre.aston.ac.uk[/C][/ROW]
[/TABLE]
Source: https://freestatistics.org/blog/index.php?pk=78021&T=0

Globally Unique Identifier (entire table): ba.freestatistics.org/blog/index.php?pk=78021&T=0

As an alternative you can also use a QR Code:  

The GUIDs for individual cells are displayed in the table below:

Summary of computational transaction
Raw Inputview raw input (R code)
Raw Outputview raw output of R engine
Computing time1 seconds
R Server'RServer@AstonUniversity' @ vre.aston.ac.uk


Standard Deviation-Mean Plot
SectionMeanStandard DeviationRange
1347.251.707825127659934
2354.2512.526638282742426
33411.41421356237313
43403.464101615137758
5343.515.264337522473732
6334.754.5734742446707510
7320.57.8528126595931617
8309.2514.314910641239330
93095.1639777949432212
10309.751.707825127659934
11293.7515.649813630413234
122925.1639777949432212
13288.55.802298395176413
14268.59.110433579144321
15275.54.123105625617668
16282.254.59
17255.2510.078855755160624
18260.754.510
192617.6157731058639118
20231.254.9916597106239810
21228.755.5602757725374313
222236.7823299831252715
23199.58.0622577482985518
24181.514.525839046333932
25173.255.123475382979811
26146.59.0369611411506419
27132.2512.816005617976330
28128.256.1846584384264912
29105.256.849574196011516
301109.865765724632524

\begin{tabular}{lllllllll}
\hline
Standard Deviation-Mean Plot \tabularnewline
Section & Mean & Standard Deviation & Range \tabularnewline
1 & 347.25 & 1.70782512765993 & 4 \tabularnewline
2 & 354.25 & 12.5266382827424 & 26 \tabularnewline
3 & 341 & 1.4142135623731 & 3 \tabularnewline
4 & 340 & 3.46410161513775 & 8 \tabularnewline
5 & 343.5 & 15.2643375224737 & 32 \tabularnewline
6 & 334.75 & 4.57347424467075 & 10 \tabularnewline
7 & 320.5 & 7.85281265959316 & 17 \tabularnewline
8 & 309.25 & 14.3149106412393 & 30 \tabularnewline
9 & 309 & 5.16397779494322 & 12 \tabularnewline
10 & 309.75 & 1.70782512765993 & 4 \tabularnewline
11 & 293.75 & 15.6498136304132 & 34 \tabularnewline
12 & 292 & 5.16397779494322 & 12 \tabularnewline
13 & 288.5 & 5.8022983951764 & 13 \tabularnewline
14 & 268.5 & 9.1104335791443 & 21 \tabularnewline
15 & 275.5 & 4.12310562561766 & 8 \tabularnewline
16 & 282.25 & 4.5 & 9 \tabularnewline
17 & 255.25 & 10.0788557551606 & 24 \tabularnewline
18 & 260.75 & 4.5 & 10 \tabularnewline
19 & 261 & 7.61577310586391 & 18 \tabularnewline
20 & 231.25 & 4.99165971062398 & 10 \tabularnewline
21 & 228.75 & 5.56027577253743 & 13 \tabularnewline
22 & 223 & 6.78232998312527 & 15 \tabularnewline
23 & 199.5 & 8.06225774829855 & 18 \tabularnewline
24 & 181.5 & 14.5258390463339 & 32 \tabularnewline
25 & 173.25 & 5.1234753829798 & 11 \tabularnewline
26 & 146.5 & 9.03696114115064 & 19 \tabularnewline
27 & 132.25 & 12.8160056179763 & 30 \tabularnewline
28 & 128.25 & 6.18465843842649 & 12 \tabularnewline
29 & 105.25 & 6.8495741960115 & 16 \tabularnewline
30 & 110 & 9.8657657246325 & 24 \tabularnewline
\hline
\end{tabular}
%Source: https://freestatistics.org/blog/index.php?pk=78021&T=1

[TABLE]
[ROW][C]Standard Deviation-Mean Plot[/C][/ROW]
[ROW][C]Section[/C][C]Mean[/C][C]Standard Deviation[/C][C]Range[/C][/ROW]
[ROW][C]1[/C][C]347.25[/C][C]1.70782512765993[/C][C]4[/C][/ROW]
[ROW][C]2[/C][C]354.25[/C][C]12.5266382827424[/C][C]26[/C][/ROW]
[ROW][C]3[/C][C]341[/C][C]1.4142135623731[/C][C]3[/C][/ROW]
[ROW][C]4[/C][C]340[/C][C]3.46410161513775[/C][C]8[/C][/ROW]
[ROW][C]5[/C][C]343.5[/C][C]15.2643375224737[/C][C]32[/C][/ROW]
[ROW][C]6[/C][C]334.75[/C][C]4.57347424467075[/C][C]10[/C][/ROW]
[ROW][C]7[/C][C]320.5[/C][C]7.85281265959316[/C][C]17[/C][/ROW]
[ROW][C]8[/C][C]309.25[/C][C]14.3149106412393[/C][C]30[/C][/ROW]
[ROW][C]9[/C][C]309[/C][C]5.16397779494322[/C][C]12[/C][/ROW]
[ROW][C]10[/C][C]309.75[/C][C]1.70782512765993[/C][C]4[/C][/ROW]
[ROW][C]11[/C][C]293.75[/C][C]15.6498136304132[/C][C]34[/C][/ROW]
[ROW][C]12[/C][C]292[/C][C]5.16397779494322[/C][C]12[/C][/ROW]
[ROW][C]13[/C][C]288.5[/C][C]5.8022983951764[/C][C]13[/C][/ROW]
[ROW][C]14[/C][C]268.5[/C][C]9.1104335791443[/C][C]21[/C][/ROW]
[ROW][C]15[/C][C]275.5[/C][C]4.12310562561766[/C][C]8[/C][/ROW]
[ROW][C]16[/C][C]282.25[/C][C]4.5[/C][C]9[/C][/ROW]
[ROW][C]17[/C][C]255.25[/C][C]10.0788557551606[/C][C]24[/C][/ROW]
[ROW][C]18[/C][C]260.75[/C][C]4.5[/C][C]10[/C][/ROW]
[ROW][C]19[/C][C]261[/C][C]7.61577310586391[/C][C]18[/C][/ROW]
[ROW][C]20[/C][C]231.25[/C][C]4.99165971062398[/C][C]10[/C][/ROW]
[ROW][C]21[/C][C]228.75[/C][C]5.56027577253743[/C][C]13[/C][/ROW]
[ROW][C]22[/C][C]223[/C][C]6.78232998312527[/C][C]15[/C][/ROW]
[ROW][C]23[/C][C]199.5[/C][C]8.06225774829855[/C][C]18[/C][/ROW]
[ROW][C]24[/C][C]181.5[/C][C]14.5258390463339[/C][C]32[/C][/ROW]
[ROW][C]25[/C][C]173.25[/C][C]5.1234753829798[/C][C]11[/C][/ROW]
[ROW][C]26[/C][C]146.5[/C][C]9.03696114115064[/C][C]19[/C][/ROW]
[ROW][C]27[/C][C]132.25[/C][C]12.8160056179763[/C][C]30[/C][/ROW]
[ROW][C]28[/C][C]128.25[/C][C]6.18465843842649[/C][C]12[/C][/ROW]
[ROW][C]29[/C][C]105.25[/C][C]6.8495741960115[/C][C]16[/C][/ROW]
[ROW][C]30[/C][C]110[/C][C]9.8657657246325[/C][C]24[/C][/ROW]
[/TABLE]
Source: https://freestatistics.org/blog/index.php?pk=78021&T=1

Globally Unique Identifier (entire table): ba.freestatistics.org/blog/index.php?pk=78021&T=1

As an alternative you can also use a QR Code:  

The GUIDs for individual cells are displayed in the table below:

Standard Deviation-Mean Plot
SectionMeanStandard DeviationRange
1347.251.707825127659934
2354.2512.526638282742426
33411.41421356237313
43403.464101615137758
5343.515.264337522473732
6334.754.5734742446707510
7320.57.8528126595931617
8309.2514.314910641239330
93095.1639777949432212
10309.751.707825127659934
11293.7515.649813630413234
122925.1639777949432212
13288.55.802298395176413
14268.59.110433579144321
15275.54.123105625617668
16282.254.59
17255.2510.078855755160624
18260.754.510
192617.6157731058639118
20231.254.9916597106239810
21228.755.5602757725374313
222236.7823299831252715
23199.58.0622577482985518
24181.514.525839046333932
25173.255.123475382979811
26146.59.0369611411506419
27132.2512.816005617976330
28128.256.1846584384264912
29105.256.849574196011516
301109.865765724632524


Regression: S.E.(k) = alpha + beta * Mean(k)
alpha9.86733054859569
beta-0.00937541137563665
S.D.0.00994364654297592
T-STAT-0.94285444832704
p-value0.353820112149839

\begin{tabular}{lllllllll}
\hline
Regression: S.E.(k) = alpha + beta * Mean(k) \tabularnewline
alpha & 9.86733054859569 \tabularnewline
beta & -0.00937541137563665 \tabularnewline
S.D. & 0.00994364654297592 \tabularnewline
T-STAT & -0.94285444832704 \tabularnewline
p-value & 0.353820112149839 \tabularnewline
\hline
\end{tabular}
%Source: https://freestatistics.org/blog/index.php?pk=78021&T=2

[TABLE]
[ROW][C]Regression: S.E.(k) = alpha + beta * Mean(k)[/C][/ROW]
[ROW][C]alpha[/C][C]9.86733054859569[/C][/ROW]
[ROW][C]beta[/C][C]-0.00937541137563665[/C][/ROW]
[ROW][C]S.D.[/C][C]0.00994364654297592[/C][/ROW]
[ROW][C]T-STAT[/C][C]-0.94285444832704[/C][/ROW]
[ROW][C]p-value[/C][C]0.353820112149839[/C][/ROW]
[/TABLE]
Source: https://freestatistics.org/blog/index.php?pk=78021&T=2

Globally Unique Identifier (entire table): ba.freestatistics.org/blog/index.php?pk=78021&T=2

As an alternative you can also use a QR Code:  

The GUIDs for individual cells are displayed in the table below:

Regression: S.E.(k) = alpha + beta * Mean(k)
alpha9.86733054859569
beta-0.00937541137563665
S.D.0.00994364654297592
T-STAT-0.94285444832704
p-value0.353820112149839


Regression: ln S.E.(k) = alpha + beta * ln Mean(k)
alpha4.75316246797811
beta-0.530163514954486
S.D.0.315834173139326
T-STAT-1.67861352584102
p-value0.104355443476231
Lambda1.53016351495449

\begin{tabular}{lllllllll}
\hline
Regression: ln S.E.(k) = alpha + beta * ln Mean(k) \tabularnewline
alpha & 4.75316246797811 \tabularnewline
beta & -0.530163514954486 \tabularnewline
S.D. & 0.315834173139326 \tabularnewline
T-STAT & -1.67861352584102 \tabularnewline
p-value & 0.104355443476231 \tabularnewline
Lambda & 1.53016351495449 \tabularnewline
\hline
\end{tabular}
%Source: https://freestatistics.org/blog/index.php?pk=78021&T=3

[TABLE]
[ROW][C]Regression: ln S.E.(k) = alpha + beta * ln Mean(k)[/C][/ROW]
[ROW][C]alpha[/C][C]4.75316246797811[/C][/ROW]
[ROW][C]beta[/C][C]-0.530163514954486[/C][/ROW]
[ROW][C]S.D.[/C][C]0.315834173139326[/C][/ROW]
[ROW][C]T-STAT[/C][C]-1.67861352584102[/C][/ROW]
[ROW][C]p-value[/C][C]0.104355443476231[/C][/ROW]
[ROW][C]Lambda[/C][C]1.53016351495449[/C][/ROW]
[/TABLE]
Source: https://freestatistics.org/blog/index.php?pk=78021&T=3

Globally Unique Identifier (entire table): ba.freestatistics.org/blog/index.php?pk=78021&T=3

As an alternative you can also use a QR Code:  

The GUIDs for individual cells are displayed in the table below:

Regression: ln S.E.(k) = alpha + beta * ln Mean(k)
alpha4.75316246797811
beta-0.530163514954486
S.D.0.315834173139326
T-STAT-1.67861352584102
p-value0.104355443476231
Lambda1.53016351495449


Parameters (Session):
par1 = 4 ;
Parameters (R input):
par1 = 4 ;
R code (references can be found in the software module):
par1 <- as.numeric(par1)
(n <- length(x))
(np <- floor(n / par1))
arr <- array(NA,dim=c(par1,np))
j <- 0
k <- 1
for (i in 1:(np*par1))
{
j = j + 1
arr[j,k] <- x[i]
if (j == par1) {
j = 0
k=k+1
}
}
arr
arr.mean <- array(NA,dim=np)
arr.sd <- array(NA,dim=np)
arr.range <- array(NA,dim=np)
for (j in 1:np)
{
arr.mean[j] <- mean(arr[,j],na.rm=TRUE)
arr.sd[j] <- sd(arr[,j],na.rm=TRUE)
arr.range[j] <- max(arr[,j],na.rm=TRUE) - min(arr[,j],na.rm=TRUE)
}
arr.mean
arr.sd
arr.range
(lm1 <- lm(arr.sd~arr.mean))
(lnlm1 <- lm(log(arr.sd)~log(arr.mean)))
(lm2 <- lm(arr.range~arr.mean))
bitmap(file='test1.png')
plot(arr.mean,arr.sd,main='Standard Deviation-Mean Plot',xlab='mean',ylab='standard deviation')
dev.off()
bitmap(file='test2.png')
plot(arr.mean,arr.range,main='Range-Mean Plot',xlab='mean',ylab='range')
dev.off()
load(file='createtable')
a<-table.start()
a<-table.row.start(a)
a<-table.element(a,'Standard Deviation-Mean Plot',4,TRUE)
a<-table.row.end(a)
a<-table.row.start(a)
a<-table.element(a,'Section',header=TRUE)
a<-table.element(a,'Mean',header=TRUE)
a<-table.element(a,'Standard Deviation',header=TRUE)
a<-table.element(a,'Range',header=TRUE)
a<-table.row.end(a)
for (j in 1:np) {
a<-table.row.start(a)
a<-table.element(a,j,header=TRUE)
a<-table.element(a,arr.mean[j])
a<-table.element(a,arr.sd[j] )
a<-table.element(a,arr.range[j] )
a<-table.row.end(a)
}
a<-table.end(a)
table.save(a,file='mytable.tab')
a<-table.start()
a<-table.row.start(a)
a<-table.element(a,'Regression: S.E.(k) = alpha + beta * Mean(k)',2,TRUE)
a<-table.row.end(a)
a<-table.row.start(a)
a<-table.element(a,'alpha',header=TRUE)
a<-table.element(a,lm1$coefficients[[1]])
a<-table.row.end(a)
a<-table.row.start(a)
a<-table.element(a,'beta',header=TRUE)
a<-table.element(a,lm1$coefficients[[2]])
a<-table.row.end(a)
a<-table.row.start(a)
a<-table.element(a,'S.D.',header=TRUE)
a<-table.element(a,summary(lm1)$coefficients[2,2])
a<-table.row.end(a)
a<-table.row.start(a)
a<-table.element(a,'T-STAT',header=TRUE)
a<-table.element(a,summary(lm1)$coefficients[2,3])
a<-table.row.end(a)
a<-table.row.start(a)
a<-table.element(a,'p-value',header=TRUE)
a<-table.element(a,summary(lm1)$coefficients[2,4])
a<-table.row.end(a)
a<-table.end(a)
table.save(a,file='mytable1.tab')
a<-table.start()
a<-table.row.start(a)
a<-table.element(a,'Regression: ln S.E.(k) = alpha + beta * ln Mean(k)',2,TRUE)
a<-table.row.end(a)
a<-table.row.start(a)
a<-table.element(a,'alpha',header=TRUE)
a<-table.element(a,lnlm1$coefficients[[1]])
a<-table.row.end(a)
a<-table.row.start(a)
a<-table.element(a,'beta',header=TRUE)
a<-table.element(a,lnlm1$coefficients[[2]])
a<-table.row.end(a)
a<-table.row.start(a)
a<-table.element(a,'S.D.',header=TRUE)
a<-table.element(a,summary(lnlm1)$coefficients[2,2])
a<-table.row.end(a)
a<-table.row.start(a)
a<-table.element(a,'T-STAT',header=TRUE)
a<-table.element(a,summary(lnlm1)$coefficients[2,3])
a<-table.row.end(a)
a<-table.row.start(a)
a<-table.element(a,'p-value',header=TRUE)
a<-table.element(a,summary(lnlm1)$coefficients[2,4])
a<-table.row.end(a)
a<-table.row.start(a)
a<-table.element(a,'Lambda',header=TRUE)
a<-table.element(a,1-lnlm1$coefficients[[2]])
a<-table.row.end(a)
a<-table.end(a)
table.save(a,file='mytable2.tab')