Free Statistics

of Irreproducible Research!

Author's title

Author*Unverified author*
R Software Modulerwasp_autocorrelation.wasp
Title produced by software(Partial) Autocorrelation Function
Date of computationThu, 08 Jul 2010 15:08:12 +0000
Cite this page as followsStatistical Computations at FreeStatistics.org, Office for Research Development and Education, URL https://freestatistics.org/blog/index.php?v=date/2010/Jul/08/t1278601688i1bl5u7ipdzy7kx.htm/, Retrieved Thu, 09 May 2024 01:43:47 +0000
Statistical Computations at FreeStatistics.org, Office for Research Development and Education, URL https://freestatistics.org/blog/index.php?pk=77968, Retrieved Thu, 09 May 2024 01:43:47 +0000
QR Codes:

Original text written by user:
IsPrivate?No (this computation is public)
User-defined keywords
Estimated Impact191
Family? (F = Feedback message, R = changed R code, M = changed R Module, P = changed Parameters, D = changed Data)
-       [(Partial) Autocorrelation Function] [Kelly Janbroers -...] [2010-07-08 15:08:12] [413e0fefcf22560c5655fbc122c1a3c2] [Current]
Feedback Forum

Post a new message
Dataseries X:
268
267
266
264
262
261
262
264
265
265
266
268
260
264
265
262
258
265
273
273
270
263
260
257
248
248
237
228
225
231
243
250
246
240
236
235
225
230
225
221
231
234
249
257
253
252
245
239
229
232
222
218
223
221
230
234
237
226
215
211
203
202
187
179
181
172
182
180
175
163
160
151
145
140
125
122
124
108
115
116
104
98
101
91


Summary of computational transaction
Raw Inputview raw input (R code)
Raw Outputview raw output of R engine
Computing time2 seconds
R Server'George Udny Yule' @ 72.249.76.132

\begin{tabular}{lllllllll}
\hline
Summary of computational transaction \tabularnewline
Raw Input & view raw input (R code)  \tabularnewline
Raw Output & view raw output of R engine  \tabularnewline
Computing time & 2 seconds \tabularnewline
R Server & 'George Udny Yule' @ 72.249.76.132 \tabularnewline
\hline
\end{tabular}
%Source: https://freestatistics.org/blog/index.php?pk=77968&T=0

[TABLE]
[ROW][C]Summary of computational transaction[/C][/ROW]
[ROW][C]Raw Input[/C][C]view raw input (R code) [/C][/ROW]
[ROW][C]Raw Output[/C][C]view raw output of R engine [/C][/ROW]
[ROW][C]Computing time[/C][C]2 seconds[/C][/ROW]
[ROW][C]R Server[/C][C]'George Udny Yule' @ 72.249.76.132[/C][/ROW]
[/TABLE]
Source: https://freestatistics.org/blog/index.php?pk=77968&T=0

Globally Unique Identifier (entire table): ba.freestatistics.org/blog/index.php?pk=77968&T=0

As an alternative you can also use a QR Code:  

The GUIDs for individual cells are displayed in the table below:

Summary of computational transaction
Raw Inputview raw input (R code)
Raw Outputview raw output of R engine
Computing time2 seconds
R Server'George Udny Yule' @ 72.249.76.132


Autocorrelation Function
Time lag kACF(k)T-STATP-value
10.1579841.43930.076912
20.1127331.0270.153692
30.1242761.13220.130403
4-0.17824-1.62380.054101
5-0.082657-0.7530.226778
6-0.058325-0.53140.298291
7-0.074194-0.67590.250478
8-0.189863-1.72970.043697
90.0292110.26610.395402
100.0882810.80430.211768
110.193951.7670.040455
120.6430995.85890
130.058440.53240.297932
140.1116431.01710.156028
15-0.011895-0.10840.456983
16-0.234532-2.13670.017784
17-0.113779-1.03660.151473
18-0.147667-1.34530.091094
19-0.134376-1.22420.112165
20-0.173246-1.57830.059145
21-0.008712-0.07940.468466
220.0163170.14870.441094
230.159921.45690.074453
240.3815183.47580.000406
250.0364530.33210.370323
260.0989590.90160.184949
27-0.024104-0.21960.413361
28-0.255914-2.33150.011076
29-0.051008-0.46470.321679
30-0.072758-0.66290.25463
31-0.113279-1.0320.152531
32-0.133418-1.21550.113811
330.0109820.10.460274
34-0.034806-0.31710.375985
350.0894810.81520.208644
360.2485052.2640.013092
370.0110340.10050.460086
380.0375450.34210.366588
39-0.030522-0.27810.390825
40-0.224377-2.04420.022053
410.02950.26880.39439
42-0.039319-0.35820.360548
43-0.098587-0.89820.185846
44-0.067342-0.61350.270607
45-0.004338-0.03950.484285
46-0.021992-0.20040.420846
470.0613760.55920.288777
480.0947440.86320.19527
490.0039020.03550.485864
50-0.004559-0.04150.483486
51-0.051067-0.46520.321489
52-0.114517-1.04330.14992
530.0441330.40210.344331
54-0.067656-0.61640.269666
55-0.063346-0.57710.282714
56-0.033584-0.3060.3802
57-0.009335-0.0850.466216
58-0.035729-0.32550.372809
590.0058670.05350.478751
60-0.023851-0.21730.414258

\begin{tabular}{lllllllll}
\hline
Autocorrelation Function \tabularnewline
Time lag k & ACF(k) & T-STAT & P-value \tabularnewline
1 & 0.157984 & 1.4393 & 0.076912 \tabularnewline
2 & 0.112733 & 1.027 & 0.153692 \tabularnewline
3 & 0.124276 & 1.1322 & 0.130403 \tabularnewline
4 & -0.17824 & -1.6238 & 0.054101 \tabularnewline
5 & -0.082657 & -0.753 & 0.226778 \tabularnewline
6 & -0.058325 & -0.5314 & 0.298291 \tabularnewline
7 & -0.074194 & -0.6759 & 0.250478 \tabularnewline
8 & -0.189863 & -1.7297 & 0.043697 \tabularnewline
9 & 0.029211 & 0.2661 & 0.395402 \tabularnewline
10 & 0.088281 & 0.8043 & 0.211768 \tabularnewline
11 & 0.19395 & 1.767 & 0.040455 \tabularnewline
12 & 0.643099 & 5.8589 & 0 \tabularnewline
13 & 0.05844 & 0.5324 & 0.297932 \tabularnewline
14 & 0.111643 & 1.0171 & 0.156028 \tabularnewline
15 & -0.011895 & -0.1084 & 0.456983 \tabularnewline
16 & -0.234532 & -2.1367 & 0.017784 \tabularnewline
17 & -0.113779 & -1.0366 & 0.151473 \tabularnewline
18 & -0.147667 & -1.3453 & 0.091094 \tabularnewline
19 & -0.134376 & -1.2242 & 0.112165 \tabularnewline
20 & -0.173246 & -1.5783 & 0.059145 \tabularnewline
21 & -0.008712 & -0.0794 & 0.468466 \tabularnewline
22 & 0.016317 & 0.1487 & 0.441094 \tabularnewline
23 & 0.15992 & 1.4569 & 0.074453 \tabularnewline
24 & 0.381518 & 3.4758 & 0.000406 \tabularnewline
25 & 0.036453 & 0.3321 & 0.370323 \tabularnewline
26 & 0.098959 & 0.9016 & 0.184949 \tabularnewline
27 & -0.024104 & -0.2196 & 0.413361 \tabularnewline
28 & -0.255914 & -2.3315 & 0.011076 \tabularnewline
29 & -0.051008 & -0.4647 & 0.321679 \tabularnewline
30 & -0.072758 & -0.6629 & 0.25463 \tabularnewline
31 & -0.113279 & -1.032 & 0.152531 \tabularnewline
32 & -0.133418 & -1.2155 & 0.113811 \tabularnewline
33 & 0.010982 & 0.1 & 0.460274 \tabularnewline
34 & -0.034806 & -0.3171 & 0.375985 \tabularnewline
35 & 0.089481 & 0.8152 & 0.208644 \tabularnewline
36 & 0.248505 & 2.264 & 0.013092 \tabularnewline
37 & 0.011034 & 0.1005 & 0.460086 \tabularnewline
38 & 0.037545 & 0.3421 & 0.366588 \tabularnewline
39 & -0.030522 & -0.2781 & 0.390825 \tabularnewline
40 & -0.224377 & -2.0442 & 0.022053 \tabularnewline
41 & 0.0295 & 0.2688 & 0.39439 \tabularnewline
42 & -0.039319 & -0.3582 & 0.360548 \tabularnewline
43 & -0.098587 & -0.8982 & 0.185846 \tabularnewline
44 & -0.067342 & -0.6135 & 0.270607 \tabularnewline
45 & -0.004338 & -0.0395 & 0.484285 \tabularnewline
46 & -0.021992 & -0.2004 & 0.420846 \tabularnewline
47 & 0.061376 & 0.5592 & 0.288777 \tabularnewline
48 & 0.094744 & 0.8632 & 0.19527 \tabularnewline
49 & 0.003902 & 0.0355 & 0.485864 \tabularnewline
50 & -0.004559 & -0.0415 & 0.483486 \tabularnewline
51 & -0.051067 & -0.4652 & 0.321489 \tabularnewline
52 & -0.114517 & -1.0433 & 0.14992 \tabularnewline
53 & 0.044133 & 0.4021 & 0.344331 \tabularnewline
54 & -0.067656 & -0.6164 & 0.269666 \tabularnewline
55 & -0.063346 & -0.5771 & 0.282714 \tabularnewline
56 & -0.033584 & -0.306 & 0.3802 \tabularnewline
57 & -0.009335 & -0.085 & 0.466216 \tabularnewline
58 & -0.035729 & -0.3255 & 0.372809 \tabularnewline
59 & 0.005867 & 0.0535 & 0.478751 \tabularnewline
60 & -0.023851 & -0.2173 & 0.414258 \tabularnewline
\hline
\end{tabular}
%Source: https://freestatistics.org/blog/index.php?pk=77968&T=1

[TABLE]
[ROW][C]Autocorrelation Function[/C][/ROW]
[ROW][C]Time lag k[/C][C]ACF(k)[/C][C]T-STAT[/C][C]P-value[/C][/ROW]
[ROW][C]1[/C][C]0.157984[/C][C]1.4393[/C][C]0.076912[/C][/ROW]
[ROW][C]2[/C][C]0.112733[/C][C]1.027[/C][C]0.153692[/C][/ROW]
[ROW][C]3[/C][C]0.124276[/C][C]1.1322[/C][C]0.130403[/C][/ROW]
[ROW][C]4[/C][C]-0.17824[/C][C]-1.6238[/C][C]0.054101[/C][/ROW]
[ROW][C]5[/C][C]-0.082657[/C][C]-0.753[/C][C]0.226778[/C][/ROW]
[ROW][C]6[/C][C]-0.058325[/C][C]-0.5314[/C][C]0.298291[/C][/ROW]
[ROW][C]7[/C][C]-0.074194[/C][C]-0.6759[/C][C]0.250478[/C][/ROW]
[ROW][C]8[/C][C]-0.189863[/C][C]-1.7297[/C][C]0.043697[/C][/ROW]
[ROW][C]9[/C][C]0.029211[/C][C]0.2661[/C][C]0.395402[/C][/ROW]
[ROW][C]10[/C][C]0.088281[/C][C]0.8043[/C][C]0.211768[/C][/ROW]
[ROW][C]11[/C][C]0.19395[/C][C]1.767[/C][C]0.040455[/C][/ROW]
[ROW][C]12[/C][C]0.643099[/C][C]5.8589[/C][C]0[/C][/ROW]
[ROW][C]13[/C][C]0.05844[/C][C]0.5324[/C][C]0.297932[/C][/ROW]
[ROW][C]14[/C][C]0.111643[/C][C]1.0171[/C][C]0.156028[/C][/ROW]
[ROW][C]15[/C][C]-0.011895[/C][C]-0.1084[/C][C]0.456983[/C][/ROW]
[ROW][C]16[/C][C]-0.234532[/C][C]-2.1367[/C][C]0.017784[/C][/ROW]
[ROW][C]17[/C][C]-0.113779[/C][C]-1.0366[/C][C]0.151473[/C][/ROW]
[ROW][C]18[/C][C]-0.147667[/C][C]-1.3453[/C][C]0.091094[/C][/ROW]
[ROW][C]19[/C][C]-0.134376[/C][C]-1.2242[/C][C]0.112165[/C][/ROW]
[ROW][C]20[/C][C]-0.173246[/C][C]-1.5783[/C][C]0.059145[/C][/ROW]
[ROW][C]21[/C][C]-0.008712[/C][C]-0.0794[/C][C]0.468466[/C][/ROW]
[ROW][C]22[/C][C]0.016317[/C][C]0.1487[/C][C]0.441094[/C][/ROW]
[ROW][C]23[/C][C]0.15992[/C][C]1.4569[/C][C]0.074453[/C][/ROW]
[ROW][C]24[/C][C]0.381518[/C][C]3.4758[/C][C]0.000406[/C][/ROW]
[ROW][C]25[/C][C]0.036453[/C][C]0.3321[/C][C]0.370323[/C][/ROW]
[ROW][C]26[/C][C]0.098959[/C][C]0.9016[/C][C]0.184949[/C][/ROW]
[ROW][C]27[/C][C]-0.024104[/C][C]-0.2196[/C][C]0.413361[/C][/ROW]
[ROW][C]28[/C][C]-0.255914[/C][C]-2.3315[/C][C]0.011076[/C][/ROW]
[ROW][C]29[/C][C]-0.051008[/C][C]-0.4647[/C][C]0.321679[/C][/ROW]
[ROW][C]30[/C][C]-0.072758[/C][C]-0.6629[/C][C]0.25463[/C][/ROW]
[ROW][C]31[/C][C]-0.113279[/C][C]-1.032[/C][C]0.152531[/C][/ROW]
[ROW][C]32[/C][C]-0.133418[/C][C]-1.2155[/C][C]0.113811[/C][/ROW]
[ROW][C]33[/C][C]0.010982[/C][C]0.1[/C][C]0.460274[/C][/ROW]
[ROW][C]34[/C][C]-0.034806[/C][C]-0.3171[/C][C]0.375985[/C][/ROW]
[ROW][C]35[/C][C]0.089481[/C][C]0.8152[/C][C]0.208644[/C][/ROW]
[ROW][C]36[/C][C]0.248505[/C][C]2.264[/C][C]0.013092[/C][/ROW]
[ROW][C]37[/C][C]0.011034[/C][C]0.1005[/C][C]0.460086[/C][/ROW]
[ROW][C]38[/C][C]0.037545[/C][C]0.3421[/C][C]0.366588[/C][/ROW]
[ROW][C]39[/C][C]-0.030522[/C][C]-0.2781[/C][C]0.390825[/C][/ROW]
[ROW][C]40[/C][C]-0.224377[/C][C]-2.0442[/C][C]0.022053[/C][/ROW]
[ROW][C]41[/C][C]0.0295[/C][C]0.2688[/C][C]0.39439[/C][/ROW]
[ROW][C]42[/C][C]-0.039319[/C][C]-0.3582[/C][C]0.360548[/C][/ROW]
[ROW][C]43[/C][C]-0.098587[/C][C]-0.8982[/C][C]0.185846[/C][/ROW]
[ROW][C]44[/C][C]-0.067342[/C][C]-0.6135[/C][C]0.270607[/C][/ROW]
[ROW][C]45[/C][C]-0.004338[/C][C]-0.0395[/C][C]0.484285[/C][/ROW]
[ROW][C]46[/C][C]-0.021992[/C][C]-0.2004[/C][C]0.420846[/C][/ROW]
[ROW][C]47[/C][C]0.061376[/C][C]0.5592[/C][C]0.288777[/C][/ROW]
[ROW][C]48[/C][C]0.094744[/C][C]0.8632[/C][C]0.19527[/C][/ROW]
[ROW][C]49[/C][C]0.003902[/C][C]0.0355[/C][C]0.485864[/C][/ROW]
[ROW][C]50[/C][C]-0.004559[/C][C]-0.0415[/C][C]0.483486[/C][/ROW]
[ROW][C]51[/C][C]-0.051067[/C][C]-0.4652[/C][C]0.321489[/C][/ROW]
[ROW][C]52[/C][C]-0.114517[/C][C]-1.0433[/C][C]0.14992[/C][/ROW]
[ROW][C]53[/C][C]0.044133[/C][C]0.4021[/C][C]0.344331[/C][/ROW]
[ROW][C]54[/C][C]-0.067656[/C][C]-0.6164[/C][C]0.269666[/C][/ROW]
[ROW][C]55[/C][C]-0.063346[/C][C]-0.5771[/C][C]0.282714[/C][/ROW]
[ROW][C]56[/C][C]-0.033584[/C][C]-0.306[/C][C]0.3802[/C][/ROW]
[ROW][C]57[/C][C]-0.009335[/C][C]-0.085[/C][C]0.466216[/C][/ROW]
[ROW][C]58[/C][C]-0.035729[/C][C]-0.3255[/C][C]0.372809[/C][/ROW]
[ROW][C]59[/C][C]0.005867[/C][C]0.0535[/C][C]0.478751[/C][/ROW]
[ROW][C]60[/C][C]-0.023851[/C][C]-0.2173[/C][C]0.414258[/C][/ROW]
[/TABLE]
Source: https://freestatistics.org/blog/index.php?pk=77968&T=1

Globally Unique Identifier (entire table): ba.freestatistics.org/blog/index.php?pk=77968&T=1

As an alternative you can also use a QR Code:  

The GUIDs for individual cells are displayed in the table below:

Autocorrelation Function
Time lag kACF(k)T-STATP-value
10.1579841.43930.076912
20.1127331.0270.153692
30.1242761.13220.130403
4-0.17824-1.62380.054101
5-0.082657-0.7530.226778
6-0.058325-0.53140.298291
7-0.074194-0.67590.250478
8-0.189863-1.72970.043697
90.0292110.26610.395402
100.0882810.80430.211768
110.193951.7670.040455
120.6430995.85890
130.058440.53240.297932
140.1116431.01710.156028
15-0.011895-0.10840.456983
16-0.234532-2.13670.017784
17-0.113779-1.03660.151473
18-0.147667-1.34530.091094
19-0.134376-1.22420.112165
20-0.173246-1.57830.059145
21-0.008712-0.07940.468466
220.0163170.14870.441094
230.159921.45690.074453
240.3815183.47580.000406
250.0364530.33210.370323
260.0989590.90160.184949
27-0.024104-0.21960.413361
28-0.255914-2.33150.011076
29-0.051008-0.46470.321679
30-0.072758-0.66290.25463
31-0.113279-1.0320.152531
32-0.133418-1.21550.113811
330.0109820.10.460274
34-0.034806-0.31710.375985
350.0894810.81520.208644
360.2485052.2640.013092
370.0110340.10050.460086
380.0375450.34210.366588
39-0.030522-0.27810.390825
40-0.224377-2.04420.022053
410.02950.26880.39439
42-0.039319-0.35820.360548
43-0.098587-0.89820.185846
44-0.067342-0.61350.270607
45-0.004338-0.03950.484285
46-0.021992-0.20040.420846
470.0613760.55920.288777
480.0947440.86320.19527
490.0039020.03550.485864
50-0.004559-0.04150.483486
51-0.051067-0.46520.321489
52-0.114517-1.04330.14992
530.0441330.40210.344331
54-0.067656-0.61640.269666
55-0.063346-0.57710.282714
56-0.033584-0.3060.3802
57-0.009335-0.0850.466216
58-0.035729-0.32550.372809
590.0058670.05350.478751
60-0.023851-0.21730.414258


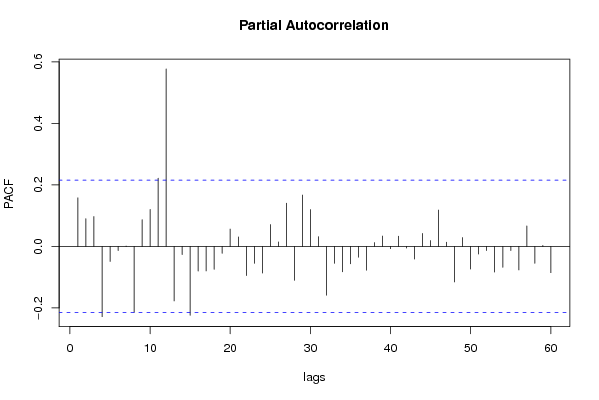
Partial Autocorrelation Function
Time lag kPACF(k)T-STATP-value
10.1579841.43930.076912
20.090020.82010.207247
30.0970360.8840.189614
4-0.228516-2.08190.020217
5-0.049082-0.44720.327962
6-0.01358-0.12370.450918
70.0010360.00940.496248
8-0.214439-1.95360.027057
90.0869490.79210.215268
100.1202271.09530.138272
110.2218162.02080.02326
120.5769965.25671e-06
13-0.177563-1.61770.054764
14-0.026799-0.24420.403858
15-0.224254-2.04310.02211
16-0.0803-0.73160.233247
17-0.079821-0.72720.234573
18-0.074386-0.67770.249927
19-0.02237-0.20380.419506
200.0563410.51330.304556
210.0308120.28070.389814
22-0.094804-0.86370.195118
23-0.055152-0.50250.308338
24-0.086764-0.79050.215758
250.0710180.6470.259706
260.014460.13170.447756
270.1403941.27910.102222
28-0.110379-1.00560.158765
290.1668631.52020.066131
300.1196721.09030.139376
310.0313440.28560.387963
32-0.15886-1.44730.075793
33-0.055073-0.50170.308591
34-0.082517-0.75180.227159
35-0.056669-0.51630.303517
36-0.035214-0.32080.37458
37-0.077596-0.70690.240795
380.0122750.11180.455614
390.0335240.30540.380405
40-0.007564-0.06890.472612
410.0330070.30070.382195
42-0.005308-0.04840.480775
43-0.04108-0.37430.354583
440.0422470.38490.350654
450.0187570.17090.432364
460.1180171.07520.142704
470.0137420.12520.450335
48-0.115731-1.05440.147389
490.0287010.26150.397184
50-0.073842-0.67270.251494
51-0.0251-0.22870.409842
52-0.013637-0.12420.450713
53-0.08346-0.76040.224597
54-0.068242-0.62170.267918
55-0.013776-0.12550.450212
56-0.076529-0.69720.243808
570.066340.60440.273618
58-0.054882-0.50.309201
590.0028850.02630.489547
60-0.08559-0.77980.218875

\begin{tabular}{lllllllll}
\hline
Partial Autocorrelation Function \tabularnewline
Time lag k & PACF(k) & T-STAT & P-value \tabularnewline
1 & 0.157984 & 1.4393 & 0.076912 \tabularnewline
2 & 0.09002 & 0.8201 & 0.207247 \tabularnewline
3 & 0.097036 & 0.884 & 0.189614 \tabularnewline
4 & -0.228516 & -2.0819 & 0.020217 \tabularnewline
5 & -0.049082 & -0.4472 & 0.327962 \tabularnewline
6 & -0.01358 & -0.1237 & 0.450918 \tabularnewline
7 & 0.001036 & 0.0094 & 0.496248 \tabularnewline
8 & -0.214439 & -1.9536 & 0.027057 \tabularnewline
9 & 0.086949 & 0.7921 & 0.215268 \tabularnewline
10 & 0.120227 & 1.0953 & 0.138272 \tabularnewline
11 & 0.221816 & 2.0208 & 0.02326 \tabularnewline
12 & 0.576996 & 5.2567 & 1e-06 \tabularnewline
13 & -0.177563 & -1.6177 & 0.054764 \tabularnewline
14 & -0.026799 & -0.2442 & 0.403858 \tabularnewline
15 & -0.224254 & -2.0431 & 0.02211 \tabularnewline
16 & -0.0803 & -0.7316 & 0.233247 \tabularnewline
17 & -0.079821 & -0.7272 & 0.234573 \tabularnewline
18 & -0.074386 & -0.6777 & 0.249927 \tabularnewline
19 & -0.02237 & -0.2038 & 0.419506 \tabularnewline
20 & 0.056341 & 0.5133 & 0.304556 \tabularnewline
21 & 0.030812 & 0.2807 & 0.389814 \tabularnewline
22 & -0.094804 & -0.8637 & 0.195118 \tabularnewline
23 & -0.055152 & -0.5025 & 0.308338 \tabularnewline
24 & -0.086764 & -0.7905 & 0.215758 \tabularnewline
25 & 0.071018 & 0.647 & 0.259706 \tabularnewline
26 & 0.01446 & 0.1317 & 0.447756 \tabularnewline
27 & 0.140394 & 1.2791 & 0.102222 \tabularnewline
28 & -0.110379 & -1.0056 & 0.158765 \tabularnewline
29 & 0.166863 & 1.5202 & 0.066131 \tabularnewline
30 & 0.119672 & 1.0903 & 0.139376 \tabularnewline
31 & 0.031344 & 0.2856 & 0.387963 \tabularnewline
32 & -0.15886 & -1.4473 & 0.075793 \tabularnewline
33 & -0.055073 & -0.5017 & 0.308591 \tabularnewline
34 & -0.082517 & -0.7518 & 0.227159 \tabularnewline
35 & -0.056669 & -0.5163 & 0.303517 \tabularnewline
36 & -0.035214 & -0.3208 & 0.37458 \tabularnewline
37 & -0.077596 & -0.7069 & 0.240795 \tabularnewline
38 & 0.012275 & 0.1118 & 0.455614 \tabularnewline
39 & 0.033524 & 0.3054 & 0.380405 \tabularnewline
40 & -0.007564 & -0.0689 & 0.472612 \tabularnewline
41 & 0.033007 & 0.3007 & 0.382195 \tabularnewline
42 & -0.005308 & -0.0484 & 0.480775 \tabularnewline
43 & -0.04108 & -0.3743 & 0.354583 \tabularnewline
44 & 0.042247 & 0.3849 & 0.350654 \tabularnewline
45 & 0.018757 & 0.1709 & 0.432364 \tabularnewline
46 & 0.118017 & 1.0752 & 0.142704 \tabularnewline
47 & 0.013742 & 0.1252 & 0.450335 \tabularnewline
48 & -0.115731 & -1.0544 & 0.147389 \tabularnewline
49 & 0.028701 & 0.2615 & 0.397184 \tabularnewline
50 & -0.073842 & -0.6727 & 0.251494 \tabularnewline
51 & -0.0251 & -0.2287 & 0.409842 \tabularnewline
52 & -0.013637 & -0.1242 & 0.450713 \tabularnewline
53 & -0.08346 & -0.7604 & 0.224597 \tabularnewline
54 & -0.068242 & -0.6217 & 0.267918 \tabularnewline
55 & -0.013776 & -0.1255 & 0.450212 \tabularnewline
56 & -0.076529 & -0.6972 & 0.243808 \tabularnewline
57 & 0.06634 & 0.6044 & 0.273618 \tabularnewline
58 & -0.054882 & -0.5 & 0.309201 \tabularnewline
59 & 0.002885 & 0.0263 & 0.489547 \tabularnewline
60 & -0.08559 & -0.7798 & 0.218875 \tabularnewline
\hline
\end{tabular}
%Source: https://freestatistics.org/blog/index.php?pk=77968&T=2

[TABLE]
[ROW][C]Partial Autocorrelation Function[/C][/ROW]
[ROW][C]Time lag k[/C][C]PACF(k)[/C][C]T-STAT[/C][C]P-value[/C][/ROW]
[ROW][C]1[/C][C]0.157984[/C][C]1.4393[/C][C]0.076912[/C][/ROW]
[ROW][C]2[/C][C]0.09002[/C][C]0.8201[/C][C]0.207247[/C][/ROW]
[ROW][C]3[/C][C]0.097036[/C][C]0.884[/C][C]0.189614[/C][/ROW]
[ROW][C]4[/C][C]-0.228516[/C][C]-2.0819[/C][C]0.020217[/C][/ROW]
[ROW][C]5[/C][C]-0.049082[/C][C]-0.4472[/C][C]0.327962[/C][/ROW]
[ROW][C]6[/C][C]-0.01358[/C][C]-0.1237[/C][C]0.450918[/C][/ROW]
[ROW][C]7[/C][C]0.001036[/C][C]0.0094[/C][C]0.496248[/C][/ROW]
[ROW][C]8[/C][C]-0.214439[/C][C]-1.9536[/C][C]0.027057[/C][/ROW]
[ROW][C]9[/C][C]0.086949[/C][C]0.7921[/C][C]0.215268[/C][/ROW]
[ROW][C]10[/C][C]0.120227[/C][C]1.0953[/C][C]0.138272[/C][/ROW]
[ROW][C]11[/C][C]0.221816[/C][C]2.0208[/C][C]0.02326[/C][/ROW]
[ROW][C]12[/C][C]0.576996[/C][C]5.2567[/C][C]1e-06[/C][/ROW]
[ROW][C]13[/C][C]-0.177563[/C][C]-1.6177[/C][C]0.054764[/C][/ROW]
[ROW][C]14[/C][C]-0.026799[/C][C]-0.2442[/C][C]0.403858[/C][/ROW]
[ROW][C]15[/C][C]-0.224254[/C][C]-2.0431[/C][C]0.02211[/C][/ROW]
[ROW][C]16[/C][C]-0.0803[/C][C]-0.7316[/C][C]0.233247[/C][/ROW]
[ROW][C]17[/C][C]-0.079821[/C][C]-0.7272[/C][C]0.234573[/C][/ROW]
[ROW][C]18[/C][C]-0.074386[/C][C]-0.6777[/C][C]0.249927[/C][/ROW]
[ROW][C]19[/C][C]-0.02237[/C][C]-0.2038[/C][C]0.419506[/C][/ROW]
[ROW][C]20[/C][C]0.056341[/C][C]0.5133[/C][C]0.304556[/C][/ROW]
[ROW][C]21[/C][C]0.030812[/C][C]0.2807[/C][C]0.389814[/C][/ROW]
[ROW][C]22[/C][C]-0.094804[/C][C]-0.8637[/C][C]0.195118[/C][/ROW]
[ROW][C]23[/C][C]-0.055152[/C][C]-0.5025[/C][C]0.308338[/C][/ROW]
[ROW][C]24[/C][C]-0.086764[/C][C]-0.7905[/C][C]0.215758[/C][/ROW]
[ROW][C]25[/C][C]0.071018[/C][C]0.647[/C][C]0.259706[/C][/ROW]
[ROW][C]26[/C][C]0.01446[/C][C]0.1317[/C][C]0.447756[/C][/ROW]
[ROW][C]27[/C][C]0.140394[/C][C]1.2791[/C][C]0.102222[/C][/ROW]
[ROW][C]28[/C][C]-0.110379[/C][C]-1.0056[/C][C]0.158765[/C][/ROW]
[ROW][C]29[/C][C]0.166863[/C][C]1.5202[/C][C]0.066131[/C][/ROW]
[ROW][C]30[/C][C]0.119672[/C][C]1.0903[/C][C]0.139376[/C][/ROW]
[ROW][C]31[/C][C]0.031344[/C][C]0.2856[/C][C]0.387963[/C][/ROW]
[ROW][C]32[/C][C]-0.15886[/C][C]-1.4473[/C][C]0.075793[/C][/ROW]
[ROW][C]33[/C][C]-0.055073[/C][C]-0.5017[/C][C]0.308591[/C][/ROW]
[ROW][C]34[/C][C]-0.082517[/C][C]-0.7518[/C][C]0.227159[/C][/ROW]
[ROW][C]35[/C][C]-0.056669[/C][C]-0.5163[/C][C]0.303517[/C][/ROW]
[ROW][C]36[/C][C]-0.035214[/C][C]-0.3208[/C][C]0.37458[/C][/ROW]
[ROW][C]37[/C][C]-0.077596[/C][C]-0.7069[/C][C]0.240795[/C][/ROW]
[ROW][C]38[/C][C]0.012275[/C][C]0.1118[/C][C]0.455614[/C][/ROW]
[ROW][C]39[/C][C]0.033524[/C][C]0.3054[/C][C]0.380405[/C][/ROW]
[ROW][C]40[/C][C]-0.007564[/C][C]-0.0689[/C][C]0.472612[/C][/ROW]
[ROW][C]41[/C][C]0.033007[/C][C]0.3007[/C][C]0.382195[/C][/ROW]
[ROW][C]42[/C][C]-0.005308[/C][C]-0.0484[/C][C]0.480775[/C][/ROW]
[ROW][C]43[/C][C]-0.04108[/C][C]-0.3743[/C][C]0.354583[/C][/ROW]
[ROW][C]44[/C][C]0.042247[/C][C]0.3849[/C][C]0.350654[/C][/ROW]
[ROW][C]45[/C][C]0.018757[/C][C]0.1709[/C][C]0.432364[/C][/ROW]
[ROW][C]46[/C][C]0.118017[/C][C]1.0752[/C][C]0.142704[/C][/ROW]
[ROW][C]47[/C][C]0.013742[/C][C]0.1252[/C][C]0.450335[/C][/ROW]
[ROW][C]48[/C][C]-0.115731[/C][C]-1.0544[/C][C]0.147389[/C][/ROW]
[ROW][C]49[/C][C]0.028701[/C][C]0.2615[/C][C]0.397184[/C][/ROW]
[ROW][C]50[/C][C]-0.073842[/C][C]-0.6727[/C][C]0.251494[/C][/ROW]
[ROW][C]51[/C][C]-0.0251[/C][C]-0.2287[/C][C]0.409842[/C][/ROW]
[ROW][C]52[/C][C]-0.013637[/C][C]-0.1242[/C][C]0.450713[/C][/ROW]
[ROW][C]53[/C][C]-0.08346[/C][C]-0.7604[/C][C]0.224597[/C][/ROW]
[ROW][C]54[/C][C]-0.068242[/C][C]-0.6217[/C][C]0.267918[/C][/ROW]
[ROW][C]55[/C][C]-0.013776[/C][C]-0.1255[/C][C]0.450212[/C][/ROW]
[ROW][C]56[/C][C]-0.076529[/C][C]-0.6972[/C][C]0.243808[/C][/ROW]
[ROW][C]57[/C][C]0.06634[/C][C]0.6044[/C][C]0.273618[/C][/ROW]
[ROW][C]58[/C][C]-0.054882[/C][C]-0.5[/C][C]0.309201[/C][/ROW]
[ROW][C]59[/C][C]0.002885[/C][C]0.0263[/C][C]0.489547[/C][/ROW]
[ROW][C]60[/C][C]-0.08559[/C][C]-0.7798[/C][C]0.218875[/C][/ROW]
[/TABLE]
Source: https://freestatistics.org/blog/index.php?pk=77968&T=2

Globally Unique Identifier (entire table): ba.freestatistics.org/blog/index.php?pk=77968&T=2

As an alternative you can also use a QR Code:  

The GUIDs for individual cells are displayed in the table below:

Partial Autocorrelation Function
Time lag kPACF(k)T-STATP-value
10.1579841.43930.076912
20.090020.82010.207247
30.0970360.8840.189614
4-0.228516-2.08190.020217
5-0.049082-0.44720.327962
6-0.01358-0.12370.450918
70.0010360.00940.496248
8-0.214439-1.95360.027057
90.0869490.79210.215268
100.1202271.09530.138272
110.2218162.02080.02326
120.5769965.25671e-06
13-0.177563-1.61770.054764
14-0.026799-0.24420.403858
15-0.224254-2.04310.02211
16-0.0803-0.73160.233247
17-0.079821-0.72720.234573
18-0.074386-0.67770.249927
19-0.02237-0.20380.419506
200.0563410.51330.304556
210.0308120.28070.389814
22-0.094804-0.86370.195118
23-0.055152-0.50250.308338
24-0.086764-0.79050.215758
250.0710180.6470.259706
260.014460.13170.447756
270.1403941.27910.102222
28-0.110379-1.00560.158765
290.1668631.52020.066131
300.1196721.09030.139376
310.0313440.28560.387963
32-0.15886-1.44730.075793
33-0.055073-0.50170.308591
34-0.082517-0.75180.227159
35-0.056669-0.51630.303517
36-0.035214-0.32080.37458
37-0.077596-0.70690.240795
380.0122750.11180.455614
390.0335240.30540.380405
40-0.007564-0.06890.472612
410.0330070.30070.382195
42-0.005308-0.04840.480775
43-0.04108-0.37430.354583
440.0422470.38490.350654
450.0187570.17090.432364
460.1180171.07520.142704
470.0137420.12520.450335
48-0.115731-1.05440.147389
490.0287010.26150.397184
50-0.073842-0.67270.251494
51-0.0251-0.22870.409842
52-0.013637-0.12420.450713
53-0.08346-0.76040.224597
54-0.068242-0.62170.267918
55-0.013776-0.12550.450212
56-0.076529-0.69720.243808
570.066340.60440.273618
58-0.054882-0.50.309201
590.0028850.02630.489547
60-0.08559-0.77980.218875


Parameters (Session):
par1 = 60 ; par2 = 1 ; par3 = 1 ; par4 = 0 ; par5 = 12 ; par6 = White Noise ; par7 = 0.95 ;
Parameters (R input):
par1 = 60 ; par2 = 1 ; par3 = 1 ; par4 = 0 ; par5 = 12 ; par6 = White Noise ; par7 = 0.95 ;
R code (references can be found in the software module):
if (par1 == 'Default') {
par1 = 10*log10(length(x))
} else {
par1 <- as.numeric(par1)
}
par2 <- as.numeric(par2)
par3 <- as.numeric(par3)
par4 <- as.numeric(par4)
par5 <- as.numeric(par5)
if (par6 == 'White Noise') par6 <- 'white' else par6 <- 'ma'
par7 <- as.numeric(par7)
if (par2 == 0) {
x <- log(x)
} else {
x <- (x ^ par2 - 1) / par2
}
if (par3 > 0) x <- diff(x,lag=1,difference=par3)
if (par4 > 0) x <- diff(x,lag=par5,difference=par4)
bitmap(file='pic1.png')
racf <- acf(x, par1, main='Autocorrelation', xlab='time lag', ylab='ACF', ci.type=par6, ci=par7, sub=paste('(lambda=',par2,', d=',par3,', D=',par4,', CI=', par7, ', CI type=',par6,')',sep=''))
dev.off()
bitmap(file='pic2.png')
rpacf <- pacf(x,par1,main='Partial Autocorrelation',xlab='lags',ylab='PACF')
dev.off()
(myacf <- c(racf$acf))
(mypacf <- c(rpacf$acf))
lengthx <- length(x)
sqrtn <- sqrt(lengthx)
load(file='createtable')
a<-table.start()
a<-table.row.start(a)
a<-table.element(a,'Autocorrelation Function',4,TRUE)
a<-table.row.end(a)
a<-table.row.start(a)
a<-table.element(a,'Time lag k',header=TRUE)
a<-table.element(a,hyperlink('basics.htm','ACF(k)','click here for more information about the Autocorrelation Function'),header=TRUE)
a<-table.element(a,'T-STAT',header=TRUE)
a<-table.element(a,'P-value',header=TRUE)
a<-table.row.end(a)
for (i in 2:(par1+1)) {
a<-table.row.start(a)
a<-table.element(a,i-1,header=TRUE)
a<-table.element(a,round(myacf[i],6))
mytstat <- myacf[i]*sqrtn
a<-table.element(a,round(mytstat,4))
a<-table.element(a,round(1-pt(abs(mytstat),lengthx),6))
a<-table.row.end(a)
}
a<-table.end(a)
table.save(a,file='mytable.tab')
a<-table.start()
a<-table.row.start(a)
a<-table.element(a,'Partial Autocorrelation Function',4,TRUE)
a<-table.row.end(a)
a<-table.row.start(a)
a<-table.element(a,'Time lag k',header=TRUE)
a<-table.element(a,hyperlink('basics.htm','PACF(k)','click here for more information about the Partial Autocorrelation Function'),header=TRUE)
a<-table.element(a,'T-STAT',header=TRUE)
a<-table.element(a,'P-value',header=TRUE)
a<-table.row.end(a)
for (i in 1:par1) {
a<-table.row.start(a)
a<-table.element(a,i,header=TRUE)
a<-table.element(a,round(mypacf[i],6))
mytstat <- mypacf[i]*sqrtn
a<-table.element(a,round(mytstat,4))
a<-table.element(a,round(1-pt(abs(mytstat),lengthx),6))
a<-table.row.end(a)
}
a<-table.end(a)
table.save(a,file='mytable1.tab')