Free Statistics

of Irreproducible Research!

Author's title

Author*Unverified author*
R Software Modulerwasp_autocorrelation.wasp
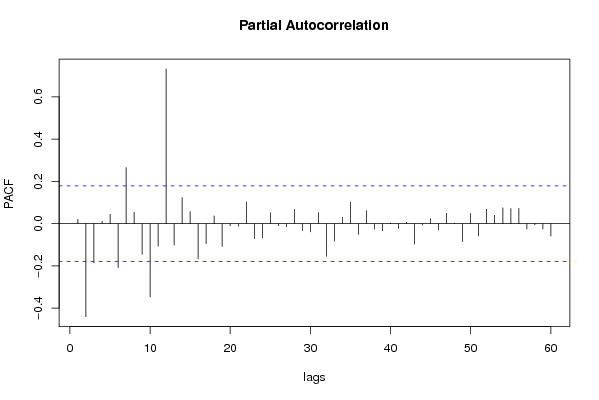
Title produced by software(Partial) Autocorrelation Function
Date of computationWed, 07 Jul 2010 17:51:02 +0000
Cite this page as followsStatistical Computations at FreeStatistics.org, Office for Research Development and Education, URL https://freestatistics.org/blog/index.php?v=date/2010/Jul/07/t1278525063d3fhyzl31nh4kbf.htm/, Retrieved Mon, 06 May 2024 10:13:59 +0000
Statistical Computations at FreeStatistics.org, Office for Research Development and Education, URL https://freestatistics.org/blog/index.php?pk=77950, Retrieved Mon, 06 May 2024 10:13:59 +0000
QR Codes:

Original text written by user:
IsPrivate?No (this computation is public)
User-defined keywords
Estimated Impact201
Family? (F = Feedback message, R = changed R code, M = changed R Module, P = changed Parameters, D = changed Data)
-       [(Partial) Autocorrelation Function] [Kelly Janbroers -...] [2010-07-07 17:51:02] [33a1f6f741f8a3dc4da19fe59306a2dd] [Current]
Feedback Forum

Post a new message
Dataseries X:
33
32
31
29
49
48
33
23
24
24
25
27
24
21
15
21
49
48
35
36
51
50
61
63
61
62
58
65
93
94
86
88
102
107
121
127
125
128
117
127
160
162
153
160
177
178
196
212
212
211
204
216
248
250
240
249
275
277
286
302
290
290
277
285
311
300
291
299
332
337
343
360
353
351
341
348
381
358
353
358
399
409
407
419
418
421
414
424
463
437
430
436
474
489
482
492
502
500
493
504
538
516
502
501
541
571
559
569
576
573
562
570
597
573
562
556
600
630
624
634


Summary of computational transaction
Raw Inputview raw input (R code)
Raw Outputview raw output of R engine
Computing time3 seconds
R Server'George Udny Yule' @ 72.249.76.132

\begin{tabular}{lllllllll}
\hline
Summary of computational transaction \tabularnewline
Raw Input & view raw input (R code)  \tabularnewline
Raw Output & view raw output of R engine  \tabularnewline
Computing time & 3 seconds \tabularnewline
R Server & 'George Udny Yule' @ 72.249.76.132 \tabularnewline
\hline
\end{tabular}
%Source: https://freestatistics.org/blog/index.php?pk=77950&T=0

[TABLE]
[ROW][C]Summary of computational transaction[/C][/ROW]
[ROW][C]Raw Input[/C][C]view raw input (R code) [/C][/ROW]
[ROW][C]Raw Output[/C][C]view raw output of R engine [/C][/ROW]
[ROW][C]Computing time[/C][C]3 seconds[/C][/ROW]
[ROW][C]R Server[/C][C]'George Udny Yule' @ 72.249.76.132[/C][/ROW]
[/TABLE]
Source: https://freestatistics.org/blog/index.php?pk=77950&T=0

Globally Unique Identifier (entire table): ba.freestatistics.org/blog/index.php?pk=77950&T=0

As an alternative you can also use a QR Code:  

The GUIDs for individual cells are displayed in the table below:

Summary of computational transaction
Raw Inputview raw input (R code)
Raw Outputview raw output of R engine
Computing time3 seconds
R Server'George Udny Yule' @ 72.249.76.132


Autocorrelation Function
Time lag kACF(k)T-STATP-value
10.0202440.22080.412797
2-0.439239-4.79152e-06
3-0.171113-1.86660.032208
40.2051422.23780.013546
50.179141.95420.026513
6-0.233725-2.54960.006027
70.0846910.92390.178713
80.169241.84620.033675
9-0.148327-1.61810.054149
10-0.393618-4.29391.8e-05
11-0.010804-0.11790.45319
120.8349519.10820
130.0166320.18140.428166
14-0.424257-4.62815e-06
15-0.16159-1.76270.040255
160.1790831.95360.02655
170.2023292.20720.014611
18-0.206353-2.2510.013109
190.0095840.10450.458455
200.1368821.49320.069015
21-0.13074-1.42620.078214
22-0.309518-3.37640.000496
23-0.035268-0.38470.350563
240.6638377.24160
250.0276560.30170.381707
26-0.377162-4.11433.6e-05
27-0.138183-1.50740.067179
280.157591.71910.044098
290.2060782.24810.013207
30-0.176768-1.92830.028099
31-0.024506-0.26730.394838
320.083010.90550.183506
33-0.131335-1.43270.077283
34-0.222973-2.43230.008245
35-0.007564-0.08250.467189
360.5133795.60030
370.0197180.21510.41503
38-0.339463-3.70310.000162
39-0.101975-1.11240.1341
400.159281.73750.042439
410.1834042.00070.02385
42-0.140503-1.53270.064001
43-0.059599-0.65020.258424
440.0384080.4190.337992
45-0.118813-1.29610.098724
46-0.143534-1.56580.060029
470.0288260.31450.376863
480.3802244.14783.2e-05
49-0.009757-0.10640.457707
50-0.295508-3.22360.000817
51-0.06573-0.7170.237381
520.1822891.98850.024523
530.1663721.81490.036029
54-0.100603-1.09740.13733
55-0.058859-0.64210.261031
560.0290230.31660.376048
57-0.098354-1.07290.14274
58-0.094666-1.03270.151922
590.0617410.67350.250962
600.2735272.98380.001728

\begin{tabular}{lllllllll}
\hline
Autocorrelation Function \tabularnewline
Time lag k & ACF(k) & T-STAT & P-value \tabularnewline
1 & 0.020244 & 0.2208 & 0.412797 \tabularnewline
2 & -0.439239 & -4.7915 & 2e-06 \tabularnewline
3 & -0.171113 & -1.8666 & 0.032208 \tabularnewline
4 & 0.205142 & 2.2378 & 0.013546 \tabularnewline
5 & 0.17914 & 1.9542 & 0.026513 \tabularnewline
6 & -0.233725 & -2.5496 & 0.006027 \tabularnewline
7 & 0.084691 & 0.9239 & 0.178713 \tabularnewline
8 & 0.16924 & 1.8462 & 0.033675 \tabularnewline
9 & -0.148327 & -1.6181 & 0.054149 \tabularnewline
10 & -0.393618 & -4.2939 & 1.8e-05 \tabularnewline
11 & -0.010804 & -0.1179 & 0.45319 \tabularnewline
12 & 0.834951 & 9.1082 & 0 \tabularnewline
13 & 0.016632 & 0.1814 & 0.428166 \tabularnewline
14 & -0.424257 & -4.6281 & 5e-06 \tabularnewline
15 & -0.16159 & -1.7627 & 0.040255 \tabularnewline
16 & 0.179083 & 1.9536 & 0.02655 \tabularnewline
17 & 0.202329 & 2.2072 & 0.014611 \tabularnewline
18 & -0.206353 & -2.251 & 0.013109 \tabularnewline
19 & 0.009584 & 0.1045 & 0.458455 \tabularnewline
20 & 0.136882 & 1.4932 & 0.069015 \tabularnewline
21 & -0.13074 & -1.4262 & 0.078214 \tabularnewline
22 & -0.309518 & -3.3764 & 0.000496 \tabularnewline
23 & -0.035268 & -0.3847 & 0.350563 \tabularnewline
24 & 0.663837 & 7.2416 & 0 \tabularnewline
25 & 0.027656 & 0.3017 & 0.381707 \tabularnewline
26 & -0.377162 & -4.1143 & 3.6e-05 \tabularnewline
27 & -0.138183 & -1.5074 & 0.067179 \tabularnewline
28 & 0.15759 & 1.7191 & 0.044098 \tabularnewline
29 & 0.206078 & 2.2481 & 0.013207 \tabularnewline
30 & -0.176768 & -1.9283 & 0.028099 \tabularnewline
31 & -0.024506 & -0.2673 & 0.394838 \tabularnewline
32 & 0.08301 & 0.9055 & 0.183506 \tabularnewline
33 & -0.131335 & -1.4327 & 0.077283 \tabularnewline
34 & -0.222973 & -2.4323 & 0.008245 \tabularnewline
35 & -0.007564 & -0.0825 & 0.467189 \tabularnewline
36 & 0.513379 & 5.6003 & 0 \tabularnewline
37 & 0.019718 & 0.2151 & 0.41503 \tabularnewline
38 & -0.339463 & -3.7031 & 0.000162 \tabularnewline
39 & -0.101975 & -1.1124 & 0.1341 \tabularnewline
40 & 0.15928 & 1.7375 & 0.042439 \tabularnewline
41 & 0.183404 & 2.0007 & 0.02385 \tabularnewline
42 & -0.140503 & -1.5327 & 0.064001 \tabularnewline
43 & -0.059599 & -0.6502 & 0.258424 \tabularnewline
44 & 0.038408 & 0.419 & 0.337992 \tabularnewline
45 & -0.118813 & -1.2961 & 0.098724 \tabularnewline
46 & -0.143534 & -1.5658 & 0.060029 \tabularnewline
47 & 0.028826 & 0.3145 & 0.376863 \tabularnewline
48 & 0.380224 & 4.1478 & 3.2e-05 \tabularnewline
49 & -0.009757 & -0.1064 & 0.457707 \tabularnewline
50 & -0.295508 & -3.2236 & 0.000817 \tabularnewline
51 & -0.06573 & -0.717 & 0.237381 \tabularnewline
52 & 0.182289 & 1.9885 & 0.024523 \tabularnewline
53 & 0.166372 & 1.8149 & 0.036029 \tabularnewline
54 & -0.100603 & -1.0974 & 0.13733 \tabularnewline
55 & -0.058859 & -0.6421 & 0.261031 \tabularnewline
56 & 0.029023 & 0.3166 & 0.376048 \tabularnewline
57 & -0.098354 & -1.0729 & 0.14274 \tabularnewline
58 & -0.094666 & -1.0327 & 0.151922 \tabularnewline
59 & 0.061741 & 0.6735 & 0.250962 \tabularnewline
60 & 0.273527 & 2.9838 & 0.001728 \tabularnewline
\hline
\end{tabular}
%Source: https://freestatistics.org/blog/index.php?pk=77950&T=1

[TABLE]
[ROW][C]Autocorrelation Function[/C][/ROW]
[ROW][C]Time lag k[/C][C]ACF(k)[/C][C]T-STAT[/C][C]P-value[/C][/ROW]
[ROW][C]1[/C][C]0.020244[/C][C]0.2208[/C][C]0.412797[/C][/ROW]
[ROW][C]2[/C][C]-0.439239[/C][C]-4.7915[/C][C]2e-06[/C][/ROW]
[ROW][C]3[/C][C]-0.171113[/C][C]-1.8666[/C][C]0.032208[/C][/ROW]
[ROW][C]4[/C][C]0.205142[/C][C]2.2378[/C][C]0.013546[/C][/ROW]
[ROW][C]5[/C][C]0.17914[/C][C]1.9542[/C][C]0.026513[/C][/ROW]
[ROW][C]6[/C][C]-0.233725[/C][C]-2.5496[/C][C]0.006027[/C][/ROW]
[ROW][C]7[/C][C]0.084691[/C][C]0.9239[/C][C]0.178713[/C][/ROW]
[ROW][C]8[/C][C]0.16924[/C][C]1.8462[/C][C]0.033675[/C][/ROW]
[ROW][C]9[/C][C]-0.148327[/C][C]-1.6181[/C][C]0.054149[/C][/ROW]
[ROW][C]10[/C][C]-0.393618[/C][C]-4.2939[/C][C]1.8e-05[/C][/ROW]
[ROW][C]11[/C][C]-0.010804[/C][C]-0.1179[/C][C]0.45319[/C][/ROW]
[ROW][C]12[/C][C]0.834951[/C][C]9.1082[/C][C]0[/C][/ROW]
[ROW][C]13[/C][C]0.016632[/C][C]0.1814[/C][C]0.428166[/C][/ROW]
[ROW][C]14[/C][C]-0.424257[/C][C]-4.6281[/C][C]5e-06[/C][/ROW]
[ROW][C]15[/C][C]-0.16159[/C][C]-1.7627[/C][C]0.040255[/C][/ROW]
[ROW][C]16[/C][C]0.179083[/C][C]1.9536[/C][C]0.02655[/C][/ROW]
[ROW][C]17[/C][C]0.202329[/C][C]2.2072[/C][C]0.014611[/C][/ROW]
[ROW][C]18[/C][C]-0.206353[/C][C]-2.251[/C][C]0.013109[/C][/ROW]
[ROW][C]19[/C][C]0.009584[/C][C]0.1045[/C][C]0.458455[/C][/ROW]
[ROW][C]20[/C][C]0.136882[/C][C]1.4932[/C][C]0.069015[/C][/ROW]
[ROW][C]21[/C][C]-0.13074[/C][C]-1.4262[/C][C]0.078214[/C][/ROW]
[ROW][C]22[/C][C]-0.309518[/C][C]-3.3764[/C][C]0.000496[/C][/ROW]
[ROW][C]23[/C][C]-0.035268[/C][C]-0.3847[/C][C]0.350563[/C][/ROW]
[ROW][C]24[/C][C]0.663837[/C][C]7.2416[/C][C]0[/C][/ROW]
[ROW][C]25[/C][C]0.027656[/C][C]0.3017[/C][C]0.381707[/C][/ROW]
[ROW][C]26[/C][C]-0.377162[/C][C]-4.1143[/C][C]3.6e-05[/C][/ROW]
[ROW][C]27[/C][C]-0.138183[/C][C]-1.5074[/C][C]0.067179[/C][/ROW]
[ROW][C]28[/C][C]0.15759[/C][C]1.7191[/C][C]0.044098[/C][/ROW]
[ROW][C]29[/C][C]0.206078[/C][C]2.2481[/C][C]0.013207[/C][/ROW]
[ROW][C]30[/C][C]-0.176768[/C][C]-1.9283[/C][C]0.028099[/C][/ROW]
[ROW][C]31[/C][C]-0.024506[/C][C]-0.2673[/C][C]0.394838[/C][/ROW]
[ROW][C]32[/C][C]0.08301[/C][C]0.9055[/C][C]0.183506[/C][/ROW]
[ROW][C]33[/C][C]-0.131335[/C][C]-1.4327[/C][C]0.077283[/C][/ROW]
[ROW][C]34[/C][C]-0.222973[/C][C]-2.4323[/C][C]0.008245[/C][/ROW]
[ROW][C]35[/C][C]-0.007564[/C][C]-0.0825[/C][C]0.467189[/C][/ROW]
[ROW][C]36[/C][C]0.513379[/C][C]5.6003[/C][C]0[/C][/ROW]
[ROW][C]37[/C][C]0.019718[/C][C]0.2151[/C][C]0.41503[/C][/ROW]
[ROW][C]38[/C][C]-0.339463[/C][C]-3.7031[/C][C]0.000162[/C][/ROW]
[ROW][C]39[/C][C]-0.101975[/C][C]-1.1124[/C][C]0.1341[/C][/ROW]
[ROW][C]40[/C][C]0.15928[/C][C]1.7375[/C][C]0.042439[/C][/ROW]
[ROW][C]41[/C][C]0.183404[/C][C]2.0007[/C][C]0.02385[/C][/ROW]
[ROW][C]42[/C][C]-0.140503[/C][C]-1.5327[/C][C]0.064001[/C][/ROW]
[ROW][C]43[/C][C]-0.059599[/C][C]-0.6502[/C][C]0.258424[/C][/ROW]
[ROW][C]44[/C][C]0.038408[/C][C]0.419[/C][C]0.337992[/C][/ROW]
[ROW][C]45[/C][C]-0.118813[/C][C]-1.2961[/C][C]0.098724[/C][/ROW]
[ROW][C]46[/C][C]-0.143534[/C][C]-1.5658[/C][C]0.060029[/C][/ROW]
[ROW][C]47[/C][C]0.028826[/C][C]0.3145[/C][C]0.376863[/C][/ROW]
[ROW][C]48[/C][C]0.380224[/C][C]4.1478[/C][C]3.2e-05[/C][/ROW]
[ROW][C]49[/C][C]-0.009757[/C][C]-0.1064[/C][C]0.457707[/C][/ROW]
[ROW][C]50[/C][C]-0.295508[/C][C]-3.2236[/C][C]0.000817[/C][/ROW]
[ROW][C]51[/C][C]-0.06573[/C][C]-0.717[/C][C]0.237381[/C][/ROW]
[ROW][C]52[/C][C]0.182289[/C][C]1.9885[/C][C]0.024523[/C][/ROW]
[ROW][C]53[/C][C]0.166372[/C][C]1.8149[/C][C]0.036029[/C][/ROW]
[ROW][C]54[/C][C]-0.100603[/C][C]-1.0974[/C][C]0.13733[/C][/ROW]
[ROW][C]55[/C][C]-0.058859[/C][C]-0.6421[/C][C]0.261031[/C][/ROW]
[ROW][C]56[/C][C]0.029023[/C][C]0.3166[/C][C]0.376048[/C][/ROW]
[ROW][C]57[/C][C]-0.098354[/C][C]-1.0729[/C][C]0.14274[/C][/ROW]
[ROW][C]58[/C][C]-0.094666[/C][C]-1.0327[/C][C]0.151922[/C][/ROW]
[ROW][C]59[/C][C]0.061741[/C][C]0.6735[/C][C]0.250962[/C][/ROW]
[ROW][C]60[/C][C]0.273527[/C][C]2.9838[/C][C]0.001728[/C][/ROW]
[/TABLE]
Source: https://freestatistics.org/blog/index.php?pk=77950&T=1

Globally Unique Identifier (entire table): ba.freestatistics.org/blog/index.php?pk=77950&T=1

As an alternative you can also use a QR Code:  

The GUIDs for individual cells are displayed in the table below:

Autocorrelation Function
Time lag kACF(k)T-STATP-value
10.0202440.22080.412797
2-0.439239-4.79152e-06
3-0.171113-1.86660.032208
40.2051422.23780.013546
50.179141.95420.026513
6-0.233725-2.54960.006027
70.0846910.92390.178713
80.169241.84620.033675
9-0.148327-1.61810.054149
10-0.393618-4.29391.8e-05
11-0.010804-0.11790.45319
120.8349519.10820
130.0166320.18140.428166
14-0.424257-4.62815e-06
15-0.16159-1.76270.040255
160.1790831.95360.02655
170.2023292.20720.014611
18-0.206353-2.2510.013109
190.0095840.10450.458455
200.1368821.49320.069015
21-0.13074-1.42620.078214
22-0.309518-3.37640.000496
23-0.035268-0.38470.350563
240.6638377.24160
250.0276560.30170.381707
26-0.377162-4.11433.6e-05
27-0.138183-1.50740.067179
280.157591.71910.044098
290.2060782.24810.013207
30-0.176768-1.92830.028099
31-0.024506-0.26730.394838
320.083010.90550.183506
33-0.131335-1.43270.077283
34-0.222973-2.43230.008245
35-0.007564-0.08250.467189
360.5133795.60030
370.0197180.21510.41503
38-0.339463-3.70310.000162
39-0.101975-1.11240.1341
400.159281.73750.042439
410.1834042.00070.02385
42-0.140503-1.53270.064001
43-0.059599-0.65020.258424
440.0384080.4190.337992
45-0.118813-1.29610.098724
46-0.143534-1.56580.060029
470.0288260.31450.376863
480.3802244.14783.2e-05
49-0.009757-0.10640.457707
50-0.295508-3.22360.000817
51-0.06573-0.7170.237381
520.1822891.98850.024523
530.1663721.81490.036029
54-0.100603-1.09740.13733
55-0.058859-0.64210.261031
560.0290230.31660.376048
57-0.098354-1.07290.14274
58-0.094666-1.03270.151922
590.0617410.67350.250962
600.2735272.98380.001728


Partial Autocorrelation Function
Time lag kPACF(k)T-STATP-value
10.0202440.22080.412797
2-0.439829-4.7982e-06
3-0.185317-2.02160.022732
40.011710.12770.449287
50.0444540.48490.314308
6-0.207707-2.26580.012635
70.2656462.89790.002237
80.0546840.59650.275975
9-0.144713-1.57860.058537
10-0.346878-3.7840.000122
11-0.106264-1.15920.124346
120.7327217.9930
13-0.100724-1.09880.137044
140.1237121.34950.089862
150.0574130.62630.266159
16-0.166795-1.81950.035673
17-0.093231-1.0170.155602
180.0369620.40320.34376
19-0.107452-1.17220.121737
20-0.010116-0.11040.456159
21-0.011665-0.12730.449477
220.1028431.12190.132085
23-0.070088-0.76460.22302
24-0.066552-0.7260.234634
250.052010.56740.285769
26-0.010087-0.110.456285
27-0.014474-0.15790.437405
280.0678060.73970.230475
29-0.032336-0.35270.362453
30-0.038161-0.41630.338976
310.0522920.57040.284728
32-0.153542-1.67490.048286
33-0.082545-0.90050.184848
340.0305020.33270.369958
350.1021261.11410.133749
36-0.050298-0.54870.292125
370.0618090.67430.250728
38-0.025421-0.27730.391011
39-0.033155-0.36170.359116
400.0031670.03460.486247
41-0.022885-0.24960.401647
420.0068520.07470.470271
43-0.096401-1.05160.147553
44-0.006146-0.0670.473331
450.0242880.2650.395752
46-0.028664-0.31270.377533
470.0491640.53630.296372
480.0027990.03050.487845
49-0.08448-0.92160.17931
500.0483490.52740.299438
51-0.057983-0.63250.264132
520.06820.7440.22918
530.039950.43580.331884
540.0751120.81940.207104
550.0717040.78220.217827
560.0727560.79370.214482
57-0.025494-0.27810.390706
58-0.005167-0.05640.477573
59-0.025259-0.27550.391688
60-0.057651-0.62890.26531

\begin{tabular}{lllllllll}
\hline
Partial Autocorrelation Function \tabularnewline
Time lag k & PACF(k) & T-STAT & P-value \tabularnewline
1 & 0.020244 & 0.2208 & 0.412797 \tabularnewline
2 & -0.439829 & -4.798 & 2e-06 \tabularnewline
3 & -0.185317 & -2.0216 & 0.022732 \tabularnewline
4 & 0.01171 & 0.1277 & 0.449287 \tabularnewline
5 & 0.044454 & 0.4849 & 0.314308 \tabularnewline
6 & -0.207707 & -2.2658 & 0.012635 \tabularnewline
7 & 0.265646 & 2.8979 & 0.002237 \tabularnewline
8 & 0.054684 & 0.5965 & 0.275975 \tabularnewline
9 & -0.144713 & -1.5786 & 0.058537 \tabularnewline
10 & -0.346878 & -3.784 & 0.000122 \tabularnewline
11 & -0.106264 & -1.1592 & 0.124346 \tabularnewline
12 & 0.732721 & 7.993 & 0 \tabularnewline
13 & -0.100724 & -1.0988 & 0.137044 \tabularnewline
14 & 0.123712 & 1.3495 & 0.089862 \tabularnewline
15 & 0.057413 & 0.6263 & 0.266159 \tabularnewline
16 & -0.166795 & -1.8195 & 0.035673 \tabularnewline
17 & -0.093231 & -1.017 & 0.155602 \tabularnewline
18 & 0.036962 & 0.4032 & 0.34376 \tabularnewline
19 & -0.107452 & -1.1722 & 0.121737 \tabularnewline
20 & -0.010116 & -0.1104 & 0.456159 \tabularnewline
21 & -0.011665 & -0.1273 & 0.449477 \tabularnewline
22 & 0.102843 & 1.1219 & 0.132085 \tabularnewline
23 & -0.070088 & -0.7646 & 0.22302 \tabularnewline
24 & -0.066552 & -0.726 & 0.234634 \tabularnewline
25 & 0.05201 & 0.5674 & 0.285769 \tabularnewline
26 & -0.010087 & -0.11 & 0.456285 \tabularnewline
27 & -0.014474 & -0.1579 & 0.437405 \tabularnewline
28 & 0.067806 & 0.7397 & 0.230475 \tabularnewline
29 & -0.032336 & -0.3527 & 0.362453 \tabularnewline
30 & -0.038161 & -0.4163 & 0.338976 \tabularnewline
31 & 0.052292 & 0.5704 & 0.284728 \tabularnewline
32 & -0.153542 & -1.6749 & 0.048286 \tabularnewline
33 & -0.082545 & -0.9005 & 0.184848 \tabularnewline
34 & 0.030502 & 0.3327 & 0.369958 \tabularnewline
35 & 0.102126 & 1.1141 & 0.133749 \tabularnewline
36 & -0.050298 & -0.5487 & 0.292125 \tabularnewline
37 & 0.061809 & 0.6743 & 0.250728 \tabularnewline
38 & -0.025421 & -0.2773 & 0.391011 \tabularnewline
39 & -0.033155 & -0.3617 & 0.359116 \tabularnewline
40 & 0.003167 & 0.0346 & 0.486247 \tabularnewline
41 & -0.022885 & -0.2496 & 0.401647 \tabularnewline
42 & 0.006852 & 0.0747 & 0.470271 \tabularnewline
43 & -0.096401 & -1.0516 & 0.147553 \tabularnewline
44 & -0.006146 & -0.067 & 0.473331 \tabularnewline
45 & 0.024288 & 0.265 & 0.395752 \tabularnewline
46 & -0.028664 & -0.3127 & 0.377533 \tabularnewline
47 & 0.049164 & 0.5363 & 0.296372 \tabularnewline
48 & 0.002799 & 0.0305 & 0.487845 \tabularnewline
49 & -0.08448 & -0.9216 & 0.17931 \tabularnewline
50 & 0.048349 & 0.5274 & 0.299438 \tabularnewline
51 & -0.057983 & -0.6325 & 0.264132 \tabularnewline
52 & 0.0682 & 0.744 & 0.22918 \tabularnewline
53 & 0.03995 & 0.4358 & 0.331884 \tabularnewline
54 & 0.075112 & 0.8194 & 0.207104 \tabularnewline
55 & 0.071704 & 0.7822 & 0.217827 \tabularnewline
56 & 0.072756 & 0.7937 & 0.214482 \tabularnewline
57 & -0.025494 & -0.2781 & 0.390706 \tabularnewline
58 & -0.005167 & -0.0564 & 0.477573 \tabularnewline
59 & -0.025259 & -0.2755 & 0.391688 \tabularnewline
60 & -0.057651 & -0.6289 & 0.26531 \tabularnewline
\hline
\end{tabular}
%Source: https://freestatistics.org/blog/index.php?pk=77950&T=2

[TABLE]
[ROW][C]Partial Autocorrelation Function[/C][/ROW]
[ROW][C]Time lag k[/C][C]PACF(k)[/C][C]T-STAT[/C][C]P-value[/C][/ROW]
[ROW][C]1[/C][C]0.020244[/C][C]0.2208[/C][C]0.412797[/C][/ROW]
[ROW][C]2[/C][C]-0.439829[/C][C]-4.798[/C][C]2e-06[/C][/ROW]
[ROW][C]3[/C][C]-0.185317[/C][C]-2.0216[/C][C]0.022732[/C][/ROW]
[ROW][C]4[/C][C]0.01171[/C][C]0.1277[/C][C]0.449287[/C][/ROW]
[ROW][C]5[/C][C]0.044454[/C][C]0.4849[/C][C]0.314308[/C][/ROW]
[ROW][C]6[/C][C]-0.207707[/C][C]-2.2658[/C][C]0.012635[/C][/ROW]
[ROW][C]7[/C][C]0.265646[/C][C]2.8979[/C][C]0.002237[/C][/ROW]
[ROW][C]8[/C][C]0.054684[/C][C]0.5965[/C][C]0.275975[/C][/ROW]
[ROW][C]9[/C][C]-0.144713[/C][C]-1.5786[/C][C]0.058537[/C][/ROW]
[ROW][C]10[/C][C]-0.346878[/C][C]-3.784[/C][C]0.000122[/C][/ROW]
[ROW][C]11[/C][C]-0.106264[/C][C]-1.1592[/C][C]0.124346[/C][/ROW]
[ROW][C]12[/C][C]0.732721[/C][C]7.993[/C][C]0[/C][/ROW]
[ROW][C]13[/C][C]-0.100724[/C][C]-1.0988[/C][C]0.137044[/C][/ROW]
[ROW][C]14[/C][C]0.123712[/C][C]1.3495[/C][C]0.089862[/C][/ROW]
[ROW][C]15[/C][C]0.057413[/C][C]0.6263[/C][C]0.266159[/C][/ROW]
[ROW][C]16[/C][C]-0.166795[/C][C]-1.8195[/C][C]0.035673[/C][/ROW]
[ROW][C]17[/C][C]-0.093231[/C][C]-1.017[/C][C]0.155602[/C][/ROW]
[ROW][C]18[/C][C]0.036962[/C][C]0.4032[/C][C]0.34376[/C][/ROW]
[ROW][C]19[/C][C]-0.107452[/C][C]-1.1722[/C][C]0.121737[/C][/ROW]
[ROW][C]20[/C][C]-0.010116[/C][C]-0.1104[/C][C]0.456159[/C][/ROW]
[ROW][C]21[/C][C]-0.011665[/C][C]-0.1273[/C][C]0.449477[/C][/ROW]
[ROW][C]22[/C][C]0.102843[/C][C]1.1219[/C][C]0.132085[/C][/ROW]
[ROW][C]23[/C][C]-0.070088[/C][C]-0.7646[/C][C]0.22302[/C][/ROW]
[ROW][C]24[/C][C]-0.066552[/C][C]-0.726[/C][C]0.234634[/C][/ROW]
[ROW][C]25[/C][C]0.05201[/C][C]0.5674[/C][C]0.285769[/C][/ROW]
[ROW][C]26[/C][C]-0.010087[/C][C]-0.11[/C][C]0.456285[/C][/ROW]
[ROW][C]27[/C][C]-0.014474[/C][C]-0.1579[/C][C]0.437405[/C][/ROW]
[ROW][C]28[/C][C]0.067806[/C][C]0.7397[/C][C]0.230475[/C][/ROW]
[ROW][C]29[/C][C]-0.032336[/C][C]-0.3527[/C][C]0.362453[/C][/ROW]
[ROW][C]30[/C][C]-0.038161[/C][C]-0.4163[/C][C]0.338976[/C][/ROW]
[ROW][C]31[/C][C]0.052292[/C][C]0.5704[/C][C]0.284728[/C][/ROW]
[ROW][C]32[/C][C]-0.153542[/C][C]-1.6749[/C][C]0.048286[/C][/ROW]
[ROW][C]33[/C][C]-0.082545[/C][C]-0.9005[/C][C]0.184848[/C][/ROW]
[ROW][C]34[/C][C]0.030502[/C][C]0.3327[/C][C]0.369958[/C][/ROW]
[ROW][C]35[/C][C]0.102126[/C][C]1.1141[/C][C]0.133749[/C][/ROW]
[ROW][C]36[/C][C]-0.050298[/C][C]-0.5487[/C][C]0.292125[/C][/ROW]
[ROW][C]37[/C][C]0.061809[/C][C]0.6743[/C][C]0.250728[/C][/ROW]
[ROW][C]38[/C][C]-0.025421[/C][C]-0.2773[/C][C]0.391011[/C][/ROW]
[ROW][C]39[/C][C]-0.033155[/C][C]-0.3617[/C][C]0.359116[/C][/ROW]
[ROW][C]40[/C][C]0.003167[/C][C]0.0346[/C][C]0.486247[/C][/ROW]
[ROW][C]41[/C][C]-0.022885[/C][C]-0.2496[/C][C]0.401647[/C][/ROW]
[ROW][C]42[/C][C]0.006852[/C][C]0.0747[/C][C]0.470271[/C][/ROW]
[ROW][C]43[/C][C]-0.096401[/C][C]-1.0516[/C][C]0.147553[/C][/ROW]
[ROW][C]44[/C][C]-0.006146[/C][C]-0.067[/C][C]0.473331[/C][/ROW]
[ROW][C]45[/C][C]0.024288[/C][C]0.265[/C][C]0.395752[/C][/ROW]
[ROW][C]46[/C][C]-0.028664[/C][C]-0.3127[/C][C]0.377533[/C][/ROW]
[ROW][C]47[/C][C]0.049164[/C][C]0.5363[/C][C]0.296372[/C][/ROW]
[ROW][C]48[/C][C]0.002799[/C][C]0.0305[/C][C]0.487845[/C][/ROW]
[ROW][C]49[/C][C]-0.08448[/C][C]-0.9216[/C][C]0.17931[/C][/ROW]
[ROW][C]50[/C][C]0.048349[/C][C]0.5274[/C][C]0.299438[/C][/ROW]
[ROW][C]51[/C][C]-0.057983[/C][C]-0.6325[/C][C]0.264132[/C][/ROW]
[ROW][C]52[/C][C]0.0682[/C][C]0.744[/C][C]0.22918[/C][/ROW]
[ROW][C]53[/C][C]0.03995[/C][C]0.4358[/C][C]0.331884[/C][/ROW]
[ROW][C]54[/C][C]0.075112[/C][C]0.8194[/C][C]0.207104[/C][/ROW]
[ROW][C]55[/C][C]0.071704[/C][C]0.7822[/C][C]0.217827[/C][/ROW]
[ROW][C]56[/C][C]0.072756[/C][C]0.7937[/C][C]0.214482[/C][/ROW]
[ROW][C]57[/C][C]-0.025494[/C][C]-0.2781[/C][C]0.390706[/C][/ROW]
[ROW][C]58[/C][C]-0.005167[/C][C]-0.0564[/C][C]0.477573[/C][/ROW]
[ROW][C]59[/C][C]-0.025259[/C][C]-0.2755[/C][C]0.391688[/C][/ROW]
[ROW][C]60[/C][C]-0.057651[/C][C]-0.6289[/C][C]0.26531[/C][/ROW]
[/TABLE]
Source: https://freestatistics.org/blog/index.php?pk=77950&T=2

Globally Unique Identifier (entire table): ba.freestatistics.org/blog/index.php?pk=77950&T=2

As an alternative you can also use a QR Code:  

The GUIDs for individual cells are displayed in the table below:

Partial Autocorrelation Function
Time lag kPACF(k)T-STATP-value
10.0202440.22080.412797
2-0.439829-4.7982e-06
3-0.185317-2.02160.022732
40.011710.12770.449287
50.0444540.48490.314308
6-0.207707-2.26580.012635
70.2656462.89790.002237
80.0546840.59650.275975
9-0.144713-1.57860.058537
10-0.346878-3.7840.000122
11-0.106264-1.15920.124346
120.7327217.9930
13-0.100724-1.09880.137044
140.1237121.34950.089862
150.0574130.62630.266159
16-0.166795-1.81950.035673
17-0.093231-1.0170.155602
180.0369620.40320.34376
19-0.107452-1.17220.121737
20-0.010116-0.11040.456159
21-0.011665-0.12730.449477
220.1028431.12190.132085
23-0.070088-0.76460.22302
24-0.066552-0.7260.234634
250.052010.56740.285769
26-0.010087-0.110.456285
27-0.014474-0.15790.437405
280.0678060.73970.230475
29-0.032336-0.35270.362453
30-0.038161-0.41630.338976
310.0522920.57040.284728
32-0.153542-1.67490.048286
33-0.082545-0.90050.184848
340.0305020.33270.369958
350.1021261.11410.133749
36-0.050298-0.54870.292125
370.0618090.67430.250728
38-0.025421-0.27730.391011
39-0.033155-0.36170.359116
400.0031670.03460.486247
41-0.022885-0.24960.401647
420.0068520.07470.470271
43-0.096401-1.05160.147553
44-0.006146-0.0670.473331
450.0242880.2650.395752
46-0.028664-0.31270.377533
470.0491640.53630.296372
480.0027990.03050.487845
49-0.08448-0.92160.17931
500.0483490.52740.299438
51-0.057983-0.63250.264132
520.06820.7440.22918
530.039950.43580.331884
540.0751120.81940.207104
550.0717040.78220.217827
560.0727560.79370.214482
57-0.025494-0.27810.390706
58-0.005167-0.05640.477573
59-0.025259-0.27550.391688
60-0.057651-0.62890.26531


Parameters (Session):
par1 = 0.1 ; par2 = 0.99 ; par3 = 0.01 ;
Parameters (R input):
par1 = 60 ; par2 = 1 ; par3 = 1 ; par4 = 0 ; par5 = 12 ; par6 = White Noise ; par7 = 0.95 ;
R code (references can be found in the software module):
if (par1 == 'Default') {
par1 = 10*log10(length(x))
} else {
par1 <- as.numeric(par1)
}
par2 <- as.numeric(par2)
par3 <- as.numeric(par3)
par4 <- as.numeric(par4)
par5 <- as.numeric(par5)
if (par6 == 'White Noise') par6 <- 'white' else par6 <- 'ma'
par7 <- as.numeric(par7)
if (par2 == 0) {
x <- log(x)
} else {
x <- (x ^ par2 - 1) / par2
}
if (par3 > 0) x <- diff(x,lag=1,difference=par3)
if (par4 > 0) x <- diff(x,lag=par5,difference=par4)
bitmap(file='pic1.png')
racf <- acf(x, par1, main='Autocorrelation', xlab='time lag', ylab='ACF', ci.type=par6, ci=par7, sub=paste('(lambda=',par2,', d=',par3,', D=',par4,', CI=', par7, ', CI type=',par6,')',sep=''))
dev.off()
bitmap(file='pic2.png')
rpacf <- pacf(x,par1,main='Partial Autocorrelation',xlab='lags',ylab='PACF')
dev.off()
(myacf <- c(racf$acf))
(mypacf <- c(rpacf$acf))
lengthx <- length(x)
sqrtn <- sqrt(lengthx)
load(file='createtable')
a<-table.start()
a<-table.row.start(a)
a<-table.element(a,'Autocorrelation Function',4,TRUE)
a<-table.row.end(a)
a<-table.row.start(a)
a<-table.element(a,'Time lag k',header=TRUE)
a<-table.element(a,hyperlink('basics.htm','ACF(k)','click here for more information about the Autocorrelation Function'),header=TRUE)
a<-table.element(a,'T-STAT',header=TRUE)
a<-table.element(a,'P-value',header=TRUE)
a<-table.row.end(a)
for (i in 2:(par1+1)) {
a<-table.row.start(a)
a<-table.element(a,i-1,header=TRUE)
a<-table.element(a,round(myacf[i],6))
mytstat <- myacf[i]*sqrtn
a<-table.element(a,round(mytstat,4))
a<-table.element(a,round(1-pt(abs(mytstat),lengthx),6))
a<-table.row.end(a)
}
a<-table.end(a)
table.save(a,file='mytable.tab')
a<-table.start()
a<-table.row.start(a)
a<-table.element(a,'Partial Autocorrelation Function',4,TRUE)
a<-table.row.end(a)
a<-table.row.start(a)
a<-table.element(a,'Time lag k',header=TRUE)
a<-table.element(a,hyperlink('basics.htm','PACF(k)','click here for more information about the Partial Autocorrelation Function'),header=TRUE)
a<-table.element(a,'T-STAT',header=TRUE)
a<-table.element(a,'P-value',header=TRUE)
a<-table.row.end(a)
for (i in 1:par1) {
a<-table.row.start(a)
a<-table.element(a,i,header=TRUE)
a<-table.element(a,round(mypacf[i],6))
mytstat <- mypacf[i]*sqrtn
a<-table.element(a,round(mytstat,4))
a<-table.element(a,round(1-pt(abs(mytstat),lengthx),6))
a<-table.row.end(a)
}
a<-table.end(a)
table.save(a,file='mytable1.tab')