Free Statistics

of Irreproducible Research!

Author's title

Author*Unverified author*
R Software Modulerwasp_autocorrelation.wasp
Title produced by software(Partial) Autocorrelation Function
Date of computationFri, 02 Jul 2010 17:27:53 +0000
Cite this page as followsStatistical Computations at FreeStatistics.org, Office for Research Development and Education, URL https://freestatistics.org/blog/index.php?v=date/2010/Jul/02/t1278091727dr9bxtc00k40l4t.htm/, Retrieved Sat, 04 May 2024 00:59:02 +0000
Statistical Computations at FreeStatistics.org, Office for Research Development and Education, URL https://freestatistics.org/blog/index.php?pk=77930, Retrieved Sat, 04 May 2024 00:59:02 +0000
QR Codes:

Original text written by user:
IsPrivate?No (this computation is public)
User-defined keywordsthomas talboom
Estimated Impact206
Family? (F = Feedback message, R = changed R code, M = changed R Module, P = changed Parameters, D = changed Data)
-     [Harrell-Davis Quantiles] [percentielen] [2010-07-01 11:45:42] [b6623a0531b43a362887826f077b4445]
- RMP   [Mean Plot] [gemiddeldegrafieken] [2010-07-01 13:10:54] [b6623a0531b43a362887826f077b4445]
- RMP       [(Partial) Autocorrelation Function] [part autocorrelatie] [2010-07-02 17:27:53] [58d9ccda37eeb031a0ffa1e9ea016ece] [Current]
Feedback Forum

Post a new message
Dataseries X:
68
67
66
64
84
83
68
58
59
59
60
62
58
58
59
62
87
83
68
58
68
63
65
68
62
69
74
72
94
102
92
81
99
95
92
93
85
92
99
107
125
137
125
115
135
128
120
123
119
128
139
155
164
176
162
155
174
171
162
160
156
163
180
195
203
212
203
184
200
198
195
177
176
180
194
204
206
219
213
196
214
209
213
194
197
211
240
251
254
273
271
245
264
264
262
237
237
251
272
282
278
291
293
271
284
290
288
262
263
275
297
301
296
309
310
292
300
314
310
288


Summary of computational transaction
Raw Inputview raw input (R code)
Raw Outputview raw output of R engine
Computing time1 seconds
R Server'Gwilym Jenkins' @ 72.249.127.135

\begin{tabular}{lllllllll}
\hline
Summary of computational transaction \tabularnewline
Raw Input & view raw input (R code)  \tabularnewline
Raw Output & view raw output of R engine  \tabularnewline
Computing time & 1 seconds \tabularnewline
R Server & 'Gwilym Jenkins' @ 72.249.127.135 \tabularnewline
\hline
\end{tabular}
%Source: https://freestatistics.org/blog/index.php?pk=77930&T=0

[TABLE]
[ROW][C]Summary of computational transaction[/C][/ROW]
[ROW][C]Raw Input[/C][C]view raw input (R code) [/C][/ROW]
[ROW][C]Raw Output[/C][C]view raw output of R engine [/C][/ROW]
[ROW][C]Computing time[/C][C]1 seconds[/C][/ROW]
[ROW][C]R Server[/C][C]'Gwilym Jenkins' @ 72.249.127.135[/C][/ROW]
[/TABLE]
Source: https://freestatistics.org/blog/index.php?pk=77930&T=0

Globally Unique Identifier (entire table): ba.freestatistics.org/blog/index.php?pk=77930&T=0

As an alternative you can also use a QR Code:  

The GUIDs for individual cells are displayed in the table below:

Summary of computational transaction
Raw Inputview raw input (R code)
Raw Outputview raw output of R engine
Computing time1 seconds
R Server'Gwilym Jenkins' @ 72.249.127.135


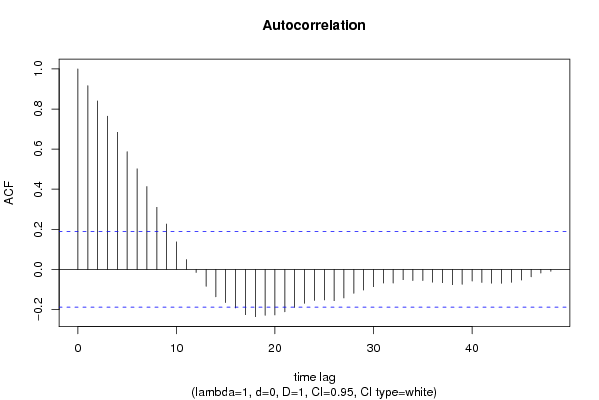
Autocorrelation Function
Time lag kACF(k)T-STATP-value
10.9163849.52330
20.8402248.73190
30.7644097.9440
40.6839367.10770
50.5873246.10360
60.5018175.2150
70.4131884.2941.9e-05
80.309473.21610.000857
90.2262092.35080.010273
100.1372311.42620.078355
110.0488070.50720.30652
12-0.015238-0.15840.437234
13-0.084323-0.87630.191402
14-0.136907-1.42280.07884
15-0.165514-1.72010.044142
16-0.192583-2.00140.02393
17-0.226087-2.34960.010306
18-0.235864-2.45120.007922
19-0.22934-2.38340.009451
20-0.227294-2.36210.009981
21-0.211437-2.19730.015067
22-0.189798-1.97240.025558
23-0.169196-1.75830.040762
24-0.155185-1.61270.054861
25-0.152585-1.58570.057865
26-0.155929-1.62050.054025
27-0.142644-1.48240.070573
28-0.119428-1.24110.108623
29-0.10321-1.07260.142923
30-0.086488-0.89880.185376
31-0.068583-0.71270.238773
32-0.06826-0.70940.23981
33-0.051167-0.53170.297998
34-0.055884-0.58080.281305
35-0.055906-0.5810.281227
36-0.063844-0.66350.254216
37-0.066426-0.69030.245736
38-0.076464-0.79460.214282
39-0.074244-0.77160.221029
40-0.05809-0.60370.273659
41-0.06505-0.6760.250237
42-0.069164-0.71880.236915
43-0.069693-0.72430.235231
44-0.064634-0.67170.251605
45-0.0533-0.55390.290394
46-0.037045-0.3850.350502
47-0.018281-0.190.424841
48-0.00989-0.10280.459165

\begin{tabular}{lllllllll}
\hline
Autocorrelation Function \tabularnewline
Time lag k & ACF(k) & T-STAT & P-value \tabularnewline
1 & 0.916384 & 9.5233 & 0 \tabularnewline
2 & 0.840224 & 8.7319 & 0 \tabularnewline
3 & 0.764409 & 7.944 & 0 \tabularnewline
4 & 0.683936 & 7.1077 & 0 \tabularnewline
5 & 0.587324 & 6.1036 & 0 \tabularnewline
6 & 0.501817 & 5.215 & 0 \tabularnewline
7 & 0.413188 & 4.294 & 1.9e-05 \tabularnewline
8 & 0.30947 & 3.2161 & 0.000857 \tabularnewline
9 & 0.226209 & 2.3508 & 0.010273 \tabularnewline
10 & 0.137231 & 1.4262 & 0.078355 \tabularnewline
11 & 0.048807 & 0.5072 & 0.30652 \tabularnewline
12 & -0.015238 & -0.1584 & 0.437234 \tabularnewline
13 & -0.084323 & -0.8763 & 0.191402 \tabularnewline
14 & -0.136907 & -1.4228 & 0.07884 \tabularnewline
15 & -0.165514 & -1.7201 & 0.044142 \tabularnewline
16 & -0.192583 & -2.0014 & 0.02393 \tabularnewline
17 & -0.226087 & -2.3496 & 0.010306 \tabularnewline
18 & -0.235864 & -2.4512 & 0.007922 \tabularnewline
19 & -0.22934 & -2.3834 & 0.009451 \tabularnewline
20 & -0.227294 & -2.3621 & 0.009981 \tabularnewline
21 & -0.211437 & -2.1973 & 0.015067 \tabularnewline
22 & -0.189798 & -1.9724 & 0.025558 \tabularnewline
23 & -0.169196 & -1.7583 & 0.040762 \tabularnewline
24 & -0.155185 & -1.6127 & 0.054861 \tabularnewline
25 & -0.152585 & -1.5857 & 0.057865 \tabularnewline
26 & -0.155929 & -1.6205 & 0.054025 \tabularnewline
27 & -0.142644 & -1.4824 & 0.070573 \tabularnewline
28 & -0.119428 & -1.2411 & 0.108623 \tabularnewline
29 & -0.10321 & -1.0726 & 0.142923 \tabularnewline
30 & -0.086488 & -0.8988 & 0.185376 \tabularnewline
31 & -0.068583 & -0.7127 & 0.238773 \tabularnewline
32 & -0.06826 & -0.7094 & 0.23981 \tabularnewline
33 & -0.051167 & -0.5317 & 0.297998 \tabularnewline
34 & -0.055884 & -0.5808 & 0.281305 \tabularnewline
35 & -0.055906 & -0.581 & 0.281227 \tabularnewline
36 & -0.063844 & -0.6635 & 0.254216 \tabularnewline
37 & -0.066426 & -0.6903 & 0.245736 \tabularnewline
38 & -0.076464 & -0.7946 & 0.214282 \tabularnewline
39 & -0.074244 & -0.7716 & 0.221029 \tabularnewline
40 & -0.05809 & -0.6037 & 0.273659 \tabularnewline
41 & -0.06505 & -0.676 & 0.250237 \tabularnewline
42 & -0.069164 & -0.7188 & 0.236915 \tabularnewline
43 & -0.069693 & -0.7243 & 0.235231 \tabularnewline
44 & -0.064634 & -0.6717 & 0.251605 \tabularnewline
45 & -0.0533 & -0.5539 & 0.290394 \tabularnewline
46 & -0.037045 & -0.385 & 0.350502 \tabularnewline
47 & -0.018281 & -0.19 & 0.424841 \tabularnewline
48 & -0.00989 & -0.1028 & 0.459165 \tabularnewline
\hline
\end{tabular}
%Source: https://freestatistics.org/blog/index.php?pk=77930&T=1

[TABLE]
[ROW][C]Autocorrelation Function[/C][/ROW]
[ROW][C]Time lag k[/C][C]ACF(k)[/C][C]T-STAT[/C][C]P-value[/C][/ROW]
[ROW][C]1[/C][C]0.916384[/C][C]9.5233[/C][C]0[/C][/ROW]
[ROW][C]2[/C][C]0.840224[/C][C]8.7319[/C][C]0[/C][/ROW]
[ROW][C]3[/C][C]0.764409[/C][C]7.944[/C][C]0[/C][/ROW]
[ROW][C]4[/C][C]0.683936[/C][C]7.1077[/C][C]0[/C][/ROW]
[ROW][C]5[/C][C]0.587324[/C][C]6.1036[/C][C]0[/C][/ROW]
[ROW][C]6[/C][C]0.501817[/C][C]5.215[/C][C]0[/C][/ROW]
[ROW][C]7[/C][C]0.413188[/C][C]4.294[/C][C]1.9e-05[/C][/ROW]
[ROW][C]8[/C][C]0.30947[/C][C]3.2161[/C][C]0.000857[/C][/ROW]
[ROW][C]9[/C][C]0.226209[/C][C]2.3508[/C][C]0.010273[/C][/ROW]
[ROW][C]10[/C][C]0.137231[/C][C]1.4262[/C][C]0.078355[/C][/ROW]
[ROW][C]11[/C][C]0.048807[/C][C]0.5072[/C][C]0.30652[/C][/ROW]
[ROW][C]12[/C][C]-0.015238[/C][C]-0.1584[/C][C]0.437234[/C][/ROW]
[ROW][C]13[/C][C]-0.084323[/C][C]-0.8763[/C][C]0.191402[/C][/ROW]
[ROW][C]14[/C][C]-0.136907[/C][C]-1.4228[/C][C]0.07884[/C][/ROW]
[ROW][C]15[/C][C]-0.165514[/C][C]-1.7201[/C][C]0.044142[/C][/ROW]
[ROW][C]16[/C][C]-0.192583[/C][C]-2.0014[/C][C]0.02393[/C][/ROW]
[ROW][C]17[/C][C]-0.226087[/C][C]-2.3496[/C][C]0.010306[/C][/ROW]
[ROW][C]18[/C][C]-0.235864[/C][C]-2.4512[/C][C]0.007922[/C][/ROW]
[ROW][C]19[/C][C]-0.22934[/C][C]-2.3834[/C][C]0.009451[/C][/ROW]
[ROW][C]20[/C][C]-0.227294[/C][C]-2.3621[/C][C]0.009981[/C][/ROW]
[ROW][C]21[/C][C]-0.211437[/C][C]-2.1973[/C][C]0.015067[/C][/ROW]
[ROW][C]22[/C][C]-0.189798[/C][C]-1.9724[/C][C]0.025558[/C][/ROW]
[ROW][C]23[/C][C]-0.169196[/C][C]-1.7583[/C][C]0.040762[/C][/ROW]
[ROW][C]24[/C][C]-0.155185[/C][C]-1.6127[/C][C]0.054861[/C][/ROW]
[ROW][C]25[/C][C]-0.152585[/C][C]-1.5857[/C][C]0.057865[/C][/ROW]
[ROW][C]26[/C][C]-0.155929[/C][C]-1.6205[/C][C]0.054025[/C][/ROW]
[ROW][C]27[/C][C]-0.142644[/C][C]-1.4824[/C][C]0.070573[/C][/ROW]
[ROW][C]28[/C][C]-0.119428[/C][C]-1.2411[/C][C]0.108623[/C][/ROW]
[ROW][C]29[/C][C]-0.10321[/C][C]-1.0726[/C][C]0.142923[/C][/ROW]
[ROW][C]30[/C][C]-0.086488[/C][C]-0.8988[/C][C]0.185376[/C][/ROW]
[ROW][C]31[/C][C]-0.068583[/C][C]-0.7127[/C][C]0.238773[/C][/ROW]
[ROW][C]32[/C][C]-0.06826[/C][C]-0.7094[/C][C]0.23981[/C][/ROW]
[ROW][C]33[/C][C]-0.051167[/C][C]-0.5317[/C][C]0.297998[/C][/ROW]
[ROW][C]34[/C][C]-0.055884[/C][C]-0.5808[/C][C]0.281305[/C][/ROW]
[ROW][C]35[/C][C]-0.055906[/C][C]-0.581[/C][C]0.281227[/C][/ROW]
[ROW][C]36[/C][C]-0.063844[/C][C]-0.6635[/C][C]0.254216[/C][/ROW]
[ROW][C]37[/C][C]-0.066426[/C][C]-0.6903[/C][C]0.245736[/C][/ROW]
[ROW][C]38[/C][C]-0.076464[/C][C]-0.7946[/C][C]0.214282[/C][/ROW]
[ROW][C]39[/C][C]-0.074244[/C][C]-0.7716[/C][C]0.221029[/C][/ROW]
[ROW][C]40[/C][C]-0.05809[/C][C]-0.6037[/C][C]0.273659[/C][/ROW]
[ROW][C]41[/C][C]-0.06505[/C][C]-0.676[/C][C]0.250237[/C][/ROW]
[ROW][C]42[/C][C]-0.069164[/C][C]-0.7188[/C][C]0.236915[/C][/ROW]
[ROW][C]43[/C][C]-0.069693[/C][C]-0.7243[/C][C]0.235231[/C][/ROW]
[ROW][C]44[/C][C]-0.064634[/C][C]-0.6717[/C][C]0.251605[/C][/ROW]
[ROW][C]45[/C][C]-0.0533[/C][C]-0.5539[/C][C]0.290394[/C][/ROW]
[ROW][C]46[/C][C]-0.037045[/C][C]-0.385[/C][C]0.350502[/C][/ROW]
[ROW][C]47[/C][C]-0.018281[/C][C]-0.19[/C][C]0.424841[/C][/ROW]
[ROW][C]48[/C][C]-0.00989[/C][C]-0.1028[/C][C]0.459165[/C][/ROW]
[/TABLE]
Source: https://freestatistics.org/blog/index.php?pk=77930&T=1

Globally Unique Identifier (entire table): ba.freestatistics.org/blog/index.php?pk=77930&T=1

As an alternative you can also use a QR Code:  

The GUIDs for individual cells are displayed in the table below:

Autocorrelation Function
Time lag kACF(k)T-STATP-value
10.9163849.52330
20.8402248.73190
30.7644097.9440
40.6839367.10770
50.5873246.10360
60.5018175.2150
70.4131884.2941.9e-05
80.309473.21610.000857
90.2262092.35080.010273
100.1372311.42620.078355
110.0488070.50720.30652
12-0.015238-0.15840.437234
13-0.084323-0.87630.191402
14-0.136907-1.42280.07884
15-0.165514-1.72010.044142
16-0.192583-2.00140.02393
17-0.226087-2.34960.010306
18-0.235864-2.45120.007922
19-0.22934-2.38340.009451
20-0.227294-2.36210.009981
21-0.211437-2.19730.015067
22-0.189798-1.97240.025558
23-0.169196-1.75830.040762
24-0.155185-1.61270.054861
25-0.152585-1.58570.057865
26-0.155929-1.62050.054025
27-0.142644-1.48240.070573
28-0.119428-1.24110.108623
29-0.10321-1.07260.142923
30-0.086488-0.89880.185376
31-0.068583-0.71270.238773
32-0.06826-0.70940.23981
33-0.051167-0.53170.297998
34-0.055884-0.58080.281305
35-0.055906-0.5810.281227
36-0.063844-0.66350.254216
37-0.066426-0.69030.245736
38-0.076464-0.79460.214282
39-0.074244-0.77160.221029
40-0.05809-0.60370.273659
41-0.06505-0.6760.250237
42-0.069164-0.71880.236915
43-0.069693-0.72430.235231
44-0.064634-0.67170.251605
45-0.0533-0.55390.290394
46-0.037045-0.3850.350502
47-0.018281-0.190.424841
48-0.00989-0.10280.459165


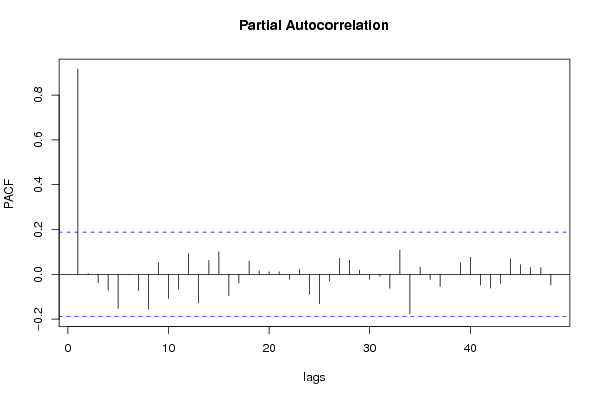
Partial Autocorrelation Function
Time lag kPACF(k)T-STATP-value
10.9163849.52330
20.0028980.03010.488014
3-0.03734-0.38810.349371
4-0.071826-0.74640.228512
5-0.151594-1.57540.059043
6-0.000102-0.00110.499579
7-0.07177-0.74590.228689
8-0.155925-1.62040.054029
90.0519210.53960.2953
10-0.108078-1.12320.131926
11-0.065849-0.68430.247619
120.0927120.96350.168725
13-0.127542-1.32550.093908
140.0619840.64420.26042
150.1014651.05450.147014
16-0.094067-0.97760.165235
17-0.037827-0.39310.347505
180.057990.60260.274004
190.016830.17490.430744
200.0108480.11270.455225
210.0120680.12540.450215
22-0.022179-0.23050.409075
230.0238110.24740.402516
24-0.088702-0.92180.17934
25-0.130892-1.36030.088288
26-0.029434-0.30590.38014
270.0715730.74380.229304
280.0626670.65130.258132
290.0191130.19860.421464
30-0.022227-0.2310.408882
31-0.008113-0.08430.466481
32-0.061728-0.64150.261281
330.1086061.12870.130771
34-0.176764-1.8370.034481
350.0326870.33970.367374
36-0.023202-0.24110.404958
37-0.053579-0.55680.289404
38-1.4e-05-1e-040.499941
390.0527610.54830.292304
400.076510.79510.214146
41-0.048032-0.49920.309341
42-0.06105-0.63440.263565
43-0.040536-0.42130.337202
440.0692210.71940.236736
450.0433140.45010.326758
460.0304570.31650.37611
470.0310960.32320.3736
48-0.04745-0.49310.311464

\begin{tabular}{lllllllll}
\hline
Partial Autocorrelation Function \tabularnewline
Time lag k & PACF(k) & T-STAT & P-value \tabularnewline
1 & 0.916384 & 9.5233 & 0 \tabularnewline
2 & 0.002898 & 0.0301 & 0.488014 \tabularnewline
3 & -0.03734 & -0.3881 & 0.349371 \tabularnewline
4 & -0.071826 & -0.7464 & 0.228512 \tabularnewline
5 & -0.151594 & -1.5754 & 0.059043 \tabularnewline
6 & -0.000102 & -0.0011 & 0.499579 \tabularnewline
7 & -0.07177 & -0.7459 & 0.228689 \tabularnewline
8 & -0.155925 & -1.6204 & 0.054029 \tabularnewline
9 & 0.051921 & 0.5396 & 0.2953 \tabularnewline
10 & -0.108078 & -1.1232 & 0.131926 \tabularnewline
11 & -0.065849 & -0.6843 & 0.247619 \tabularnewline
12 & 0.092712 & 0.9635 & 0.168725 \tabularnewline
13 & -0.127542 & -1.3255 & 0.093908 \tabularnewline
14 & 0.061984 & 0.6442 & 0.26042 \tabularnewline
15 & 0.101465 & 1.0545 & 0.147014 \tabularnewline
16 & -0.094067 & -0.9776 & 0.165235 \tabularnewline
17 & -0.037827 & -0.3931 & 0.347505 \tabularnewline
18 & 0.05799 & 0.6026 & 0.274004 \tabularnewline
19 & 0.01683 & 0.1749 & 0.430744 \tabularnewline
20 & 0.010848 & 0.1127 & 0.455225 \tabularnewline
21 & 0.012068 & 0.1254 & 0.450215 \tabularnewline
22 & -0.022179 & -0.2305 & 0.409075 \tabularnewline
23 & 0.023811 & 0.2474 & 0.402516 \tabularnewline
24 & -0.088702 & -0.9218 & 0.17934 \tabularnewline
25 & -0.130892 & -1.3603 & 0.088288 \tabularnewline
26 & -0.029434 & -0.3059 & 0.38014 \tabularnewline
27 & 0.071573 & 0.7438 & 0.229304 \tabularnewline
28 & 0.062667 & 0.6513 & 0.258132 \tabularnewline
29 & 0.019113 & 0.1986 & 0.421464 \tabularnewline
30 & -0.022227 & -0.231 & 0.408882 \tabularnewline
31 & -0.008113 & -0.0843 & 0.466481 \tabularnewline
32 & -0.061728 & -0.6415 & 0.261281 \tabularnewline
33 & 0.108606 & 1.1287 & 0.130771 \tabularnewline
34 & -0.176764 & -1.837 & 0.034481 \tabularnewline
35 & 0.032687 & 0.3397 & 0.367374 \tabularnewline
36 & -0.023202 & -0.2411 & 0.404958 \tabularnewline
37 & -0.053579 & -0.5568 & 0.289404 \tabularnewline
38 & -1.4e-05 & -1e-04 & 0.499941 \tabularnewline
39 & 0.052761 & 0.5483 & 0.292304 \tabularnewline
40 & 0.07651 & 0.7951 & 0.214146 \tabularnewline
41 & -0.048032 & -0.4992 & 0.309341 \tabularnewline
42 & -0.06105 & -0.6344 & 0.263565 \tabularnewline
43 & -0.040536 & -0.4213 & 0.337202 \tabularnewline
44 & 0.069221 & 0.7194 & 0.236736 \tabularnewline
45 & 0.043314 & 0.4501 & 0.326758 \tabularnewline
46 & 0.030457 & 0.3165 & 0.37611 \tabularnewline
47 & 0.031096 & 0.3232 & 0.3736 \tabularnewline
48 & -0.04745 & -0.4931 & 0.311464 \tabularnewline
\hline
\end{tabular}
%Source: https://freestatistics.org/blog/index.php?pk=77930&T=2

[TABLE]
[ROW][C]Partial Autocorrelation Function[/C][/ROW]
[ROW][C]Time lag k[/C][C]PACF(k)[/C][C]T-STAT[/C][C]P-value[/C][/ROW]
[ROW][C]1[/C][C]0.916384[/C][C]9.5233[/C][C]0[/C][/ROW]
[ROW][C]2[/C][C]0.002898[/C][C]0.0301[/C][C]0.488014[/C][/ROW]
[ROW][C]3[/C][C]-0.03734[/C][C]-0.3881[/C][C]0.349371[/C][/ROW]
[ROW][C]4[/C][C]-0.071826[/C][C]-0.7464[/C][C]0.228512[/C][/ROW]
[ROW][C]5[/C][C]-0.151594[/C][C]-1.5754[/C][C]0.059043[/C][/ROW]
[ROW][C]6[/C][C]-0.000102[/C][C]-0.0011[/C][C]0.499579[/C][/ROW]
[ROW][C]7[/C][C]-0.07177[/C][C]-0.7459[/C][C]0.228689[/C][/ROW]
[ROW][C]8[/C][C]-0.155925[/C][C]-1.6204[/C][C]0.054029[/C][/ROW]
[ROW][C]9[/C][C]0.051921[/C][C]0.5396[/C][C]0.2953[/C][/ROW]
[ROW][C]10[/C][C]-0.108078[/C][C]-1.1232[/C][C]0.131926[/C][/ROW]
[ROW][C]11[/C][C]-0.065849[/C][C]-0.6843[/C][C]0.247619[/C][/ROW]
[ROW][C]12[/C][C]0.092712[/C][C]0.9635[/C][C]0.168725[/C][/ROW]
[ROW][C]13[/C][C]-0.127542[/C][C]-1.3255[/C][C]0.093908[/C][/ROW]
[ROW][C]14[/C][C]0.061984[/C][C]0.6442[/C][C]0.26042[/C][/ROW]
[ROW][C]15[/C][C]0.101465[/C][C]1.0545[/C][C]0.147014[/C][/ROW]
[ROW][C]16[/C][C]-0.094067[/C][C]-0.9776[/C][C]0.165235[/C][/ROW]
[ROW][C]17[/C][C]-0.037827[/C][C]-0.3931[/C][C]0.347505[/C][/ROW]
[ROW][C]18[/C][C]0.05799[/C][C]0.6026[/C][C]0.274004[/C][/ROW]
[ROW][C]19[/C][C]0.01683[/C][C]0.1749[/C][C]0.430744[/C][/ROW]
[ROW][C]20[/C][C]0.010848[/C][C]0.1127[/C][C]0.455225[/C][/ROW]
[ROW][C]21[/C][C]0.012068[/C][C]0.1254[/C][C]0.450215[/C][/ROW]
[ROW][C]22[/C][C]-0.022179[/C][C]-0.2305[/C][C]0.409075[/C][/ROW]
[ROW][C]23[/C][C]0.023811[/C][C]0.2474[/C][C]0.402516[/C][/ROW]
[ROW][C]24[/C][C]-0.088702[/C][C]-0.9218[/C][C]0.17934[/C][/ROW]
[ROW][C]25[/C][C]-0.130892[/C][C]-1.3603[/C][C]0.088288[/C][/ROW]
[ROW][C]26[/C][C]-0.029434[/C][C]-0.3059[/C][C]0.38014[/C][/ROW]
[ROW][C]27[/C][C]0.071573[/C][C]0.7438[/C][C]0.229304[/C][/ROW]
[ROW][C]28[/C][C]0.062667[/C][C]0.6513[/C][C]0.258132[/C][/ROW]
[ROW][C]29[/C][C]0.019113[/C][C]0.1986[/C][C]0.421464[/C][/ROW]
[ROW][C]30[/C][C]-0.022227[/C][C]-0.231[/C][C]0.408882[/C][/ROW]
[ROW][C]31[/C][C]-0.008113[/C][C]-0.0843[/C][C]0.466481[/C][/ROW]
[ROW][C]32[/C][C]-0.061728[/C][C]-0.6415[/C][C]0.261281[/C][/ROW]
[ROW][C]33[/C][C]0.108606[/C][C]1.1287[/C][C]0.130771[/C][/ROW]
[ROW][C]34[/C][C]-0.176764[/C][C]-1.837[/C][C]0.034481[/C][/ROW]
[ROW][C]35[/C][C]0.032687[/C][C]0.3397[/C][C]0.367374[/C][/ROW]
[ROW][C]36[/C][C]-0.023202[/C][C]-0.2411[/C][C]0.404958[/C][/ROW]
[ROW][C]37[/C][C]-0.053579[/C][C]-0.5568[/C][C]0.289404[/C][/ROW]
[ROW][C]38[/C][C]-1.4e-05[/C][C]-1e-04[/C][C]0.499941[/C][/ROW]
[ROW][C]39[/C][C]0.052761[/C][C]0.5483[/C][C]0.292304[/C][/ROW]
[ROW][C]40[/C][C]0.07651[/C][C]0.7951[/C][C]0.214146[/C][/ROW]
[ROW][C]41[/C][C]-0.048032[/C][C]-0.4992[/C][C]0.309341[/C][/ROW]
[ROW][C]42[/C][C]-0.06105[/C][C]-0.6344[/C][C]0.263565[/C][/ROW]
[ROW][C]43[/C][C]-0.040536[/C][C]-0.4213[/C][C]0.337202[/C][/ROW]
[ROW][C]44[/C][C]0.069221[/C][C]0.7194[/C][C]0.236736[/C][/ROW]
[ROW][C]45[/C][C]0.043314[/C][C]0.4501[/C][C]0.326758[/C][/ROW]
[ROW][C]46[/C][C]0.030457[/C][C]0.3165[/C][C]0.37611[/C][/ROW]
[ROW][C]47[/C][C]0.031096[/C][C]0.3232[/C][C]0.3736[/C][/ROW]
[ROW][C]48[/C][C]-0.04745[/C][C]-0.4931[/C][C]0.311464[/C][/ROW]
[/TABLE]
Source: https://freestatistics.org/blog/index.php?pk=77930&T=2

Globally Unique Identifier (entire table): ba.freestatistics.org/blog/index.php?pk=77930&T=2

As an alternative you can also use a QR Code:  

The GUIDs for individual cells are displayed in the table below:

Partial Autocorrelation Function
Time lag kPACF(k)T-STATP-value
10.9163849.52330
20.0028980.03010.488014
3-0.03734-0.38810.349371
4-0.071826-0.74640.228512
5-0.151594-1.57540.059043
6-0.000102-0.00110.499579
7-0.07177-0.74590.228689
8-0.155925-1.62040.054029
90.0519210.53960.2953
10-0.108078-1.12320.131926
11-0.065849-0.68430.247619
120.0927120.96350.168725
13-0.127542-1.32550.093908
140.0619840.64420.26042
150.1014651.05450.147014
16-0.094067-0.97760.165235
17-0.037827-0.39310.347505
180.057990.60260.274004
190.016830.17490.430744
200.0108480.11270.455225
210.0120680.12540.450215
22-0.022179-0.23050.409075
230.0238110.24740.402516
24-0.088702-0.92180.17934
25-0.130892-1.36030.088288
26-0.029434-0.30590.38014
270.0715730.74380.229304
280.0626670.65130.258132
290.0191130.19860.421464
30-0.022227-0.2310.408882
31-0.008113-0.08430.466481
32-0.061728-0.64150.261281
330.1086061.12870.130771
34-0.176764-1.8370.034481
350.0326870.33970.367374
36-0.023202-0.24110.404958
37-0.053579-0.55680.289404
38-1.4e-05-1e-040.499941
390.0527610.54830.292304
400.076510.79510.214146
41-0.048032-0.49920.309341
42-0.06105-0.63440.263565
43-0.040536-0.42130.337202
440.0692210.71940.236736
450.0433140.45010.326758
460.0304570.31650.37611
470.0310960.32320.3736
48-0.04745-0.49310.311464


Parameters (Session):
par1 = 48 ; par2 = 1 ; par3 = 0 ; par4 = 1 ; par5 = 12 ; par6 = White Noise ; par7 = 0.95 ;
Parameters (R input):
par1 = 48 ; par2 = 1 ; par3 = 0 ; par4 = 1 ; par5 = 12 ; par6 = White Noise ; par7 = 0.95 ;
R code (references can be found in the software module):
if (par1 == 'Default') {
par1 = 10*log10(length(x))
} else {
par1 <- as.numeric(par1)
}
par2 <- as.numeric(par2)
par3 <- as.numeric(par3)
par4 <- as.numeric(par4)
par5 <- as.numeric(par5)
if (par6 == 'White Noise') par6 <- 'white' else par6 <- 'ma'
par7 <- as.numeric(par7)
if (par2 == 0) {
x <- log(x)
} else {
x <- (x ^ par2 - 1) / par2
}
if (par3 > 0) x <- diff(x,lag=1,difference=par3)
if (par4 > 0) x <- diff(x,lag=par5,difference=par4)
bitmap(file='pic1.png')
racf <- acf(x, par1, main='Autocorrelation', xlab='time lag', ylab='ACF', ci.type=par6, ci=par7, sub=paste('(lambda=',par2,', d=',par3,', D=',par4,', CI=', par7, ', CI type=',par6,')',sep=''))
dev.off()
bitmap(file='pic2.png')
rpacf <- pacf(x,par1,main='Partial Autocorrelation',xlab='lags',ylab='PACF')
dev.off()
(myacf <- c(racf$acf))
(mypacf <- c(rpacf$acf))
lengthx <- length(x)
sqrtn <- sqrt(lengthx)
load(file='createtable')
a<-table.start()
a<-table.row.start(a)
a<-table.element(a,'Autocorrelation Function',4,TRUE)
a<-table.row.end(a)
a<-table.row.start(a)
a<-table.element(a,'Time lag k',header=TRUE)
a<-table.element(a,hyperlink('basics.htm','ACF(k)','click here for more information about the Autocorrelation Function'),header=TRUE)
a<-table.element(a,'T-STAT',header=TRUE)
a<-table.element(a,'P-value',header=TRUE)
a<-table.row.end(a)
for (i in 2:(par1+1)) {
a<-table.row.start(a)
a<-table.element(a,i-1,header=TRUE)
a<-table.element(a,round(myacf[i],6))
mytstat <- myacf[i]*sqrtn
a<-table.element(a,round(mytstat,4))
a<-table.element(a,round(1-pt(abs(mytstat),lengthx),6))
a<-table.row.end(a)
}
a<-table.end(a)
table.save(a,file='mytable.tab')
a<-table.start()
a<-table.row.start(a)
a<-table.element(a,'Partial Autocorrelation Function',4,TRUE)
a<-table.row.end(a)
a<-table.row.start(a)
a<-table.element(a,'Time lag k',header=TRUE)
a<-table.element(a,hyperlink('basics.htm','PACF(k)','click here for more information about the Partial Autocorrelation Function'),header=TRUE)
a<-table.element(a,'T-STAT',header=TRUE)
a<-table.element(a,'P-value',header=TRUE)
a<-table.row.end(a)
for (i in 1:par1) {
a<-table.row.start(a)
a<-table.element(a,i,header=TRUE)
a<-table.element(a,round(mypacf[i],6))
mytstat <- mypacf[i]*sqrtn
a<-table.element(a,round(mytstat,4))
a<-table.element(a,round(1-pt(abs(mytstat),lengthx),6))
a<-table.row.end(a)
}
a<-table.end(a)
table.save(a,file='mytable1.tab')