Free Statistics

of Irreproducible Research!

Author's title

Author*Unverified author*
R Software Modulerwasp_autocorrelation.wasp
Title produced by software(Partial) Autocorrelation Function
Date of computationMon, 25 Jan 2010 11:18:00 -0700
Cite this page as followsStatistical Computations at FreeStatistics.org, Office for Research Development and Education, URL https://freestatistics.org/blog/index.php?v=date/2010/Jan/25/t12644435195yvqqfbqvt5emz0.htm/, Retrieved Sun, 05 May 2024 22:08:07 +0000
Statistical Computations at FreeStatistics.org, Office for Research Development and Education, URL https://freestatistics.org/blog/index.php?pk=72483, Retrieved Sun, 05 May 2024 22:08:07 +0000
QR Codes:

Original text written by user:
IsPrivate?No (this computation is public)
User-defined keywordsKDGP2W21
Estimated Impact108
Family? (F = Feedback message, R = changed R code, M = changed R Module, P = changed Parameters, D = changed Data)
-     [(Partial) Autocorrelation Function] [Autocorrelation -...] [2010-01-25 18:02:00] [7723ae71f48a5adc5e785905b449f94f]
-   PD    [(Partial) Autocorrelation Function] [Autocorrelation -...] [2010-01-25 18:18:00] [4223c028d657302779e6d755411cae22] [Current]
Feedback Forum

Post a new message
Dataseries X:
68897
38683
44720
39525
45315
50380
40600
36279
42438
38064
31879
11379
70249
39253
47060
41697
38708
49267
39018
32228
40870
39383
34571
12066
70938
34077
45409
40809
37013
44953
37848
32745
43412
34931
33008
8620
68906
39556
50669
36432
40891
48428
36222
33425
39401
37967
34801
12657
69116
41519
51321
38529
41547
52073
38401
40898
40439
41888
37898
8771
68184
50530
47221
41756
45633
48138
39486
39341
41117
41629
29722
7054
56231
34418
34568
29789
30630
35502
33091
27630
33520


Summary of computational transaction
Raw Inputview raw input (R code)
Raw Outputview raw output of R engine
Computing time1 seconds
R Server'Gwilym Jenkins' @ 72.249.127.135

\begin{tabular}{lllllllll}
\hline
Summary of computational transaction \tabularnewline
Raw Input & view raw input (R code)  \tabularnewline
Raw Output & view raw output of R engine  \tabularnewline
Computing time & 1 seconds \tabularnewline
R Server & 'Gwilym Jenkins' @ 72.249.127.135 \tabularnewline
\hline
\end{tabular}
%Source: https://freestatistics.org/blog/index.php?pk=72483&T=0

[TABLE]
[ROW][C]Summary of computational transaction[/C][/ROW]
[ROW][C]Raw Input[/C][C]view raw input (R code) [/C][/ROW]
[ROW][C]Raw Output[/C][C]view raw output of R engine [/C][/ROW]
[ROW][C]Computing time[/C][C]1 seconds[/C][/ROW]
[ROW][C]R Server[/C][C]'Gwilym Jenkins' @ 72.249.127.135[/C][/ROW]
[/TABLE]
Source: https://freestatistics.org/blog/index.php?pk=72483&T=0

Globally Unique Identifier (entire table): ba.freestatistics.org/blog/index.php?pk=72483&T=0

As an alternative you can also use a QR Code:  

The GUIDs for individual cells are displayed in the table below:

Summary of computational transaction
Raw Inputview raw input (R code)
Raw Outputview raw output of R engine
Computing time1 seconds
R Server'Gwilym Jenkins' @ 72.249.127.135


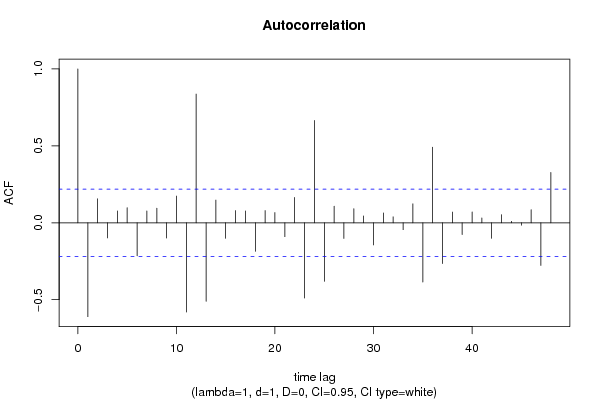
Autocorrelation Function
Time lag kACF(k)T-STATP-value
1-0.609943-5.45550
20.1562151.39720.083104
3-0.098485-0.88090.190511
40.0769850.68860.246541
50.0984980.8810.190479
6-0.214794-1.92120.029135
70.0772240.69070.245872
80.0953770.85310.198081
9-0.098814-0.88380.18972
100.173641.55310.062175
11-0.579985-5.18751e-06
120.8364337.48130
13-0.510341-4.56469e-06
140.1477851.32180.094996
15-0.100834-0.90190.184912
160.079340.70960.239996
170.0767860.68680.247099
18-0.184959-1.65430.05099
190.0798340.71410.238636
200.0668450.59790.275806
21-0.089979-0.80480.211661
220.1649821.47560.071983
23-0.488945-4.37331.8e-05
240.6655815.95310
25-0.380339-3.40190.000524
260.1080740.96660.168317
27-0.101287-0.90590.183843
280.0919620.82250.206608
290.0447730.40050.344941
30-0.143723-1.28550.101164
310.0644490.57650.282965
320.0391250.34990.36365
33-0.044954-0.40210.344349
340.1233971.10370.136516
35-0.385093-3.44440.000457
360.491544.39651.7e-05
37-0.265025-2.37050.010087
380.0698850.62510.266851
39-0.076653-0.68560.247472
400.0709590.63470.263726
410.0319910.28610.387758
42-0.100866-0.90220.184836
430.053120.47510.317999
440.0098140.08780.465136
45-0.015449-0.13820.445224
460.0854060.76390.223588
47-0.277331-2.48050.007609
480.3275322.92950.002211

\begin{tabular}{lllllllll}
\hline
Autocorrelation Function \tabularnewline
Time lag k & ACF(k) & T-STAT & P-value \tabularnewline
1 & -0.609943 & -5.4555 & 0 \tabularnewline
2 & 0.156215 & 1.3972 & 0.083104 \tabularnewline
3 & -0.098485 & -0.8809 & 0.190511 \tabularnewline
4 & 0.076985 & 0.6886 & 0.246541 \tabularnewline
5 & 0.098498 & 0.881 & 0.190479 \tabularnewline
6 & -0.214794 & -1.9212 & 0.029135 \tabularnewline
7 & 0.077224 & 0.6907 & 0.245872 \tabularnewline
8 & 0.095377 & 0.8531 & 0.198081 \tabularnewline
9 & -0.098814 & -0.8838 & 0.18972 \tabularnewline
10 & 0.17364 & 1.5531 & 0.062175 \tabularnewline
11 & -0.579985 & -5.1875 & 1e-06 \tabularnewline
12 & 0.836433 & 7.4813 & 0 \tabularnewline
13 & -0.510341 & -4.5646 & 9e-06 \tabularnewline
14 & 0.147785 & 1.3218 & 0.094996 \tabularnewline
15 & -0.100834 & -0.9019 & 0.184912 \tabularnewline
16 & 0.07934 & 0.7096 & 0.239996 \tabularnewline
17 & 0.076786 & 0.6868 & 0.247099 \tabularnewline
18 & -0.184959 & -1.6543 & 0.05099 \tabularnewline
19 & 0.079834 & 0.7141 & 0.238636 \tabularnewline
20 & 0.066845 & 0.5979 & 0.275806 \tabularnewline
21 & -0.089979 & -0.8048 & 0.211661 \tabularnewline
22 & 0.164982 & 1.4756 & 0.071983 \tabularnewline
23 & -0.488945 & -4.3733 & 1.8e-05 \tabularnewline
24 & 0.665581 & 5.9531 & 0 \tabularnewline
25 & -0.380339 & -3.4019 & 0.000524 \tabularnewline
26 & 0.108074 & 0.9666 & 0.168317 \tabularnewline
27 & -0.101287 & -0.9059 & 0.183843 \tabularnewline
28 & 0.091962 & 0.8225 & 0.206608 \tabularnewline
29 & 0.044773 & 0.4005 & 0.344941 \tabularnewline
30 & -0.143723 & -1.2855 & 0.101164 \tabularnewline
31 & 0.064449 & 0.5765 & 0.282965 \tabularnewline
32 & 0.039125 & 0.3499 & 0.36365 \tabularnewline
33 & -0.044954 & -0.4021 & 0.344349 \tabularnewline
34 & 0.123397 & 1.1037 & 0.136516 \tabularnewline
35 & -0.385093 & -3.4444 & 0.000457 \tabularnewline
36 & 0.49154 & 4.3965 & 1.7e-05 \tabularnewline
37 & -0.265025 & -2.3705 & 0.010087 \tabularnewline
38 & 0.069885 & 0.6251 & 0.266851 \tabularnewline
39 & -0.076653 & -0.6856 & 0.247472 \tabularnewline
40 & 0.070959 & 0.6347 & 0.263726 \tabularnewline
41 & 0.031991 & 0.2861 & 0.387758 \tabularnewline
42 & -0.100866 & -0.9022 & 0.184836 \tabularnewline
43 & 0.05312 & 0.4751 & 0.317999 \tabularnewline
44 & 0.009814 & 0.0878 & 0.465136 \tabularnewline
45 & -0.015449 & -0.1382 & 0.445224 \tabularnewline
46 & 0.085406 & 0.7639 & 0.223588 \tabularnewline
47 & -0.277331 & -2.4805 & 0.007609 \tabularnewline
48 & 0.327532 & 2.9295 & 0.002211 \tabularnewline
\hline
\end{tabular}
%Source: https://freestatistics.org/blog/index.php?pk=72483&T=1

[TABLE]
[ROW][C]Autocorrelation Function[/C][/ROW]
[ROW][C]Time lag k[/C][C]ACF(k)[/C][C]T-STAT[/C][C]P-value[/C][/ROW]
[ROW][C]1[/C][C]-0.609943[/C][C]-5.4555[/C][C]0[/C][/ROW]
[ROW][C]2[/C][C]0.156215[/C][C]1.3972[/C][C]0.083104[/C][/ROW]
[ROW][C]3[/C][C]-0.098485[/C][C]-0.8809[/C][C]0.190511[/C][/ROW]
[ROW][C]4[/C][C]0.076985[/C][C]0.6886[/C][C]0.246541[/C][/ROW]
[ROW][C]5[/C][C]0.098498[/C][C]0.881[/C][C]0.190479[/C][/ROW]
[ROW][C]6[/C][C]-0.214794[/C][C]-1.9212[/C][C]0.029135[/C][/ROW]
[ROW][C]7[/C][C]0.077224[/C][C]0.6907[/C][C]0.245872[/C][/ROW]
[ROW][C]8[/C][C]0.095377[/C][C]0.8531[/C][C]0.198081[/C][/ROW]
[ROW][C]9[/C][C]-0.098814[/C][C]-0.8838[/C][C]0.18972[/C][/ROW]
[ROW][C]10[/C][C]0.17364[/C][C]1.5531[/C][C]0.062175[/C][/ROW]
[ROW][C]11[/C][C]-0.579985[/C][C]-5.1875[/C][C]1e-06[/C][/ROW]
[ROW][C]12[/C][C]0.836433[/C][C]7.4813[/C][C]0[/C][/ROW]
[ROW][C]13[/C][C]-0.510341[/C][C]-4.5646[/C][C]9e-06[/C][/ROW]
[ROW][C]14[/C][C]0.147785[/C][C]1.3218[/C][C]0.094996[/C][/ROW]
[ROW][C]15[/C][C]-0.100834[/C][C]-0.9019[/C][C]0.184912[/C][/ROW]
[ROW][C]16[/C][C]0.07934[/C][C]0.7096[/C][C]0.239996[/C][/ROW]
[ROW][C]17[/C][C]0.076786[/C][C]0.6868[/C][C]0.247099[/C][/ROW]
[ROW][C]18[/C][C]-0.184959[/C][C]-1.6543[/C][C]0.05099[/C][/ROW]
[ROW][C]19[/C][C]0.079834[/C][C]0.7141[/C][C]0.238636[/C][/ROW]
[ROW][C]20[/C][C]0.066845[/C][C]0.5979[/C][C]0.275806[/C][/ROW]
[ROW][C]21[/C][C]-0.089979[/C][C]-0.8048[/C][C]0.211661[/C][/ROW]
[ROW][C]22[/C][C]0.164982[/C][C]1.4756[/C][C]0.071983[/C][/ROW]
[ROW][C]23[/C][C]-0.488945[/C][C]-4.3733[/C][C]1.8e-05[/C][/ROW]
[ROW][C]24[/C][C]0.665581[/C][C]5.9531[/C][C]0[/C][/ROW]
[ROW][C]25[/C][C]-0.380339[/C][C]-3.4019[/C][C]0.000524[/C][/ROW]
[ROW][C]26[/C][C]0.108074[/C][C]0.9666[/C][C]0.168317[/C][/ROW]
[ROW][C]27[/C][C]-0.101287[/C][C]-0.9059[/C][C]0.183843[/C][/ROW]
[ROW][C]28[/C][C]0.091962[/C][C]0.8225[/C][C]0.206608[/C][/ROW]
[ROW][C]29[/C][C]0.044773[/C][C]0.4005[/C][C]0.344941[/C][/ROW]
[ROW][C]30[/C][C]-0.143723[/C][C]-1.2855[/C][C]0.101164[/C][/ROW]
[ROW][C]31[/C][C]0.064449[/C][C]0.5765[/C][C]0.282965[/C][/ROW]
[ROW][C]32[/C][C]0.039125[/C][C]0.3499[/C][C]0.36365[/C][/ROW]
[ROW][C]33[/C][C]-0.044954[/C][C]-0.4021[/C][C]0.344349[/C][/ROW]
[ROW][C]34[/C][C]0.123397[/C][C]1.1037[/C][C]0.136516[/C][/ROW]
[ROW][C]35[/C][C]-0.385093[/C][C]-3.4444[/C][C]0.000457[/C][/ROW]
[ROW][C]36[/C][C]0.49154[/C][C]4.3965[/C][C]1.7e-05[/C][/ROW]
[ROW][C]37[/C][C]-0.265025[/C][C]-2.3705[/C][C]0.010087[/C][/ROW]
[ROW][C]38[/C][C]0.069885[/C][C]0.6251[/C][C]0.266851[/C][/ROW]
[ROW][C]39[/C][C]-0.076653[/C][C]-0.6856[/C][C]0.247472[/C][/ROW]
[ROW][C]40[/C][C]0.070959[/C][C]0.6347[/C][C]0.263726[/C][/ROW]
[ROW][C]41[/C][C]0.031991[/C][C]0.2861[/C][C]0.387758[/C][/ROW]
[ROW][C]42[/C][C]-0.100866[/C][C]-0.9022[/C][C]0.184836[/C][/ROW]
[ROW][C]43[/C][C]0.05312[/C][C]0.4751[/C][C]0.317999[/C][/ROW]
[ROW][C]44[/C][C]0.009814[/C][C]0.0878[/C][C]0.465136[/C][/ROW]
[ROW][C]45[/C][C]-0.015449[/C][C]-0.1382[/C][C]0.445224[/C][/ROW]
[ROW][C]46[/C][C]0.085406[/C][C]0.7639[/C][C]0.223588[/C][/ROW]
[ROW][C]47[/C][C]-0.277331[/C][C]-2.4805[/C][C]0.007609[/C][/ROW]
[ROW][C]48[/C][C]0.327532[/C][C]2.9295[/C][C]0.002211[/C][/ROW]
[/TABLE]
Source: https://freestatistics.org/blog/index.php?pk=72483&T=1

Globally Unique Identifier (entire table): ba.freestatistics.org/blog/index.php?pk=72483&T=1

As an alternative you can also use a QR Code:  

The GUIDs for individual cells are displayed in the table below:

Autocorrelation Function
Time lag kACF(k)T-STATP-value
1-0.609943-5.45550
20.1562151.39720.083104
3-0.098485-0.88090.190511
40.0769850.68860.246541
50.0984980.8810.190479
6-0.214794-1.92120.029135
70.0772240.69070.245872
80.0953770.85310.198081
9-0.098814-0.88380.18972
100.173641.55310.062175
11-0.579985-5.18751e-06
120.8364337.48130
13-0.510341-4.56469e-06
140.1477851.32180.094996
15-0.100834-0.90190.184912
160.079340.70960.239996
170.0767860.68680.247099
18-0.184959-1.65430.05099
190.0798340.71410.238636
200.0668450.59790.275806
21-0.089979-0.80480.211661
220.1649821.47560.071983
23-0.488945-4.37331.8e-05
240.6655815.95310
25-0.380339-3.40190.000524
260.1080740.96660.168317
27-0.101287-0.90590.183843
280.0919620.82250.206608
290.0447730.40050.344941
30-0.143723-1.28550.101164
310.0644490.57650.282965
320.0391250.34990.36365
33-0.044954-0.40210.344349
340.1233971.10370.136516
35-0.385093-3.44440.000457
360.491544.39651.7e-05
37-0.265025-2.37050.010087
380.0698850.62510.266851
39-0.076653-0.68560.247472
400.0709590.63470.263726
410.0319910.28610.387758
42-0.100866-0.90220.184836
430.053120.47510.317999
440.0098140.08780.465136
45-0.015449-0.13820.445224
460.0854060.76390.223588
47-0.277331-2.48050.007609
480.3275322.92950.002211


Partial Autocorrelation Function
Time lag kPACF(k)T-STATP-value
1-0.609943-5.45550
2-0.343673-3.07390.001445
3-0.325169-2.90840.00235
4-0.237767-2.12670.018265
50.0901680.80650.211177
6-0.069915-0.62530.266763
7-0.192491-1.72170.044495
80.0169960.1520.439777
9-0.03823-0.34190.366647
100.2618562.34210.010831
11-0.650343-5.81680
120.3540973.16710.00109
130.1257361.12460.132056
140.0644870.57680.282851
150.0003690.00330.498687
160.0762930.68240.248484
17-0.089609-0.80150.212612
18-0.045165-0.4040.343657
190.0948510.84840.199381
20-0.036012-0.32210.374108
21-0.050097-0.44810.327651
22-0.141462-1.26530.104723
230.0571180.51090.30542
24-0.104052-0.93070.177413
250.1563881.39880.082873
260.0310380.27760.391012
27-0.006936-0.0620.475343
28-0.004008-0.03580.485746
29-0.014957-0.13380.446955
300.03530.31570.376515
31-0.03684-0.32950.371317
32-0.052146-0.46640.321095
330.0075960.06790.473
34-0.013143-0.11760.453358
350.0366080.32740.372097
36-0.026999-0.24150.404897
37-0.016431-0.1470.441765
38-0.088394-0.79060.215751
390.0619410.5540.290556
40-0.063837-0.5710.28481
41-0.015483-0.13850.445105
42-0.002088-0.01870.492572
430.0267110.23890.405895
44-0.006453-0.05770.477058
45-0.021172-0.18940.425142
460.02550.22810.410083
47-0.01106-0.09890.460725
48-0.066082-0.59110.278075

\begin{tabular}{lllllllll}
\hline
Partial Autocorrelation Function \tabularnewline
Time lag k & PACF(k) & T-STAT & P-value \tabularnewline
1 & -0.609943 & -5.4555 & 0 \tabularnewline
2 & -0.343673 & -3.0739 & 0.001445 \tabularnewline
3 & -0.325169 & -2.9084 & 0.00235 \tabularnewline
4 & -0.237767 & -2.1267 & 0.018265 \tabularnewline
5 & 0.090168 & 0.8065 & 0.211177 \tabularnewline
6 & -0.069915 & -0.6253 & 0.266763 \tabularnewline
7 & -0.192491 & -1.7217 & 0.044495 \tabularnewline
8 & 0.016996 & 0.152 & 0.439777 \tabularnewline
9 & -0.03823 & -0.3419 & 0.366647 \tabularnewline
10 & 0.261856 & 2.3421 & 0.010831 \tabularnewline
11 & -0.650343 & -5.8168 & 0 \tabularnewline
12 & 0.354097 & 3.1671 & 0.00109 \tabularnewline
13 & 0.125736 & 1.1246 & 0.132056 \tabularnewline
14 & 0.064487 & 0.5768 & 0.282851 \tabularnewline
15 & 0.000369 & 0.0033 & 0.498687 \tabularnewline
16 & 0.076293 & 0.6824 & 0.248484 \tabularnewline
17 & -0.089609 & -0.8015 & 0.212612 \tabularnewline
18 & -0.045165 & -0.404 & 0.343657 \tabularnewline
19 & 0.094851 & 0.8484 & 0.199381 \tabularnewline
20 & -0.036012 & -0.3221 & 0.374108 \tabularnewline
21 & -0.050097 & -0.4481 & 0.327651 \tabularnewline
22 & -0.141462 & -1.2653 & 0.104723 \tabularnewline
23 & 0.057118 & 0.5109 & 0.30542 \tabularnewline
24 & -0.104052 & -0.9307 & 0.177413 \tabularnewline
25 & 0.156388 & 1.3988 & 0.082873 \tabularnewline
26 & 0.031038 & 0.2776 & 0.391012 \tabularnewline
27 & -0.006936 & -0.062 & 0.475343 \tabularnewline
28 & -0.004008 & -0.0358 & 0.485746 \tabularnewline
29 & -0.014957 & -0.1338 & 0.446955 \tabularnewline
30 & 0.0353 & 0.3157 & 0.376515 \tabularnewline
31 & -0.03684 & -0.3295 & 0.371317 \tabularnewline
32 & -0.052146 & -0.4664 & 0.321095 \tabularnewline
33 & 0.007596 & 0.0679 & 0.473 \tabularnewline
34 & -0.013143 & -0.1176 & 0.453358 \tabularnewline
35 & 0.036608 & 0.3274 & 0.372097 \tabularnewline
36 & -0.026999 & -0.2415 & 0.404897 \tabularnewline
37 & -0.016431 & -0.147 & 0.441765 \tabularnewline
38 & -0.088394 & -0.7906 & 0.215751 \tabularnewline
39 & 0.061941 & 0.554 & 0.290556 \tabularnewline
40 & -0.063837 & -0.571 & 0.28481 \tabularnewline
41 & -0.015483 & -0.1385 & 0.445105 \tabularnewline
42 & -0.002088 & -0.0187 & 0.492572 \tabularnewline
43 & 0.026711 & 0.2389 & 0.405895 \tabularnewline
44 & -0.006453 & -0.0577 & 0.477058 \tabularnewline
45 & -0.021172 & -0.1894 & 0.425142 \tabularnewline
46 & 0.0255 & 0.2281 & 0.410083 \tabularnewline
47 & -0.01106 & -0.0989 & 0.460725 \tabularnewline
48 & -0.066082 & -0.5911 & 0.278075 \tabularnewline
\hline
\end{tabular}
%Source: https://freestatistics.org/blog/index.php?pk=72483&T=2

[TABLE]
[ROW][C]Partial Autocorrelation Function[/C][/ROW]
[ROW][C]Time lag k[/C][C]PACF(k)[/C][C]T-STAT[/C][C]P-value[/C][/ROW]
[ROW][C]1[/C][C]-0.609943[/C][C]-5.4555[/C][C]0[/C][/ROW]
[ROW][C]2[/C][C]-0.343673[/C][C]-3.0739[/C][C]0.001445[/C][/ROW]
[ROW][C]3[/C][C]-0.325169[/C][C]-2.9084[/C][C]0.00235[/C][/ROW]
[ROW][C]4[/C][C]-0.237767[/C][C]-2.1267[/C][C]0.018265[/C][/ROW]
[ROW][C]5[/C][C]0.090168[/C][C]0.8065[/C][C]0.211177[/C][/ROW]
[ROW][C]6[/C][C]-0.069915[/C][C]-0.6253[/C][C]0.266763[/C][/ROW]
[ROW][C]7[/C][C]-0.192491[/C][C]-1.7217[/C][C]0.044495[/C][/ROW]
[ROW][C]8[/C][C]0.016996[/C][C]0.152[/C][C]0.439777[/C][/ROW]
[ROW][C]9[/C][C]-0.03823[/C][C]-0.3419[/C][C]0.366647[/C][/ROW]
[ROW][C]10[/C][C]0.261856[/C][C]2.3421[/C][C]0.010831[/C][/ROW]
[ROW][C]11[/C][C]-0.650343[/C][C]-5.8168[/C][C]0[/C][/ROW]
[ROW][C]12[/C][C]0.354097[/C][C]3.1671[/C][C]0.00109[/C][/ROW]
[ROW][C]13[/C][C]0.125736[/C][C]1.1246[/C][C]0.132056[/C][/ROW]
[ROW][C]14[/C][C]0.064487[/C][C]0.5768[/C][C]0.282851[/C][/ROW]
[ROW][C]15[/C][C]0.000369[/C][C]0.0033[/C][C]0.498687[/C][/ROW]
[ROW][C]16[/C][C]0.076293[/C][C]0.6824[/C][C]0.248484[/C][/ROW]
[ROW][C]17[/C][C]-0.089609[/C][C]-0.8015[/C][C]0.212612[/C][/ROW]
[ROW][C]18[/C][C]-0.045165[/C][C]-0.404[/C][C]0.343657[/C][/ROW]
[ROW][C]19[/C][C]0.094851[/C][C]0.8484[/C][C]0.199381[/C][/ROW]
[ROW][C]20[/C][C]-0.036012[/C][C]-0.3221[/C][C]0.374108[/C][/ROW]
[ROW][C]21[/C][C]-0.050097[/C][C]-0.4481[/C][C]0.327651[/C][/ROW]
[ROW][C]22[/C][C]-0.141462[/C][C]-1.2653[/C][C]0.104723[/C][/ROW]
[ROW][C]23[/C][C]0.057118[/C][C]0.5109[/C][C]0.30542[/C][/ROW]
[ROW][C]24[/C][C]-0.104052[/C][C]-0.9307[/C][C]0.177413[/C][/ROW]
[ROW][C]25[/C][C]0.156388[/C][C]1.3988[/C][C]0.082873[/C][/ROW]
[ROW][C]26[/C][C]0.031038[/C][C]0.2776[/C][C]0.391012[/C][/ROW]
[ROW][C]27[/C][C]-0.006936[/C][C]-0.062[/C][C]0.475343[/C][/ROW]
[ROW][C]28[/C][C]-0.004008[/C][C]-0.0358[/C][C]0.485746[/C][/ROW]
[ROW][C]29[/C][C]-0.014957[/C][C]-0.1338[/C][C]0.446955[/C][/ROW]
[ROW][C]30[/C][C]0.0353[/C][C]0.3157[/C][C]0.376515[/C][/ROW]
[ROW][C]31[/C][C]-0.03684[/C][C]-0.3295[/C][C]0.371317[/C][/ROW]
[ROW][C]32[/C][C]-0.052146[/C][C]-0.4664[/C][C]0.321095[/C][/ROW]
[ROW][C]33[/C][C]0.007596[/C][C]0.0679[/C][C]0.473[/C][/ROW]
[ROW][C]34[/C][C]-0.013143[/C][C]-0.1176[/C][C]0.453358[/C][/ROW]
[ROW][C]35[/C][C]0.036608[/C][C]0.3274[/C][C]0.372097[/C][/ROW]
[ROW][C]36[/C][C]-0.026999[/C][C]-0.2415[/C][C]0.404897[/C][/ROW]
[ROW][C]37[/C][C]-0.016431[/C][C]-0.147[/C][C]0.441765[/C][/ROW]
[ROW][C]38[/C][C]-0.088394[/C][C]-0.7906[/C][C]0.215751[/C][/ROW]
[ROW][C]39[/C][C]0.061941[/C][C]0.554[/C][C]0.290556[/C][/ROW]
[ROW][C]40[/C][C]-0.063837[/C][C]-0.571[/C][C]0.28481[/C][/ROW]
[ROW][C]41[/C][C]-0.015483[/C][C]-0.1385[/C][C]0.445105[/C][/ROW]
[ROW][C]42[/C][C]-0.002088[/C][C]-0.0187[/C][C]0.492572[/C][/ROW]
[ROW][C]43[/C][C]0.026711[/C][C]0.2389[/C][C]0.405895[/C][/ROW]
[ROW][C]44[/C][C]-0.006453[/C][C]-0.0577[/C][C]0.477058[/C][/ROW]
[ROW][C]45[/C][C]-0.021172[/C][C]-0.1894[/C][C]0.425142[/C][/ROW]
[ROW][C]46[/C][C]0.0255[/C][C]0.2281[/C][C]0.410083[/C][/ROW]
[ROW][C]47[/C][C]-0.01106[/C][C]-0.0989[/C][C]0.460725[/C][/ROW]
[ROW][C]48[/C][C]-0.066082[/C][C]-0.5911[/C][C]0.278075[/C][/ROW]
[/TABLE]
Source: https://freestatistics.org/blog/index.php?pk=72483&T=2

Globally Unique Identifier (entire table): ba.freestatistics.org/blog/index.php?pk=72483&T=2

As an alternative you can also use a QR Code:  

The GUIDs for individual cells are displayed in the table below:

Partial Autocorrelation Function
Time lag kPACF(k)T-STATP-value
1-0.609943-5.45550
2-0.343673-3.07390.001445
3-0.325169-2.90840.00235
4-0.237767-2.12670.018265
50.0901680.80650.211177
6-0.069915-0.62530.266763
7-0.192491-1.72170.044495
80.0169960.1520.439777
9-0.03823-0.34190.366647
100.2618562.34210.010831
11-0.650343-5.81680
120.3540973.16710.00109
130.1257361.12460.132056
140.0644870.57680.282851
150.0003690.00330.498687
160.0762930.68240.248484
17-0.089609-0.80150.212612
18-0.045165-0.4040.343657
190.0948510.84840.199381
20-0.036012-0.32210.374108
21-0.050097-0.44810.327651
22-0.141462-1.26530.104723
230.0571180.51090.30542
24-0.104052-0.93070.177413
250.1563881.39880.082873
260.0310380.27760.391012
27-0.006936-0.0620.475343
28-0.004008-0.03580.485746
29-0.014957-0.13380.446955
300.03530.31570.376515
31-0.03684-0.32950.371317
32-0.052146-0.46640.321095
330.0075960.06790.473
34-0.013143-0.11760.453358
350.0366080.32740.372097
36-0.026999-0.24150.404897
37-0.016431-0.1470.441765
38-0.088394-0.79060.215751
390.0619410.5540.290556
40-0.063837-0.5710.28481
41-0.015483-0.13850.445105
42-0.002088-0.01870.492572
430.0267110.23890.405895
44-0.006453-0.05770.477058
45-0.021172-0.18940.425142
460.02550.22810.410083
47-0.01106-0.09890.460725
48-0.066082-0.59110.278075


Parameters (Session):
par1 = 48 ; par2 = 1 ; par3 = 1 ; par4 = 0 ; par5 = 12 ; par6 = White Noise ; par7 = 0.95 ;
Parameters (R input):
par1 = 48 ; par2 = 1 ; par3 = 1 ; par4 = 0 ; par5 = 12 ; par6 = White Noise ; par7 = 0.95 ;
R code (references can be found in the software module):
if (par1 == 'Default') {
par1 = 10*log10(length(x))
} else {
par1 <- as.numeric(par1)
}
par2 <- as.numeric(par2)
par3 <- as.numeric(par3)
par4 <- as.numeric(par4)
par5 <- as.numeric(par5)
if (par6 == 'White Noise') par6 <- 'white' else par6 <- 'ma'
par7 <- as.numeric(par7)
if (par2 == 0) {
x <- log(x)
} else {
x <- (x ^ par2 - 1) / par2
}
if (par3 > 0) x <- diff(x,lag=1,difference=par3)
if (par4 > 0) x <- diff(x,lag=par5,difference=par4)
bitmap(file='pic1.png')
racf <- acf(x, par1, main='Autocorrelation', xlab='time lag', ylab='ACF', ci.type=par6, ci=par7, sub=paste('(lambda=',par2,', d=',par3,', D=',par4,', CI=', par7, ', CI type=',par6,')',sep=''))
dev.off()
bitmap(file='pic2.png')
rpacf <- pacf(x,par1,main='Partial Autocorrelation',xlab='lags',ylab='PACF')
dev.off()
(myacf <- c(racf$acf))
(mypacf <- c(rpacf$acf))
lengthx <- length(x)
sqrtn <- sqrt(lengthx)
load(file='createtable')
a<-table.start()
a<-table.row.start(a)
a<-table.element(a,'Autocorrelation Function',4,TRUE)
a<-table.row.end(a)
a<-table.row.start(a)
a<-table.element(a,'Time lag k',header=TRUE)
a<-table.element(a,hyperlink('basics.htm','ACF(k)','click here for more information about the Autocorrelation Function'),header=TRUE)
a<-table.element(a,'T-STAT',header=TRUE)
a<-table.element(a,'P-value',header=TRUE)
a<-table.row.end(a)
for (i in 2:(par1+1)) {
a<-table.row.start(a)
a<-table.element(a,i-1,header=TRUE)
a<-table.element(a,round(myacf[i],6))
mytstat <- myacf[i]*sqrtn
a<-table.element(a,round(mytstat,4))
a<-table.element(a,round(1-pt(abs(mytstat),lengthx),6))
a<-table.row.end(a)
}
a<-table.end(a)
table.save(a,file='mytable.tab')
a<-table.start()
a<-table.row.start(a)
a<-table.element(a,'Partial Autocorrelation Function',4,TRUE)
a<-table.row.end(a)
a<-table.row.start(a)
a<-table.element(a,'Time lag k',header=TRUE)
a<-table.element(a,hyperlink('basics.htm','PACF(k)','click here for more information about the Partial Autocorrelation Function'),header=TRUE)
a<-table.element(a,'T-STAT',header=TRUE)
a<-table.element(a,'P-value',header=TRUE)
a<-table.row.end(a)
for (i in 1:par1) {
a<-table.row.start(a)
a<-table.element(a,i,header=TRUE)
a<-table.element(a,round(mypacf[i],6))
mytstat <- mypacf[i]*sqrtn
a<-table.element(a,round(mytstat,4))
a<-table.element(a,round(1-pt(abs(mytstat),lengthx),6))
a<-table.row.end(a)
}
a<-table.end(a)
table.save(a,file='mytable1.tab')