Free Statistics

of Irreproducible Research!

Author's title

Author*Unverified author*
R Software Modulerwasp_smp.wasp
Title produced by softwareStandard Deviation-Mean Plot
Date of computationTue, 12 Jan 2010 08:44:15 -0700
Cite this page as followsStatistical Computations at FreeStatistics.org, Office for Research Development and Education, URL https://freestatistics.org/blog/index.php?v=date/2010/Jan/12/t1263311115y9ogp8ydaku5qu8.htm/, Retrieved Wed, 08 May 2024 02:03:59 +0000
Statistical Computations at FreeStatistics.org, Office for Research Development and Education, URL https://freestatistics.org/blog/index.php?pk=72096, Retrieved Wed, 08 May 2024 02:03:59 +0000
QR Codes:

Original text written by user:Verbetering oef. 3 van opgave 8
IsPrivate?No (this computation is public)
User-defined keywordsKDGP2W83
Estimated Impact117
Family? (F = Feedback message, R = changed R code, M = changed R Module, P = changed Parameters, D = changed Data)
-       [Standard Deviation-Mean Plot] [] [2010-01-12 15:44:15] [3124dd9566c5de02f2943664af57df92] [Current]
Feedback Forum

Post a new message
Dataseries X:
91
87
82
89
91
90
87
89
95
85
94
94
97
99
97
96
94
100
96
98
98
94
93
94
94
97
98
95
89
89
89
90
86
92
91
95
99
98
95
96
94
98
98
98
98
102
101
92
99
101
99
102
102
101
99
98
98
99
92
96
94
97
97
93
91
89
87
89
91
83
78
75
80
76
76
78
81
82
83
89
89


Summary of computational transaction
Raw Inputview raw input (R code)
Raw Outputview raw output of R engine
Computing time1 seconds
R Server'Gwilym Jenkins' @ 72.249.127.135

\begin{tabular}{lllllllll}
\hline
Summary of computational transaction \tabularnewline
Raw Input & view raw input (R code)  \tabularnewline
Raw Output & view raw output of R engine  \tabularnewline
Computing time & 1 seconds \tabularnewline
R Server & 'Gwilym Jenkins' @ 72.249.127.135 \tabularnewline
\hline
\end{tabular}
%Source: https://freestatistics.org/blog/index.php?pk=72096&T=0

[TABLE]
[ROW][C]Summary of computational transaction[/C][/ROW]
[ROW][C]Raw Input[/C][C]view raw input (R code) [/C][/ROW]
[ROW][C]Raw Output[/C][C]view raw output of R engine [/C][/ROW]
[ROW][C]Computing time[/C][C]1 seconds[/C][/ROW]
[ROW][C]R Server[/C][C]'Gwilym Jenkins' @ 72.249.127.135[/C][/ROW]
[/TABLE]
Source: https://freestatistics.org/blog/index.php?pk=72096&T=0

Globally Unique Identifier (entire table): ba.freestatistics.org/blog/index.php?pk=72096&T=0

As an alternative you can also use a QR Code:  

The GUIDs for individual cells are displayed in the table below:

Summary of computational transaction
Raw Inputview raw input (R code)
Raw Outputview raw output of R engine
Computing time1 seconds
R Server'Gwilym Jenkins' @ 72.249.127.135


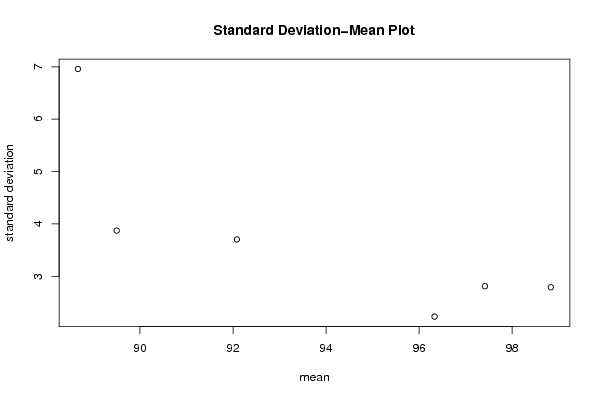
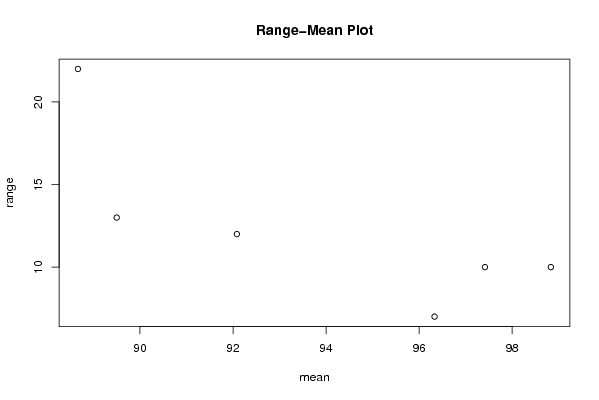
Standard Deviation-Mean Plot
SectionMeanStandard DeviationRange
189.53.8729833462074213
296.33333333333332.229281716090857
392.08333333333333.7040109300185612
497.41666666666672.8109633849474410
598.83333333333332.7906771199618910
688.66666666666676.9587529359966822

\begin{tabular}{lllllllll}
\hline
Standard Deviation-Mean Plot \tabularnewline
Section & Mean & Standard Deviation & Range \tabularnewline
1 & 89.5 & 3.87298334620742 & 13 \tabularnewline
2 & 96.3333333333333 & 2.22928171609085 & 7 \tabularnewline
3 & 92.0833333333333 & 3.70401093001856 & 12 \tabularnewline
4 & 97.4166666666667 & 2.81096338494744 & 10 \tabularnewline
5 & 98.8333333333333 & 2.79067711996189 & 10 \tabularnewline
6 & 88.6666666666667 & 6.95875293599668 & 22 \tabularnewline
\hline
\end{tabular}
%Source: https://freestatistics.org/blog/index.php?pk=72096&T=1

[TABLE]
[ROW][C]Standard Deviation-Mean Plot[/C][/ROW]
[ROW][C]Section[/C][C]Mean[/C][C]Standard Deviation[/C][C]Range[/C][/ROW]
[ROW][C]1[/C][C]89.5[/C][C]3.87298334620742[/C][C]13[/C][/ROW]
[ROW][C]2[/C][C]96.3333333333333[/C][C]2.22928171609085[/C][C]7[/C][/ROW]
[ROW][C]3[/C][C]92.0833333333333[/C][C]3.70401093001856[/C][C]12[/C][/ROW]
[ROW][C]4[/C][C]97.4166666666667[/C][C]2.81096338494744[/C][C]10[/C][/ROW]
[ROW][C]5[/C][C]98.8333333333333[/C][C]2.79067711996189[/C][C]10[/C][/ROW]
[ROW][C]6[/C][C]88.6666666666667[/C][C]6.95875293599668[/C][C]22[/C][/ROW]
[/TABLE]
Source: https://freestatistics.org/blog/index.php?pk=72096&T=1

Globally Unique Identifier (entire table): ba.freestatistics.org/blog/index.php?pk=72096&T=1

As an alternative you can also use a QR Code:  

The GUIDs for individual cells are displayed in the table below:

Standard Deviation-Mean Plot
SectionMeanStandard DeviationRange
189.53.8729833462074213
296.33333333333332.229281716090857
392.08333333333333.7040109300185612
497.41666666666672.8109633849474410
598.83333333333332.7906771199618910
688.66666666666676.9587529359966822


Regression: S.E.(k) = alpha + beta * Mean(k)
alpha33.0968400416329
beta-0.313084461030336
S.D.0.120126913758473
T-STAT-2.60628073455565
p-value0.0596527246393027

\begin{tabular}{lllllllll}
\hline
Regression: S.E.(k) = alpha + beta * Mean(k) \tabularnewline
alpha & 33.0968400416329 \tabularnewline
beta & -0.313084461030336 \tabularnewline
S.D. & 0.120126913758473 \tabularnewline
T-STAT & -2.60628073455565 \tabularnewline
p-value & 0.0596527246393027 \tabularnewline
\hline
\end{tabular}
%Source: https://freestatistics.org/blog/index.php?pk=72096&T=2

[TABLE]
[ROW][C]Regression: S.E.(k) = alpha + beta * Mean(k)[/C][/ROW]
[ROW][C]alpha[/C][C]33.0968400416329[/C][/ROW]
[ROW][C]beta[/C][C]-0.313084461030336[/C][/ROW]
[ROW][C]S.D.[/C][C]0.120126913758473[/C][/ROW]
[ROW][C]T-STAT[/C][C]-2.60628073455565[/C][/ROW]
[ROW][C]p-value[/C][C]0.0596527246393027[/C][/ROW]
[/TABLE]
Source: https://freestatistics.org/blog/index.php?pk=72096&T=2

Globally Unique Identifier (entire table): ba.freestatistics.org/blog/index.php?pk=72096&T=2

As an alternative you can also use a QR Code:  

The GUIDs for individual cells are displayed in the table below:

Regression: S.E.(k) = alpha + beta * Mean(k)
alpha33.0968400416329
beta-0.313084461030336
S.D.0.120126913758473
T-STAT-2.60628073455565
p-value0.0596527246393027


Regression: ln S.E.(k) = alpha + beta * ln Mean(k)
alpha34.1464687110638
beta-7.24665668087186
S.D.2.34399933659842
T-STAT-3.09157795726517
p-value0.0365183245856921
Lambda8.24665668087186

\begin{tabular}{lllllllll}
\hline
Regression: ln S.E.(k) = alpha + beta * ln Mean(k) \tabularnewline
alpha & 34.1464687110638 \tabularnewline
beta & -7.24665668087186 \tabularnewline
S.D. & 2.34399933659842 \tabularnewline
T-STAT & -3.09157795726517 \tabularnewline
p-value & 0.0365183245856921 \tabularnewline
Lambda & 8.24665668087186 \tabularnewline
\hline
\end{tabular}
%Source: https://freestatistics.org/blog/index.php?pk=72096&T=3

[TABLE]
[ROW][C]Regression: ln S.E.(k) = alpha + beta * ln Mean(k)[/C][/ROW]
[ROW][C]alpha[/C][C]34.1464687110638[/C][/ROW]
[ROW][C]beta[/C][C]-7.24665668087186[/C][/ROW]
[ROW][C]S.D.[/C][C]2.34399933659842[/C][/ROW]
[ROW][C]T-STAT[/C][C]-3.09157795726517[/C][/ROW]
[ROW][C]p-value[/C][C]0.0365183245856921[/C][/ROW]
[ROW][C]Lambda[/C][C]8.24665668087186[/C][/ROW]
[/TABLE]
Source: https://freestatistics.org/blog/index.php?pk=72096&T=3

Globally Unique Identifier (entire table): ba.freestatistics.org/blog/index.php?pk=72096&T=3

As an alternative you can also use a QR Code:  

The GUIDs for individual cells are displayed in the table below:

Regression: ln S.E.(k) = alpha + beta * ln Mean(k)
alpha34.1464687110638
beta-7.24665668087186
S.D.2.34399933659842
T-STAT-3.09157795726517
p-value0.0365183245856921
Lambda8.24665668087186


Parameters (Session):
par1 = 12 ;
Parameters (R input):
par1 = 12 ;
R code (references can be found in the software module):
par1 <- as.numeric(par1)
(n <- length(x))
(np <- floor(n / par1))
arr <- array(NA,dim=c(par1,np))
j <- 0
k <- 1
for (i in 1:(np*par1))
{
j = j + 1
arr[j,k] <- x[i]
if (j == par1) {
j = 0
k=k+1
}
}
arr
arr.mean <- array(NA,dim=np)
arr.sd <- array(NA,dim=np)
arr.range <- array(NA,dim=np)
for (j in 1:np)
{
arr.mean[j] <- mean(arr[,j],na.rm=TRUE)
arr.sd[j] <- sd(arr[,j],na.rm=TRUE)
arr.range[j] <- max(arr[,j],na.rm=TRUE) - min(arr[,j],na.rm=TRUE)
}
arr.mean
arr.sd
arr.range
(lm1 <- lm(arr.sd~arr.mean))
(lnlm1 <- lm(log(arr.sd)~log(arr.mean)))
(lm2 <- lm(arr.range~arr.mean))
bitmap(file='test1.png')
plot(arr.mean,arr.sd,main='Standard Deviation-Mean Plot',xlab='mean',ylab='standard deviation')
dev.off()
bitmap(file='test2.png')
plot(arr.mean,arr.range,main='Range-Mean Plot',xlab='mean',ylab='range')
dev.off()
load(file='createtable')
a<-table.start()
a<-table.row.start(a)
a<-table.element(a,'Standard Deviation-Mean Plot',4,TRUE)
a<-table.row.end(a)
a<-table.row.start(a)
a<-table.element(a,'Section',header=TRUE)
a<-table.element(a,'Mean',header=TRUE)
a<-table.element(a,'Standard Deviation',header=TRUE)
a<-table.element(a,'Range',header=TRUE)
a<-table.row.end(a)
for (j in 1:np) {
a<-table.row.start(a)
a<-table.element(a,j,header=TRUE)
a<-table.element(a,arr.mean[j])
a<-table.element(a,arr.sd[j] )
a<-table.element(a,arr.range[j] )
a<-table.row.end(a)
}
a<-table.end(a)
table.save(a,file='mytable.tab')
a<-table.start()
a<-table.row.start(a)
a<-table.element(a,'Regression: S.E.(k) = alpha + beta * Mean(k)',2,TRUE)
a<-table.row.end(a)
a<-table.row.start(a)
a<-table.element(a,'alpha',header=TRUE)
a<-table.element(a,lm1$coefficients[[1]])
a<-table.row.end(a)
a<-table.row.start(a)
a<-table.element(a,'beta',header=TRUE)
a<-table.element(a,lm1$coefficients[[2]])
a<-table.row.end(a)
a<-table.row.start(a)
a<-table.element(a,'S.D.',header=TRUE)
a<-table.element(a,summary(lm1)$coefficients[2,2])
a<-table.row.end(a)
a<-table.row.start(a)
a<-table.element(a,'T-STAT',header=TRUE)
a<-table.element(a,summary(lm1)$coefficients[2,3])
a<-table.row.end(a)
a<-table.row.start(a)
a<-table.element(a,'p-value',header=TRUE)
a<-table.element(a,summary(lm1)$coefficients[2,4])
a<-table.row.end(a)
a<-table.end(a)
table.save(a,file='mytable1.tab')
a<-table.start()
a<-table.row.start(a)
a<-table.element(a,'Regression: ln S.E.(k) = alpha + beta * ln Mean(k)',2,TRUE)
a<-table.row.end(a)
a<-table.row.start(a)
a<-table.element(a,'alpha',header=TRUE)
a<-table.element(a,lnlm1$coefficients[[1]])
a<-table.row.end(a)
a<-table.row.start(a)
a<-table.element(a,'beta',header=TRUE)
a<-table.element(a,lnlm1$coefficients[[2]])
a<-table.row.end(a)
a<-table.row.start(a)
a<-table.element(a,'S.D.',header=TRUE)
a<-table.element(a,summary(lnlm1)$coefficients[2,2])
a<-table.row.end(a)
a<-table.row.start(a)
a<-table.element(a,'T-STAT',header=TRUE)
a<-table.element(a,summary(lnlm1)$coefficients[2,3])
a<-table.row.end(a)
a<-table.row.start(a)
a<-table.element(a,'p-value',header=TRUE)
a<-table.element(a,summary(lnlm1)$coefficients[2,4])
a<-table.row.end(a)
a<-table.row.start(a)
a<-table.element(a,'Lambda',header=TRUE)
a<-table.element(a,1-lnlm1$coefficients[[2]])
a<-table.row.end(a)
a<-table.end(a)
table.save(a,file='mytable2.tab')