Free Statistics

of Irreproducible Research!

Author's title

Author*The author of this computation has been verified*
R Software Modulerwasp_autocorrelation.wasp
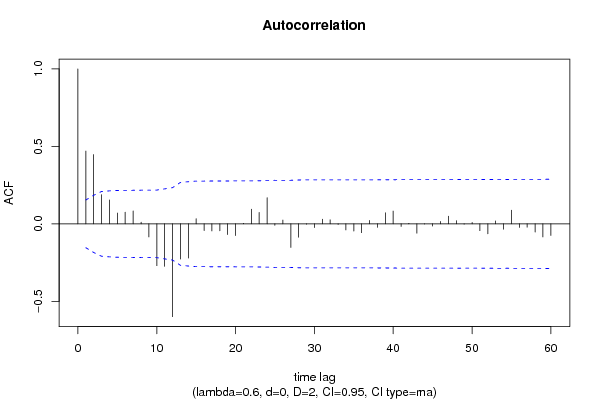
Title produced by software(Partial) Autocorrelation Function
Date of computationTue, 12 Jan 2010 05:35:39 -0700
Cite this page as followsStatistical Computations at FreeStatistics.org, Office for Research Development and Education, URL https://freestatistics.org/blog/index.php?v=date/2010/Jan/12/t1263299796tmjrhwbnjm57xam.htm/, Retrieved Tue, 07 May 2024 10:34:05 +0000
Statistical Computations at FreeStatistics.org, Office for Research Development and Education, URL https://freestatistics.org/blog/index.php?pk=72038, Retrieved Tue, 07 May 2024 10:34:05 +0000
QR Codes:

Original text written by user:
IsPrivate?No (this computation is public)
User-defined keywords
Estimated Impact128
Family? (F = Feedback message, R = changed R code, M = changed R Module, P = changed Parameters, D = changed Data)
-     [Univariate Data Series] [] [2009-12-17 19:09:08] [b98453cac15ba1066b407e146608df68]
- RMP   [(Partial) Autocorrelation Function] [] [2009-12-17 19:26:45] [b98453cac15ba1066b407e146608df68]
-   P       [(Partial) Autocorrelation Function] [] [2010-01-12 12:35:39] [7ed3c7cd7b86afd1930511b5492d29ea] [Current]
Feedback Forum

Post a new message
Dataseries X:
277
260.6
291.6
275.4
275.3
231.7
238.8
274.2
277.8
299.1
286.6
232.3
294.1
267.5
309.7
280.7
287.3
235.7
256.4
289
290.8
321.9
291.8
241.4
295.5
258.2
306.1
281.5
283.1
237.4
274.8
299.3
300.4
340.9
318.8
265.7
322.7
281.6
323.5
312.6
310.8
262.8
273.8
320
310.3
342.2
320.1
265.6
327
300.7
346.4
317.3
326.2
270.7
278.2
324.6
321.8
343.5
354
278.2
330.2
307.3
375.9
335.3
339.3
280.3
293.7
341.2
345.1
368.7
369.4
288.4
341
319.1
374.2
344.5
337.3
281
282.2
321
325.4
366.3
380.3
300.7
359.3
327.6
383.6
352.4
329.4
294.5
333.5
334.3
358
396.1
387
307.2
363.9
344.7
397.6
376.8
337.1
299.3
323.1
329.1
347
462
436.5
360.4
415.5
382.1
432.2
424.3
386.7
354.5
375.8
368
402.4
426.5
433.3
338.5
416.8
381.1
445.7
412.4
394
348.2
380.1
373.7
393.6
434.2
430.7
344.5
411.9
370.5
437.3
411.3
385.5
341.3
384.2
373.2
415.8
448.6
454.3
350.3
419.1
398
456.1
430.1
399.8
362.7
384.9
385.3
432.3
468.9
442.7
370.2
439.4
393.9
468.7
438.8
430.1
366.3
391
380.9
431.4
465.4
471.5
387.5
446.4
421.5
504.8
492.1
421.3
396.7
428
421.9
465.6
525.8
499.9
435.3
479.5
473
554.4
489.6
462.2
420.3


Summary of computational transaction
Raw Inputview raw input (R code)
Raw Outputview raw output of R engine
Computing time1 seconds
R Server'Gwilym Jenkins' @ 72.249.127.135

\begin{tabular}{lllllllll}
\hline
Summary of computational transaction \tabularnewline
Raw Input & view raw input (R code)  \tabularnewline
Raw Output & view raw output of R engine  \tabularnewline
Computing time & 1 seconds \tabularnewline
R Server & 'Gwilym Jenkins' @ 72.249.127.135 \tabularnewline
\hline
\end{tabular}
%Source: https://freestatistics.org/blog/index.php?pk=72038&T=0

[TABLE]
[ROW][C]Summary of computational transaction[/C][/ROW]
[ROW][C]Raw Input[/C][C]view raw input (R code) [/C][/ROW]
[ROW][C]Raw Output[/C][C]view raw output of R engine [/C][/ROW]
[ROW][C]Computing time[/C][C]1 seconds[/C][/ROW]
[ROW][C]R Server[/C][C]'Gwilym Jenkins' @ 72.249.127.135[/C][/ROW]
[/TABLE]
Source: https://freestatistics.org/blog/index.php?pk=72038&T=0

Globally Unique Identifier (entire table): ba.freestatistics.org/blog/index.php?pk=72038&T=0

As an alternative you can also use a QR Code:  

The GUIDs for individual cells are displayed in the table below:

Summary of computational transaction
Raw Inputview raw input (R code)
Raw Outputview raw output of R engine
Computing time1 seconds
R Server'Gwilym Jenkins' @ 72.249.127.135


Autocorrelation Function
Time lag kACF(k)T-STATP-value
10.4696865.97810
20.447585.69680
30.1886792.40150.00873
40.1546531.96840.025364
50.0695340.8850.188728
60.0750970.95580.17029
70.0831961.05890.145608
80.0107190.13640.445827
9-0.084608-1.07690.141566
10-0.269639-3.43190.00038
11-0.273711-3.48380.000318
12-0.598896-7.62270
13-0.226915-2.88820.002203
14-0.220484-2.80630.002813
150.0333590.42460.335851
16-0.042841-0.54530.293157
17-0.045377-0.57760.282183
18-0.045047-0.57330.283602
19-0.068869-0.87660.19101
20-0.07541-0.95980.169291
210.0038550.04910.480465
220.0944251.20180.115591
230.0736610.93760.174934
240.1692962.15480.016328
25-0.009364-0.11920.452638
260.0247550.31510.376553
27-0.151799-1.93210.027547
28-0.086033-1.0950.137566
29-0.001914-0.02440.490298
30-0.023993-0.30540.380236
310.0305460.38880.348973
320.0265850.33840.36776
33-0.003278-0.04170.483385
34-0.039325-0.50050.308691
35-0.046566-0.59270.277109
36-0.056838-0.72340.235228
370.0223240.28410.388333
38-0.022053-0.28070.389655
390.0711570.90570.183225
400.0826521.0520.147185
41-0.016763-0.21340.41566
420.003890.04950.480288
43-0.060494-0.770.221222
44-0.000921-0.01170.495332
45-0.014342-0.18250.427694
460.0160390.20410.419251
470.049580.63110.264448
480.0203840.25940.397811
49-0.002364-0.03010.488018
500.0094630.12040.45214
51-0.043672-0.55590.28954
52-0.064479-0.82070.206515
530.01920.24440.403626
54-0.034578-0.44010.330224
550.0881011.12130.1319
56-0.022906-0.29150.385506
57-0.021502-0.27370.392342
58-0.052823-0.67230.251167
59-0.084515-1.07570.141831
60-0.074564-0.9490.172005

\begin{tabular}{lllllllll}
\hline
Autocorrelation Function \tabularnewline
Time lag k & ACF(k) & T-STAT & P-value \tabularnewline
1 & 0.469686 & 5.9781 & 0 \tabularnewline
2 & 0.44758 & 5.6968 & 0 \tabularnewline
3 & 0.188679 & 2.4015 & 0.00873 \tabularnewline
4 & 0.154653 & 1.9684 & 0.025364 \tabularnewline
5 & 0.069534 & 0.885 & 0.188728 \tabularnewline
6 & 0.075097 & 0.9558 & 0.17029 \tabularnewline
7 & 0.083196 & 1.0589 & 0.145608 \tabularnewline
8 & 0.010719 & 0.1364 & 0.445827 \tabularnewline
9 & -0.084608 & -1.0769 & 0.141566 \tabularnewline
10 & -0.269639 & -3.4319 & 0.00038 \tabularnewline
11 & -0.273711 & -3.4838 & 0.000318 \tabularnewline
12 & -0.598896 & -7.6227 & 0 \tabularnewline
13 & -0.226915 & -2.8882 & 0.002203 \tabularnewline
14 & -0.220484 & -2.8063 & 0.002813 \tabularnewline
15 & 0.033359 & 0.4246 & 0.335851 \tabularnewline
16 & -0.042841 & -0.5453 & 0.293157 \tabularnewline
17 & -0.045377 & -0.5776 & 0.282183 \tabularnewline
18 & -0.045047 & -0.5733 & 0.283602 \tabularnewline
19 & -0.068869 & -0.8766 & 0.19101 \tabularnewline
20 & -0.07541 & -0.9598 & 0.169291 \tabularnewline
21 & 0.003855 & 0.0491 & 0.480465 \tabularnewline
22 & 0.094425 & 1.2018 & 0.115591 \tabularnewline
23 & 0.073661 & 0.9376 & 0.174934 \tabularnewline
24 & 0.169296 & 2.1548 & 0.016328 \tabularnewline
25 & -0.009364 & -0.1192 & 0.452638 \tabularnewline
26 & 0.024755 & 0.3151 & 0.376553 \tabularnewline
27 & -0.151799 & -1.9321 & 0.027547 \tabularnewline
28 & -0.086033 & -1.095 & 0.137566 \tabularnewline
29 & -0.001914 & -0.0244 & 0.490298 \tabularnewline
30 & -0.023993 & -0.3054 & 0.380236 \tabularnewline
31 & 0.030546 & 0.3888 & 0.348973 \tabularnewline
32 & 0.026585 & 0.3384 & 0.36776 \tabularnewline
33 & -0.003278 & -0.0417 & 0.483385 \tabularnewline
34 & -0.039325 & -0.5005 & 0.308691 \tabularnewline
35 & -0.046566 & -0.5927 & 0.277109 \tabularnewline
36 & -0.056838 & -0.7234 & 0.235228 \tabularnewline
37 & 0.022324 & 0.2841 & 0.388333 \tabularnewline
38 & -0.022053 & -0.2807 & 0.389655 \tabularnewline
39 & 0.071157 & 0.9057 & 0.183225 \tabularnewline
40 & 0.082652 & 1.052 & 0.147185 \tabularnewline
41 & -0.016763 & -0.2134 & 0.41566 \tabularnewline
42 & 0.00389 & 0.0495 & 0.480288 \tabularnewline
43 & -0.060494 & -0.77 & 0.221222 \tabularnewline
44 & -0.000921 & -0.0117 & 0.495332 \tabularnewline
45 & -0.014342 & -0.1825 & 0.427694 \tabularnewline
46 & 0.016039 & 0.2041 & 0.419251 \tabularnewline
47 & 0.04958 & 0.6311 & 0.264448 \tabularnewline
48 & 0.020384 & 0.2594 & 0.397811 \tabularnewline
49 & -0.002364 & -0.0301 & 0.488018 \tabularnewline
50 & 0.009463 & 0.1204 & 0.45214 \tabularnewline
51 & -0.043672 & -0.5559 & 0.28954 \tabularnewline
52 & -0.064479 & -0.8207 & 0.206515 \tabularnewline
53 & 0.0192 & 0.2444 & 0.403626 \tabularnewline
54 & -0.034578 & -0.4401 & 0.330224 \tabularnewline
55 & 0.088101 & 1.1213 & 0.1319 \tabularnewline
56 & -0.022906 & -0.2915 & 0.385506 \tabularnewline
57 & -0.021502 & -0.2737 & 0.392342 \tabularnewline
58 & -0.052823 & -0.6723 & 0.251167 \tabularnewline
59 & -0.084515 & -1.0757 & 0.141831 \tabularnewline
60 & -0.074564 & -0.949 & 0.172005 \tabularnewline
\hline
\end{tabular}
%Source: https://freestatistics.org/blog/index.php?pk=72038&T=1

[TABLE]
[ROW][C]Autocorrelation Function[/C][/ROW]
[ROW][C]Time lag k[/C][C]ACF(k)[/C][C]T-STAT[/C][C]P-value[/C][/ROW]
[ROW][C]1[/C][C]0.469686[/C][C]5.9781[/C][C]0[/C][/ROW]
[ROW][C]2[/C][C]0.44758[/C][C]5.6968[/C][C]0[/C][/ROW]
[ROW][C]3[/C][C]0.188679[/C][C]2.4015[/C][C]0.00873[/C][/ROW]
[ROW][C]4[/C][C]0.154653[/C][C]1.9684[/C][C]0.025364[/C][/ROW]
[ROW][C]5[/C][C]0.069534[/C][C]0.885[/C][C]0.188728[/C][/ROW]
[ROW][C]6[/C][C]0.075097[/C][C]0.9558[/C][C]0.17029[/C][/ROW]
[ROW][C]7[/C][C]0.083196[/C][C]1.0589[/C][C]0.145608[/C][/ROW]
[ROW][C]8[/C][C]0.010719[/C][C]0.1364[/C][C]0.445827[/C][/ROW]
[ROW][C]9[/C][C]-0.084608[/C][C]-1.0769[/C][C]0.141566[/C][/ROW]
[ROW][C]10[/C][C]-0.269639[/C][C]-3.4319[/C][C]0.00038[/C][/ROW]
[ROW][C]11[/C][C]-0.273711[/C][C]-3.4838[/C][C]0.000318[/C][/ROW]
[ROW][C]12[/C][C]-0.598896[/C][C]-7.6227[/C][C]0[/C][/ROW]
[ROW][C]13[/C][C]-0.226915[/C][C]-2.8882[/C][C]0.002203[/C][/ROW]
[ROW][C]14[/C][C]-0.220484[/C][C]-2.8063[/C][C]0.002813[/C][/ROW]
[ROW][C]15[/C][C]0.033359[/C][C]0.4246[/C][C]0.335851[/C][/ROW]
[ROW][C]16[/C][C]-0.042841[/C][C]-0.5453[/C][C]0.293157[/C][/ROW]
[ROW][C]17[/C][C]-0.045377[/C][C]-0.5776[/C][C]0.282183[/C][/ROW]
[ROW][C]18[/C][C]-0.045047[/C][C]-0.5733[/C][C]0.283602[/C][/ROW]
[ROW][C]19[/C][C]-0.068869[/C][C]-0.8766[/C][C]0.19101[/C][/ROW]
[ROW][C]20[/C][C]-0.07541[/C][C]-0.9598[/C][C]0.169291[/C][/ROW]
[ROW][C]21[/C][C]0.003855[/C][C]0.0491[/C][C]0.480465[/C][/ROW]
[ROW][C]22[/C][C]0.094425[/C][C]1.2018[/C][C]0.115591[/C][/ROW]
[ROW][C]23[/C][C]0.073661[/C][C]0.9376[/C][C]0.174934[/C][/ROW]
[ROW][C]24[/C][C]0.169296[/C][C]2.1548[/C][C]0.016328[/C][/ROW]
[ROW][C]25[/C][C]-0.009364[/C][C]-0.1192[/C][C]0.452638[/C][/ROW]
[ROW][C]26[/C][C]0.024755[/C][C]0.3151[/C][C]0.376553[/C][/ROW]
[ROW][C]27[/C][C]-0.151799[/C][C]-1.9321[/C][C]0.027547[/C][/ROW]
[ROW][C]28[/C][C]-0.086033[/C][C]-1.095[/C][C]0.137566[/C][/ROW]
[ROW][C]29[/C][C]-0.001914[/C][C]-0.0244[/C][C]0.490298[/C][/ROW]
[ROW][C]30[/C][C]-0.023993[/C][C]-0.3054[/C][C]0.380236[/C][/ROW]
[ROW][C]31[/C][C]0.030546[/C][C]0.3888[/C][C]0.348973[/C][/ROW]
[ROW][C]32[/C][C]0.026585[/C][C]0.3384[/C][C]0.36776[/C][/ROW]
[ROW][C]33[/C][C]-0.003278[/C][C]-0.0417[/C][C]0.483385[/C][/ROW]
[ROW][C]34[/C][C]-0.039325[/C][C]-0.5005[/C][C]0.308691[/C][/ROW]
[ROW][C]35[/C][C]-0.046566[/C][C]-0.5927[/C][C]0.277109[/C][/ROW]
[ROW][C]36[/C][C]-0.056838[/C][C]-0.7234[/C][C]0.235228[/C][/ROW]
[ROW][C]37[/C][C]0.022324[/C][C]0.2841[/C][C]0.388333[/C][/ROW]
[ROW][C]38[/C][C]-0.022053[/C][C]-0.2807[/C][C]0.389655[/C][/ROW]
[ROW][C]39[/C][C]0.071157[/C][C]0.9057[/C][C]0.183225[/C][/ROW]
[ROW][C]40[/C][C]0.082652[/C][C]1.052[/C][C]0.147185[/C][/ROW]
[ROW][C]41[/C][C]-0.016763[/C][C]-0.2134[/C][C]0.41566[/C][/ROW]
[ROW][C]42[/C][C]0.00389[/C][C]0.0495[/C][C]0.480288[/C][/ROW]
[ROW][C]43[/C][C]-0.060494[/C][C]-0.77[/C][C]0.221222[/C][/ROW]
[ROW][C]44[/C][C]-0.000921[/C][C]-0.0117[/C][C]0.495332[/C][/ROW]
[ROW][C]45[/C][C]-0.014342[/C][C]-0.1825[/C][C]0.427694[/C][/ROW]
[ROW][C]46[/C][C]0.016039[/C][C]0.2041[/C][C]0.419251[/C][/ROW]
[ROW][C]47[/C][C]0.04958[/C][C]0.6311[/C][C]0.264448[/C][/ROW]
[ROW][C]48[/C][C]0.020384[/C][C]0.2594[/C][C]0.397811[/C][/ROW]
[ROW][C]49[/C][C]-0.002364[/C][C]-0.0301[/C][C]0.488018[/C][/ROW]
[ROW][C]50[/C][C]0.009463[/C][C]0.1204[/C][C]0.45214[/C][/ROW]
[ROW][C]51[/C][C]-0.043672[/C][C]-0.5559[/C][C]0.28954[/C][/ROW]
[ROW][C]52[/C][C]-0.064479[/C][C]-0.8207[/C][C]0.206515[/C][/ROW]
[ROW][C]53[/C][C]0.0192[/C][C]0.2444[/C][C]0.403626[/C][/ROW]
[ROW][C]54[/C][C]-0.034578[/C][C]-0.4401[/C][C]0.330224[/C][/ROW]
[ROW][C]55[/C][C]0.088101[/C][C]1.1213[/C][C]0.1319[/C][/ROW]
[ROW][C]56[/C][C]-0.022906[/C][C]-0.2915[/C][C]0.385506[/C][/ROW]
[ROW][C]57[/C][C]-0.021502[/C][C]-0.2737[/C][C]0.392342[/C][/ROW]
[ROW][C]58[/C][C]-0.052823[/C][C]-0.6723[/C][C]0.251167[/C][/ROW]
[ROW][C]59[/C][C]-0.084515[/C][C]-1.0757[/C][C]0.141831[/C][/ROW]
[ROW][C]60[/C][C]-0.074564[/C][C]-0.949[/C][C]0.172005[/C][/ROW]
[/TABLE]
Source: https://freestatistics.org/blog/index.php?pk=72038&T=1

Globally Unique Identifier (entire table): ba.freestatistics.org/blog/index.php?pk=72038&T=1

As an alternative you can also use a QR Code:  

The GUIDs for individual cells are displayed in the table below:

Autocorrelation Function
Time lag kACF(k)T-STATP-value
10.4696865.97810
20.447585.69680
30.1886792.40150.00873
40.1546531.96840.025364
50.0695340.8850.188728
60.0750970.95580.17029
70.0831961.05890.145608
80.0107190.13640.445827
9-0.084608-1.07690.141566
10-0.269639-3.43190.00038
11-0.273711-3.48380.000318
12-0.598896-7.62270
13-0.226915-2.88820.002203
14-0.220484-2.80630.002813
150.0333590.42460.335851
16-0.042841-0.54530.293157
17-0.045377-0.57760.282183
18-0.045047-0.57330.283602
19-0.068869-0.87660.19101
20-0.07541-0.95980.169291
210.0038550.04910.480465
220.0944251.20180.115591
230.0736610.93760.174934
240.1692962.15480.016328
25-0.009364-0.11920.452638
260.0247550.31510.376553
27-0.151799-1.93210.027547
28-0.086033-1.0950.137566
29-0.001914-0.02440.490298
30-0.023993-0.30540.380236
310.0305460.38880.348973
320.0265850.33840.36776
33-0.003278-0.04170.483385
34-0.039325-0.50050.308691
35-0.046566-0.59270.277109
36-0.056838-0.72340.235228
370.0223240.28410.388333
38-0.022053-0.28070.389655
390.0711570.90570.183225
400.0826521.0520.147185
41-0.016763-0.21340.41566
420.003890.04950.480288
43-0.060494-0.770.221222
44-0.000921-0.01170.495332
45-0.014342-0.18250.427694
460.0160390.20410.419251
470.049580.63110.264448
480.0203840.25940.397811
49-0.002364-0.03010.488018
500.0094630.12040.45214
51-0.043672-0.55590.28954
52-0.064479-0.82070.206515
530.01920.24440.403626
54-0.034578-0.44010.330224
550.0881011.12130.1319
56-0.022906-0.29150.385506
57-0.021502-0.27370.392342
58-0.052823-0.67230.251167
59-0.084515-1.07570.141831
60-0.074564-0.9490.172005


Partial Autocorrelation Function
Time lag kPACF(k)T-STATP-value
10.4696865.97810
20.2912193.70660.000144
3-0.136135-1.73270.042525
4-0.003324-0.04230.483154
50.0145950.18580.426432
60.0287770.36630.35732
70.0584690.74420.22892
8-0.089199-1.13530.128959
9-0.155735-1.98220.024575
10-0.254355-3.23740.000732
11-0.053987-0.68710.246489
12-0.482373-6.13960
130.3636354.62834e-06
140.1910782.4320.008052
150.1447741.84270.033602
16-0.061075-0.77740.219041
17-0.172247-2.19230.014891
180.0701080.89230.186771
190.0212260.27020.393688
20-0.151943-1.93390.027433
21-0.075517-0.96120.168948
22-0.096559-1.2290.110428
23-0.036915-0.46990.319545
24-0.187156-2.38210.009187
250.1521591.93670.027263
260.1552051.97540.024958
270.0716230.91160.181662
28-0.150184-1.91150.028851
290.0177710.22620.41067
30-0.035932-0.45730.324021
310.0824861.04990.147668
32-0.07648-0.97340.165895
33-0.092399-1.1760.120651
34-0.032572-0.41460.339499
35-0.034851-0.44360.328969
36-0.105815-1.34680.089962
370.033630.4280.334595
380.0699750.89060.187222
390.0626250.79710.213284
400.038390.48860.312882
41-0.061624-0.78430.216991
42-0.055739-0.70940.239536
430.0675850.86020.19547
44-0.011087-0.14110.443978
45-0.050661-0.64480.25998
46-0.03006-0.38260.35126
47-0.000513-0.00650.497401
48-0.12765-1.62470.053084
490.0253130.32220.373866
500.0222450.28310.388719
510.0067120.08540.466013
520.0528320.67240.251131
530.0317420.4040.343368
54-0.146532-1.8650.031992
550.1330451.69340.046152
56-0.002661-0.03390.486514
57-0.138739-1.76590.039652
58-0.061301-0.78020.218197
59-0.032455-0.41310.340046
60-0.139647-1.77740.038688

\begin{tabular}{lllllllll}
\hline
Partial Autocorrelation Function \tabularnewline
Time lag k & PACF(k) & T-STAT & P-value \tabularnewline
1 & 0.469686 & 5.9781 & 0 \tabularnewline
2 & 0.291219 & 3.7066 & 0.000144 \tabularnewline
3 & -0.136135 & -1.7327 & 0.042525 \tabularnewline
4 & -0.003324 & -0.0423 & 0.483154 \tabularnewline
5 & 0.014595 & 0.1858 & 0.426432 \tabularnewline
6 & 0.028777 & 0.3663 & 0.35732 \tabularnewline
7 & 0.058469 & 0.7442 & 0.22892 \tabularnewline
8 & -0.089199 & -1.1353 & 0.128959 \tabularnewline
9 & -0.155735 & -1.9822 & 0.024575 \tabularnewline
10 & -0.254355 & -3.2374 & 0.000732 \tabularnewline
11 & -0.053987 & -0.6871 & 0.246489 \tabularnewline
12 & -0.482373 & -6.1396 & 0 \tabularnewline
13 & 0.363635 & 4.6283 & 4e-06 \tabularnewline
14 & 0.191078 & 2.432 & 0.008052 \tabularnewline
15 & 0.144774 & 1.8427 & 0.033602 \tabularnewline
16 & -0.061075 & -0.7774 & 0.219041 \tabularnewline
17 & -0.172247 & -2.1923 & 0.014891 \tabularnewline
18 & 0.070108 & 0.8923 & 0.186771 \tabularnewline
19 & 0.021226 & 0.2702 & 0.393688 \tabularnewline
20 & -0.151943 & -1.9339 & 0.027433 \tabularnewline
21 & -0.075517 & -0.9612 & 0.168948 \tabularnewline
22 & -0.096559 & -1.229 & 0.110428 \tabularnewline
23 & -0.036915 & -0.4699 & 0.319545 \tabularnewline
24 & -0.187156 & -2.3821 & 0.009187 \tabularnewline
25 & 0.152159 & 1.9367 & 0.027263 \tabularnewline
26 & 0.155205 & 1.9754 & 0.024958 \tabularnewline
27 & 0.071623 & 0.9116 & 0.181662 \tabularnewline
28 & -0.150184 & -1.9115 & 0.028851 \tabularnewline
29 & 0.017771 & 0.2262 & 0.41067 \tabularnewline
30 & -0.035932 & -0.4573 & 0.324021 \tabularnewline
31 & 0.082486 & 1.0499 & 0.147668 \tabularnewline
32 & -0.07648 & -0.9734 & 0.165895 \tabularnewline
33 & -0.092399 & -1.176 & 0.120651 \tabularnewline
34 & -0.032572 & -0.4146 & 0.339499 \tabularnewline
35 & -0.034851 & -0.4436 & 0.328969 \tabularnewline
36 & -0.105815 & -1.3468 & 0.089962 \tabularnewline
37 & 0.03363 & 0.428 & 0.334595 \tabularnewline
38 & 0.069975 & 0.8906 & 0.187222 \tabularnewline
39 & 0.062625 & 0.7971 & 0.213284 \tabularnewline
40 & 0.03839 & 0.4886 & 0.312882 \tabularnewline
41 & -0.061624 & -0.7843 & 0.216991 \tabularnewline
42 & -0.055739 & -0.7094 & 0.239536 \tabularnewline
43 & 0.067585 & 0.8602 & 0.19547 \tabularnewline
44 & -0.011087 & -0.1411 & 0.443978 \tabularnewline
45 & -0.050661 & -0.6448 & 0.25998 \tabularnewline
46 & -0.03006 & -0.3826 & 0.35126 \tabularnewline
47 & -0.000513 & -0.0065 & 0.497401 \tabularnewline
48 & -0.12765 & -1.6247 & 0.053084 \tabularnewline
49 & 0.025313 & 0.3222 & 0.373866 \tabularnewline
50 & 0.022245 & 0.2831 & 0.388719 \tabularnewline
51 & 0.006712 & 0.0854 & 0.466013 \tabularnewline
52 & 0.052832 & 0.6724 & 0.251131 \tabularnewline
53 & 0.031742 & 0.404 & 0.343368 \tabularnewline
54 & -0.146532 & -1.865 & 0.031992 \tabularnewline
55 & 0.133045 & 1.6934 & 0.046152 \tabularnewline
56 & -0.002661 & -0.0339 & 0.486514 \tabularnewline
57 & -0.138739 & -1.7659 & 0.039652 \tabularnewline
58 & -0.061301 & -0.7802 & 0.218197 \tabularnewline
59 & -0.032455 & -0.4131 & 0.340046 \tabularnewline
60 & -0.139647 & -1.7774 & 0.038688 \tabularnewline
\hline
\end{tabular}
%Source: https://freestatistics.org/blog/index.php?pk=72038&T=2

[TABLE]
[ROW][C]Partial Autocorrelation Function[/C][/ROW]
[ROW][C]Time lag k[/C][C]PACF(k)[/C][C]T-STAT[/C][C]P-value[/C][/ROW]
[ROW][C]1[/C][C]0.469686[/C][C]5.9781[/C][C]0[/C][/ROW]
[ROW][C]2[/C][C]0.291219[/C][C]3.7066[/C][C]0.000144[/C][/ROW]
[ROW][C]3[/C][C]-0.136135[/C][C]-1.7327[/C][C]0.042525[/C][/ROW]
[ROW][C]4[/C][C]-0.003324[/C][C]-0.0423[/C][C]0.483154[/C][/ROW]
[ROW][C]5[/C][C]0.014595[/C][C]0.1858[/C][C]0.426432[/C][/ROW]
[ROW][C]6[/C][C]0.028777[/C][C]0.3663[/C][C]0.35732[/C][/ROW]
[ROW][C]7[/C][C]0.058469[/C][C]0.7442[/C][C]0.22892[/C][/ROW]
[ROW][C]8[/C][C]-0.089199[/C][C]-1.1353[/C][C]0.128959[/C][/ROW]
[ROW][C]9[/C][C]-0.155735[/C][C]-1.9822[/C][C]0.024575[/C][/ROW]
[ROW][C]10[/C][C]-0.254355[/C][C]-3.2374[/C][C]0.000732[/C][/ROW]
[ROW][C]11[/C][C]-0.053987[/C][C]-0.6871[/C][C]0.246489[/C][/ROW]
[ROW][C]12[/C][C]-0.482373[/C][C]-6.1396[/C][C]0[/C][/ROW]
[ROW][C]13[/C][C]0.363635[/C][C]4.6283[/C][C]4e-06[/C][/ROW]
[ROW][C]14[/C][C]0.191078[/C][C]2.432[/C][C]0.008052[/C][/ROW]
[ROW][C]15[/C][C]0.144774[/C][C]1.8427[/C][C]0.033602[/C][/ROW]
[ROW][C]16[/C][C]-0.061075[/C][C]-0.7774[/C][C]0.219041[/C][/ROW]
[ROW][C]17[/C][C]-0.172247[/C][C]-2.1923[/C][C]0.014891[/C][/ROW]
[ROW][C]18[/C][C]0.070108[/C][C]0.8923[/C][C]0.186771[/C][/ROW]
[ROW][C]19[/C][C]0.021226[/C][C]0.2702[/C][C]0.393688[/C][/ROW]
[ROW][C]20[/C][C]-0.151943[/C][C]-1.9339[/C][C]0.027433[/C][/ROW]
[ROW][C]21[/C][C]-0.075517[/C][C]-0.9612[/C][C]0.168948[/C][/ROW]
[ROW][C]22[/C][C]-0.096559[/C][C]-1.229[/C][C]0.110428[/C][/ROW]
[ROW][C]23[/C][C]-0.036915[/C][C]-0.4699[/C][C]0.319545[/C][/ROW]
[ROW][C]24[/C][C]-0.187156[/C][C]-2.3821[/C][C]0.009187[/C][/ROW]
[ROW][C]25[/C][C]0.152159[/C][C]1.9367[/C][C]0.027263[/C][/ROW]
[ROW][C]26[/C][C]0.155205[/C][C]1.9754[/C][C]0.024958[/C][/ROW]
[ROW][C]27[/C][C]0.071623[/C][C]0.9116[/C][C]0.181662[/C][/ROW]
[ROW][C]28[/C][C]-0.150184[/C][C]-1.9115[/C][C]0.028851[/C][/ROW]
[ROW][C]29[/C][C]0.017771[/C][C]0.2262[/C][C]0.41067[/C][/ROW]
[ROW][C]30[/C][C]-0.035932[/C][C]-0.4573[/C][C]0.324021[/C][/ROW]
[ROW][C]31[/C][C]0.082486[/C][C]1.0499[/C][C]0.147668[/C][/ROW]
[ROW][C]32[/C][C]-0.07648[/C][C]-0.9734[/C][C]0.165895[/C][/ROW]
[ROW][C]33[/C][C]-0.092399[/C][C]-1.176[/C][C]0.120651[/C][/ROW]
[ROW][C]34[/C][C]-0.032572[/C][C]-0.4146[/C][C]0.339499[/C][/ROW]
[ROW][C]35[/C][C]-0.034851[/C][C]-0.4436[/C][C]0.328969[/C][/ROW]
[ROW][C]36[/C][C]-0.105815[/C][C]-1.3468[/C][C]0.089962[/C][/ROW]
[ROW][C]37[/C][C]0.03363[/C][C]0.428[/C][C]0.334595[/C][/ROW]
[ROW][C]38[/C][C]0.069975[/C][C]0.8906[/C][C]0.187222[/C][/ROW]
[ROW][C]39[/C][C]0.062625[/C][C]0.7971[/C][C]0.213284[/C][/ROW]
[ROW][C]40[/C][C]0.03839[/C][C]0.4886[/C][C]0.312882[/C][/ROW]
[ROW][C]41[/C][C]-0.061624[/C][C]-0.7843[/C][C]0.216991[/C][/ROW]
[ROW][C]42[/C][C]-0.055739[/C][C]-0.7094[/C][C]0.239536[/C][/ROW]
[ROW][C]43[/C][C]0.067585[/C][C]0.8602[/C][C]0.19547[/C][/ROW]
[ROW][C]44[/C][C]-0.011087[/C][C]-0.1411[/C][C]0.443978[/C][/ROW]
[ROW][C]45[/C][C]-0.050661[/C][C]-0.6448[/C][C]0.25998[/C][/ROW]
[ROW][C]46[/C][C]-0.03006[/C][C]-0.3826[/C][C]0.35126[/C][/ROW]
[ROW][C]47[/C][C]-0.000513[/C][C]-0.0065[/C][C]0.497401[/C][/ROW]
[ROW][C]48[/C][C]-0.12765[/C][C]-1.6247[/C][C]0.053084[/C][/ROW]
[ROW][C]49[/C][C]0.025313[/C][C]0.3222[/C][C]0.373866[/C][/ROW]
[ROW][C]50[/C][C]0.022245[/C][C]0.2831[/C][C]0.388719[/C][/ROW]
[ROW][C]51[/C][C]0.006712[/C][C]0.0854[/C][C]0.466013[/C][/ROW]
[ROW][C]52[/C][C]0.052832[/C][C]0.6724[/C][C]0.251131[/C][/ROW]
[ROW][C]53[/C][C]0.031742[/C][C]0.404[/C][C]0.343368[/C][/ROW]
[ROW][C]54[/C][C]-0.146532[/C][C]-1.865[/C][C]0.031992[/C][/ROW]
[ROW][C]55[/C][C]0.133045[/C][C]1.6934[/C][C]0.046152[/C][/ROW]
[ROW][C]56[/C][C]-0.002661[/C][C]-0.0339[/C][C]0.486514[/C][/ROW]
[ROW][C]57[/C][C]-0.138739[/C][C]-1.7659[/C][C]0.039652[/C][/ROW]
[ROW][C]58[/C][C]-0.061301[/C][C]-0.7802[/C][C]0.218197[/C][/ROW]
[ROW][C]59[/C][C]-0.032455[/C][C]-0.4131[/C][C]0.340046[/C][/ROW]
[ROW][C]60[/C][C]-0.139647[/C][C]-1.7774[/C][C]0.038688[/C][/ROW]
[/TABLE]
Source: https://freestatistics.org/blog/index.php?pk=72038&T=2

Globally Unique Identifier (entire table): ba.freestatistics.org/blog/index.php?pk=72038&T=2

As an alternative you can also use a QR Code:  

The GUIDs for individual cells are displayed in the table below:

Partial Autocorrelation Function
Time lag kPACF(k)T-STATP-value
10.4696865.97810
20.2912193.70660.000144
3-0.136135-1.73270.042525
4-0.003324-0.04230.483154
50.0145950.18580.426432
60.0287770.36630.35732
70.0584690.74420.22892
8-0.089199-1.13530.128959
9-0.155735-1.98220.024575
10-0.254355-3.23740.000732
11-0.053987-0.68710.246489
12-0.482373-6.13960
130.3636354.62834e-06
140.1910782.4320.008052
150.1447741.84270.033602
16-0.061075-0.77740.219041
17-0.172247-2.19230.014891
180.0701080.89230.186771
190.0212260.27020.393688
20-0.151943-1.93390.027433
21-0.075517-0.96120.168948
22-0.096559-1.2290.110428
23-0.036915-0.46990.319545
24-0.187156-2.38210.009187
250.1521591.93670.027263
260.1552051.97540.024958
270.0716230.91160.181662
28-0.150184-1.91150.028851
290.0177710.22620.41067
30-0.035932-0.45730.324021
310.0824861.04990.147668
32-0.07648-0.97340.165895
33-0.092399-1.1760.120651
34-0.032572-0.41460.339499
35-0.034851-0.44360.328969
36-0.105815-1.34680.089962
370.033630.4280.334595
380.0699750.89060.187222
390.0626250.79710.213284
400.038390.48860.312882
41-0.061624-0.78430.216991
42-0.055739-0.70940.239536
430.0675850.86020.19547
44-0.011087-0.14110.443978
45-0.050661-0.64480.25998
46-0.03006-0.38260.35126
47-0.000513-0.00650.497401
48-0.12765-1.62470.053084
490.0253130.32220.373866
500.0222450.28310.388719
510.0067120.08540.466013
520.0528320.67240.251131
530.0317420.4040.343368
54-0.146532-1.8650.031992
550.1330451.69340.046152
56-0.002661-0.03390.486514
57-0.138739-1.76590.039652
58-0.061301-0.78020.218197
59-0.032455-0.41310.340046
60-0.139647-1.77740.038688


Parameters (Session):
par1 = 60 ; par2 = 0.6 ; par3 = 0 ; par4 = 2 ; par5 = 12 ; par6 = MA ; par7 = 0.95 ;
Parameters (R input):
par1 = 60 ; par2 = 0.6 ; par3 = 0 ; par4 = 2 ; par5 = 12 ; par6 = MA ; par7 = 0.95 ;
R code (references can be found in the software module):
if (par1 == 'Default') {
par1 = 10*log10(length(x))
} else {
par1 <- as.numeric(par1)
}
par2 <- as.numeric(par2)
par3 <- as.numeric(par3)
par4 <- as.numeric(par4)
par5 <- as.numeric(par5)
if (par6 == 'White Noise') par6 <- 'white' else par6 <- 'ma'
par7 <- as.numeric(par7)
if (par2 == 0) {
x <- log(x)
} else {
x <- (x ^ par2 - 1) / par2
}
if (par3 > 0) x <- diff(x,lag=1,difference=par3)
if (par4 > 0) x <- diff(x,lag=par5,difference=par4)
bitmap(file='pic1.png')
racf <- acf(x, par1, main='Autocorrelation', xlab='time lag', ylab='ACF', ci.type=par6, ci=par7, sub=paste('(lambda=',par2,', d=',par3,', D=',par4,', CI=', par7, ', CI type=',par6,')',sep=''))
dev.off()
bitmap(file='pic2.png')
rpacf <- pacf(x,par1,main='Partial Autocorrelation',xlab='lags',ylab='PACF')
dev.off()
(myacf <- c(racf$acf))
(mypacf <- c(rpacf$acf))
lengthx <- length(x)
sqrtn <- sqrt(lengthx)
load(file='createtable')
a<-table.start()
a<-table.row.start(a)
a<-table.element(a,'Autocorrelation Function',4,TRUE)
a<-table.row.end(a)
a<-table.row.start(a)
a<-table.element(a,'Time lag k',header=TRUE)
a<-table.element(a,hyperlink('basics.htm','ACF(k)','click here for more information about the Autocorrelation Function'),header=TRUE)
a<-table.element(a,'T-STAT',header=TRUE)
a<-table.element(a,'P-value',header=TRUE)
a<-table.row.end(a)
for (i in 2:(par1+1)) {
a<-table.row.start(a)
a<-table.element(a,i-1,header=TRUE)
a<-table.element(a,round(myacf[i],6))
mytstat <- myacf[i]*sqrtn
a<-table.element(a,round(mytstat,4))
a<-table.element(a,round(1-pt(abs(mytstat),lengthx),6))
a<-table.row.end(a)
}
a<-table.end(a)
table.save(a,file='mytable.tab')
a<-table.start()
a<-table.row.start(a)
a<-table.element(a,'Partial Autocorrelation Function',4,TRUE)
a<-table.row.end(a)
a<-table.row.start(a)
a<-table.element(a,'Time lag k',header=TRUE)
a<-table.element(a,hyperlink('basics.htm','PACF(k)','click here for more information about the Partial Autocorrelation Function'),header=TRUE)
a<-table.element(a,'T-STAT',header=TRUE)
a<-table.element(a,'P-value',header=TRUE)
a<-table.row.end(a)
for (i in 1:par1) {
a<-table.row.start(a)
a<-table.element(a,i,header=TRUE)
a<-table.element(a,round(mypacf[i],6))
mytstat <- mypacf[i]*sqrtn
a<-table.element(a,round(mytstat,4))
a<-table.element(a,round(1-pt(abs(mytstat),lengthx),6))
a<-table.row.end(a)
}
a<-table.end(a)
table.save(a,file='mytable1.tab')