Free Statistics

of Irreproducible Research!

Author's title

Author*Unverified author*
R Software Modulerwasp_autocorrelation.wasp
Title produced by software(Partial) Autocorrelation Function
Date of computationSun, 10 Jan 2010 09:37:08 -0700
Cite this page as followsStatistical Computations at FreeStatistics.org, Office for Research Development and Education, URL https://freestatistics.org/blog/index.php?v=date/2010/Jan/10/t1263141521j3bjahm93754qmj.htm/, Retrieved Sun, 05 May 2024 05:22:49 +0000
Statistical Computations at FreeStatistics.org, Office for Research Development and Education, URL https://freestatistics.org/blog/index.php?pk=71822, Retrieved Sun, 05 May 2024 05:22:49 +0000
QR Codes:

Original text written by user:
IsPrivate?No (this computation is public)
User-defined keywordsKDGP2W22
Estimated Impact143
Family? (F = Feedback message, R = changed R code, M = changed R Module, P = changed Parameters, D = changed Data)
-       [(Partial) Autocorrelation Function] [Autocorrelatie To...] [2010-01-10 16:37:08] [d41d8cd98f00b204e9800998ecf8427e] [Current]
Feedback Forum

Post a new message
Dataseries X:
2766
3851
3289
3848
3348
3682
4058
3655
3811
3341
3032
3475
3353
3186
3902
4164
3499
4145
3796
3711
3949
3740
3243
4407
4814
3908
5250
3937
4004
5560
3922
3759
4138
4634
3996
4308
4143
4429
5219
4929
5761
5592
4163
4962
5208
4755
4491
5732
5731
5040
6102
4904
5369
5578
4619
4731
5011
5299
4146
4625
4736
4219
5116
4205
4121
5103
4300
4578
3809
5526
4248
3830
4430
4837
4408
4569
4104
4807
3944
3794
4390
4041
4104
4823


Summary of computational transaction
Raw Inputview raw input (R code)
Raw Outputview raw output of R engine
Computing time1 seconds
R Server'Gwilym Jenkins' @ 72.249.127.135

\begin{tabular}{lllllllll}
\hline
Summary of computational transaction \tabularnewline
Raw Input & view raw input (R code)  \tabularnewline
Raw Output & view raw output of R engine  \tabularnewline
Computing time & 1 seconds \tabularnewline
R Server & 'Gwilym Jenkins' @ 72.249.127.135 \tabularnewline
\hline
\end{tabular}
%Source: https://freestatistics.org/blog/index.php?pk=71822&T=0

[TABLE]
[ROW][C]Summary of computational transaction[/C][/ROW]
[ROW][C]Raw Input[/C][C]view raw input (R code) [/C][/ROW]
[ROW][C]Raw Output[/C][C]view raw output of R engine [/C][/ROW]
[ROW][C]Computing time[/C][C]1 seconds[/C][/ROW]
[ROW][C]R Server[/C][C]'Gwilym Jenkins' @ 72.249.127.135[/C][/ROW]
[/TABLE]
Source: https://freestatistics.org/blog/index.php?pk=71822&T=0

Globally Unique Identifier (entire table): ba.freestatistics.org/blog/index.php?pk=71822&T=0

As an alternative you can also use a QR Code:  

The GUIDs for individual cells are displayed in the table below:

Summary of computational transaction
Raw Inputview raw input (R code)
Raw Outputview raw output of R engine
Computing time1 seconds
R Server'Gwilym Jenkins' @ 72.249.127.135


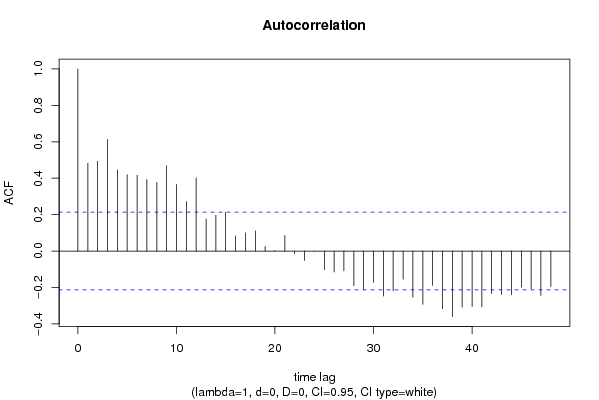
Autocorrelation Function
Time lag kACF(k)T-STATP-value
10.4814924.41291.5e-05
20.4924714.51361e-05
30.6127615.61610
40.4455014.08315e-05
50.4196843.84650.000116
60.4168753.82070.000127
70.3934043.60560.000264
80.3769023.45440.000433
90.4683454.29242.4e-05
100.3656713.35140.000603
110.2718842.49190.007337
120.4015883.68060.000205
130.175591.60930.05565
140.1966741.80250.037523
150.2134461.95630.026879
160.0822340.75370.226573
170.09970.91380.181728
180.1102361.01030.15762
190.0253110.2320.408561
200.0019150.01750.49302
210.0851440.78040.218687
22-0.015047-0.13790.445323
23-0.051699-0.47380.318426
24-0.000209-0.00190.499238
25-0.102382-0.93830.175378
26-0.11454-1.04980.148416
27-0.1086-0.99530.161215
28-0.19034-1.74450.042365
29-0.210955-1.93340.028275
30-0.172156-1.57780.059181
31-0.247463-2.2680.012947
32-0.218213-20.024368
33-0.154872-1.41940.079738
34-0.253056-2.31930.011404
35-0.292471-2.68050.004423
36-0.189101-1.73310.04337
37-0.316174-2.89780.002396
38-0.360241-3.30170.000706
39-0.308261-2.82530.00295
40-0.304037-2.78650.003292
41-0.307089-2.81450.003042
42-0.233575-2.14080.017596
43-0.239252-2.19280.015544
44-0.239468-2.19480.01547
45-0.198282-1.81730.03637
46-0.206695-1.89440.030807
47-0.243781-2.23430.01406
48-0.194819-1.78550.038891

\begin{tabular}{lllllllll}
\hline
Autocorrelation Function \tabularnewline
Time lag k & ACF(k) & T-STAT & P-value \tabularnewline
1 & 0.481492 & 4.4129 & 1.5e-05 \tabularnewline
2 & 0.492471 & 4.5136 & 1e-05 \tabularnewline
3 & 0.612761 & 5.6161 & 0 \tabularnewline
4 & 0.445501 & 4.0831 & 5e-05 \tabularnewline
5 & 0.419684 & 3.8465 & 0.000116 \tabularnewline
6 & 0.416875 & 3.8207 & 0.000127 \tabularnewline
7 & 0.393404 & 3.6056 & 0.000264 \tabularnewline
8 & 0.376902 & 3.4544 & 0.000433 \tabularnewline
9 & 0.468345 & 4.2924 & 2.4e-05 \tabularnewline
10 & 0.365671 & 3.3514 & 0.000603 \tabularnewline
11 & 0.271884 & 2.4919 & 0.007337 \tabularnewline
12 & 0.401588 & 3.6806 & 0.000205 \tabularnewline
13 & 0.17559 & 1.6093 & 0.05565 \tabularnewline
14 & 0.196674 & 1.8025 & 0.037523 \tabularnewline
15 & 0.213446 & 1.9563 & 0.026879 \tabularnewline
16 & 0.082234 & 0.7537 & 0.226573 \tabularnewline
17 & 0.0997 & 0.9138 & 0.181728 \tabularnewline
18 & 0.110236 & 1.0103 & 0.15762 \tabularnewline
19 & 0.025311 & 0.232 & 0.408561 \tabularnewline
20 & 0.001915 & 0.0175 & 0.49302 \tabularnewline
21 & 0.085144 & 0.7804 & 0.218687 \tabularnewline
22 & -0.015047 & -0.1379 & 0.445323 \tabularnewline
23 & -0.051699 & -0.4738 & 0.318426 \tabularnewline
24 & -0.000209 & -0.0019 & 0.499238 \tabularnewline
25 & -0.102382 & -0.9383 & 0.175378 \tabularnewline
26 & -0.11454 & -1.0498 & 0.148416 \tabularnewline
27 & -0.1086 & -0.9953 & 0.161215 \tabularnewline
28 & -0.19034 & -1.7445 & 0.042365 \tabularnewline
29 & -0.210955 & -1.9334 & 0.028275 \tabularnewline
30 & -0.172156 & -1.5778 & 0.059181 \tabularnewline
31 & -0.247463 & -2.268 & 0.012947 \tabularnewline
32 & -0.218213 & -2 & 0.024368 \tabularnewline
33 & -0.154872 & -1.4194 & 0.079738 \tabularnewline
34 & -0.253056 & -2.3193 & 0.011404 \tabularnewline
35 & -0.292471 & -2.6805 & 0.004423 \tabularnewline
36 & -0.189101 & -1.7331 & 0.04337 \tabularnewline
37 & -0.316174 & -2.8978 & 0.002396 \tabularnewline
38 & -0.360241 & -3.3017 & 0.000706 \tabularnewline
39 & -0.308261 & -2.8253 & 0.00295 \tabularnewline
40 & -0.304037 & -2.7865 & 0.003292 \tabularnewline
41 & -0.307089 & -2.8145 & 0.003042 \tabularnewline
42 & -0.233575 & -2.1408 & 0.017596 \tabularnewline
43 & -0.239252 & -2.1928 & 0.015544 \tabularnewline
44 & -0.239468 & -2.1948 & 0.01547 \tabularnewline
45 & -0.198282 & -1.8173 & 0.03637 \tabularnewline
46 & -0.206695 & -1.8944 & 0.030807 \tabularnewline
47 & -0.243781 & -2.2343 & 0.01406 \tabularnewline
48 & -0.194819 & -1.7855 & 0.038891 \tabularnewline
\hline
\end{tabular}
%Source: https://freestatistics.org/blog/index.php?pk=71822&T=1

[TABLE]
[ROW][C]Autocorrelation Function[/C][/ROW]
[ROW][C]Time lag k[/C][C]ACF(k)[/C][C]T-STAT[/C][C]P-value[/C][/ROW]
[ROW][C]1[/C][C]0.481492[/C][C]4.4129[/C][C]1.5e-05[/C][/ROW]
[ROW][C]2[/C][C]0.492471[/C][C]4.5136[/C][C]1e-05[/C][/ROW]
[ROW][C]3[/C][C]0.612761[/C][C]5.6161[/C][C]0[/C][/ROW]
[ROW][C]4[/C][C]0.445501[/C][C]4.0831[/C][C]5e-05[/C][/ROW]
[ROW][C]5[/C][C]0.419684[/C][C]3.8465[/C][C]0.000116[/C][/ROW]
[ROW][C]6[/C][C]0.416875[/C][C]3.8207[/C][C]0.000127[/C][/ROW]
[ROW][C]7[/C][C]0.393404[/C][C]3.6056[/C][C]0.000264[/C][/ROW]
[ROW][C]8[/C][C]0.376902[/C][C]3.4544[/C][C]0.000433[/C][/ROW]
[ROW][C]9[/C][C]0.468345[/C][C]4.2924[/C][C]2.4e-05[/C][/ROW]
[ROW][C]10[/C][C]0.365671[/C][C]3.3514[/C][C]0.000603[/C][/ROW]
[ROW][C]11[/C][C]0.271884[/C][C]2.4919[/C][C]0.007337[/C][/ROW]
[ROW][C]12[/C][C]0.401588[/C][C]3.6806[/C][C]0.000205[/C][/ROW]
[ROW][C]13[/C][C]0.17559[/C][C]1.6093[/C][C]0.05565[/C][/ROW]
[ROW][C]14[/C][C]0.196674[/C][C]1.8025[/C][C]0.037523[/C][/ROW]
[ROW][C]15[/C][C]0.213446[/C][C]1.9563[/C][C]0.026879[/C][/ROW]
[ROW][C]16[/C][C]0.082234[/C][C]0.7537[/C][C]0.226573[/C][/ROW]
[ROW][C]17[/C][C]0.0997[/C][C]0.9138[/C][C]0.181728[/C][/ROW]
[ROW][C]18[/C][C]0.110236[/C][C]1.0103[/C][C]0.15762[/C][/ROW]
[ROW][C]19[/C][C]0.025311[/C][C]0.232[/C][C]0.408561[/C][/ROW]
[ROW][C]20[/C][C]0.001915[/C][C]0.0175[/C][C]0.49302[/C][/ROW]
[ROW][C]21[/C][C]0.085144[/C][C]0.7804[/C][C]0.218687[/C][/ROW]
[ROW][C]22[/C][C]-0.015047[/C][C]-0.1379[/C][C]0.445323[/C][/ROW]
[ROW][C]23[/C][C]-0.051699[/C][C]-0.4738[/C][C]0.318426[/C][/ROW]
[ROW][C]24[/C][C]-0.000209[/C][C]-0.0019[/C][C]0.499238[/C][/ROW]
[ROW][C]25[/C][C]-0.102382[/C][C]-0.9383[/C][C]0.175378[/C][/ROW]
[ROW][C]26[/C][C]-0.11454[/C][C]-1.0498[/C][C]0.148416[/C][/ROW]
[ROW][C]27[/C][C]-0.1086[/C][C]-0.9953[/C][C]0.161215[/C][/ROW]
[ROW][C]28[/C][C]-0.19034[/C][C]-1.7445[/C][C]0.042365[/C][/ROW]
[ROW][C]29[/C][C]-0.210955[/C][C]-1.9334[/C][C]0.028275[/C][/ROW]
[ROW][C]30[/C][C]-0.172156[/C][C]-1.5778[/C][C]0.059181[/C][/ROW]
[ROW][C]31[/C][C]-0.247463[/C][C]-2.268[/C][C]0.012947[/C][/ROW]
[ROW][C]32[/C][C]-0.218213[/C][C]-2[/C][C]0.024368[/C][/ROW]
[ROW][C]33[/C][C]-0.154872[/C][C]-1.4194[/C][C]0.079738[/C][/ROW]
[ROW][C]34[/C][C]-0.253056[/C][C]-2.3193[/C][C]0.011404[/C][/ROW]
[ROW][C]35[/C][C]-0.292471[/C][C]-2.6805[/C][C]0.004423[/C][/ROW]
[ROW][C]36[/C][C]-0.189101[/C][C]-1.7331[/C][C]0.04337[/C][/ROW]
[ROW][C]37[/C][C]-0.316174[/C][C]-2.8978[/C][C]0.002396[/C][/ROW]
[ROW][C]38[/C][C]-0.360241[/C][C]-3.3017[/C][C]0.000706[/C][/ROW]
[ROW][C]39[/C][C]-0.308261[/C][C]-2.8253[/C][C]0.00295[/C][/ROW]
[ROW][C]40[/C][C]-0.304037[/C][C]-2.7865[/C][C]0.003292[/C][/ROW]
[ROW][C]41[/C][C]-0.307089[/C][C]-2.8145[/C][C]0.003042[/C][/ROW]
[ROW][C]42[/C][C]-0.233575[/C][C]-2.1408[/C][C]0.017596[/C][/ROW]
[ROW][C]43[/C][C]-0.239252[/C][C]-2.1928[/C][C]0.015544[/C][/ROW]
[ROW][C]44[/C][C]-0.239468[/C][C]-2.1948[/C][C]0.01547[/C][/ROW]
[ROW][C]45[/C][C]-0.198282[/C][C]-1.8173[/C][C]0.03637[/C][/ROW]
[ROW][C]46[/C][C]-0.206695[/C][C]-1.8944[/C][C]0.030807[/C][/ROW]
[ROW][C]47[/C][C]-0.243781[/C][C]-2.2343[/C][C]0.01406[/C][/ROW]
[ROW][C]48[/C][C]-0.194819[/C][C]-1.7855[/C][C]0.038891[/C][/ROW]
[/TABLE]
Source: https://freestatistics.org/blog/index.php?pk=71822&T=1

Globally Unique Identifier (entire table): ba.freestatistics.org/blog/index.php?pk=71822&T=1

As an alternative you can also use a QR Code:  

The GUIDs for individual cells are displayed in the table below:

Autocorrelation Function
Time lag kACF(k)T-STATP-value
10.4814924.41291.5e-05
20.4924714.51361e-05
30.6127615.61610
40.4455014.08315e-05
50.4196843.84650.000116
60.4168753.82070.000127
70.3934043.60560.000264
80.3769023.45440.000433
90.4683454.29242.4e-05
100.3656713.35140.000603
110.2718842.49190.007337
120.4015883.68060.000205
130.175591.60930.05565
140.1966741.80250.037523
150.2134461.95630.026879
160.0822340.75370.226573
170.09970.91380.181728
180.1102361.01030.15762
190.0253110.2320.408561
200.0019150.01750.49302
210.0851440.78040.218687
22-0.015047-0.13790.445323
23-0.051699-0.47380.318426
24-0.000209-0.00190.499238
25-0.102382-0.93830.175378
26-0.11454-1.04980.148416
27-0.1086-0.99530.161215
28-0.19034-1.74450.042365
29-0.210955-1.93340.028275
30-0.172156-1.57780.059181
31-0.247463-2.2680.012947
32-0.218213-20.024368
33-0.154872-1.41940.079738
34-0.253056-2.31930.011404
35-0.292471-2.68050.004423
36-0.189101-1.73310.04337
37-0.316174-2.89780.002396
38-0.360241-3.30170.000706
39-0.308261-2.82530.00295
40-0.304037-2.78650.003292
41-0.307089-2.81450.003042
42-0.233575-2.14080.017596
43-0.239252-2.19280.015544
44-0.239468-2.19480.01547
45-0.198282-1.81730.03637
46-0.206695-1.89440.030807
47-0.243781-2.23430.01406
48-0.194819-1.78550.038891


Partial Autocorrelation Function
Time lag kPACF(k)T-STATP-value
10.4814924.41291.5e-05
20.3392983.10970.001279
30.4306493.9478.2e-05
40.0598250.54830.292469
50.0039310.0360.485671
6-0.030073-0.27560.391758
70.0556160.50970.30579
80.0635740.58270.28084
90.2450342.24580.013672
10-0.002156-0.01980.492142
11-0.194589-1.78340.039063
120.0152920.14020.444437
13-0.259982-2.38280.00972
14-0.012888-0.11810.453127
15-0.017717-0.16240.435698
16-0.065211-0.59770.275834
17-0.068758-0.63020.265145
18-0.04078-0.37380.354765
19-0.104038-0.95350.171531
20-0.031224-0.28620.387727
210.1171721.07390.142971
220.0559820.51310.304621
230.0255580.23420.407685
24-0.06548-0.60010.275017
25-0.046557-0.42670.335344
26-0.069057-0.63290.264252
27-0.008969-0.08220.46734
28-0.025552-0.23420.407704
29-0.086726-0.79490.214468
30-0.059419-0.54460.293741
31-0.111786-1.02450.154262
320.0379950.34820.364268
330.0974910.89350.187065
340.0246090.22550.411053
35-0.163342-1.49710.069064
360.0082210.07530.470058
37-0.100971-0.92540.1787
38-0.061143-0.56040.288355
39-0.023407-0.21450.415328
400.1346261.23390.110347
410.0899430.82430.20604
420.0626030.57380.283831
430.033730.30910.37899
44-0.028891-0.26480.395911
45-0.038387-0.35180.362925
460.0696110.6380.262608
470.0598840.54880.292284
48-0.027671-0.25360.40021

\begin{tabular}{lllllllll}
\hline
Partial Autocorrelation Function \tabularnewline
Time lag k & PACF(k) & T-STAT & P-value \tabularnewline
1 & 0.481492 & 4.4129 & 1.5e-05 \tabularnewline
2 & 0.339298 & 3.1097 & 0.001279 \tabularnewline
3 & 0.430649 & 3.947 & 8.2e-05 \tabularnewline
4 & 0.059825 & 0.5483 & 0.292469 \tabularnewline
5 & 0.003931 & 0.036 & 0.485671 \tabularnewline
6 & -0.030073 & -0.2756 & 0.391758 \tabularnewline
7 & 0.055616 & 0.5097 & 0.30579 \tabularnewline
8 & 0.063574 & 0.5827 & 0.28084 \tabularnewline
9 & 0.245034 & 2.2458 & 0.013672 \tabularnewline
10 & -0.002156 & -0.0198 & 0.492142 \tabularnewline
11 & -0.194589 & -1.7834 & 0.039063 \tabularnewline
12 & 0.015292 & 0.1402 & 0.444437 \tabularnewline
13 & -0.259982 & -2.3828 & 0.00972 \tabularnewline
14 & -0.012888 & -0.1181 & 0.453127 \tabularnewline
15 & -0.017717 & -0.1624 & 0.435698 \tabularnewline
16 & -0.065211 & -0.5977 & 0.275834 \tabularnewline
17 & -0.068758 & -0.6302 & 0.265145 \tabularnewline
18 & -0.04078 & -0.3738 & 0.354765 \tabularnewline
19 & -0.104038 & -0.9535 & 0.171531 \tabularnewline
20 & -0.031224 & -0.2862 & 0.387727 \tabularnewline
21 & 0.117172 & 1.0739 & 0.142971 \tabularnewline
22 & 0.055982 & 0.5131 & 0.304621 \tabularnewline
23 & 0.025558 & 0.2342 & 0.407685 \tabularnewline
24 & -0.06548 & -0.6001 & 0.275017 \tabularnewline
25 & -0.046557 & -0.4267 & 0.335344 \tabularnewline
26 & -0.069057 & -0.6329 & 0.264252 \tabularnewline
27 & -0.008969 & -0.0822 & 0.46734 \tabularnewline
28 & -0.025552 & -0.2342 & 0.407704 \tabularnewline
29 & -0.086726 & -0.7949 & 0.214468 \tabularnewline
30 & -0.059419 & -0.5446 & 0.293741 \tabularnewline
31 & -0.111786 & -1.0245 & 0.154262 \tabularnewline
32 & 0.037995 & 0.3482 & 0.364268 \tabularnewline
33 & 0.097491 & 0.8935 & 0.187065 \tabularnewline
34 & 0.024609 & 0.2255 & 0.411053 \tabularnewline
35 & -0.163342 & -1.4971 & 0.069064 \tabularnewline
36 & 0.008221 & 0.0753 & 0.470058 \tabularnewline
37 & -0.100971 & -0.9254 & 0.1787 \tabularnewline
38 & -0.061143 & -0.5604 & 0.288355 \tabularnewline
39 & -0.023407 & -0.2145 & 0.415328 \tabularnewline
40 & 0.134626 & 1.2339 & 0.110347 \tabularnewline
41 & 0.089943 & 0.8243 & 0.20604 \tabularnewline
42 & 0.062603 & 0.5738 & 0.283831 \tabularnewline
43 & 0.03373 & 0.3091 & 0.37899 \tabularnewline
44 & -0.028891 & -0.2648 & 0.395911 \tabularnewline
45 & -0.038387 & -0.3518 & 0.362925 \tabularnewline
46 & 0.069611 & 0.638 & 0.262608 \tabularnewline
47 & 0.059884 & 0.5488 & 0.292284 \tabularnewline
48 & -0.027671 & -0.2536 & 0.40021 \tabularnewline
\hline
\end{tabular}
%Source: https://freestatistics.org/blog/index.php?pk=71822&T=2

[TABLE]
[ROW][C]Partial Autocorrelation Function[/C][/ROW]
[ROW][C]Time lag k[/C][C]PACF(k)[/C][C]T-STAT[/C][C]P-value[/C][/ROW]
[ROW][C]1[/C][C]0.481492[/C][C]4.4129[/C][C]1.5e-05[/C][/ROW]
[ROW][C]2[/C][C]0.339298[/C][C]3.1097[/C][C]0.001279[/C][/ROW]
[ROW][C]3[/C][C]0.430649[/C][C]3.947[/C][C]8.2e-05[/C][/ROW]
[ROW][C]4[/C][C]0.059825[/C][C]0.5483[/C][C]0.292469[/C][/ROW]
[ROW][C]5[/C][C]0.003931[/C][C]0.036[/C][C]0.485671[/C][/ROW]
[ROW][C]6[/C][C]-0.030073[/C][C]-0.2756[/C][C]0.391758[/C][/ROW]
[ROW][C]7[/C][C]0.055616[/C][C]0.5097[/C][C]0.30579[/C][/ROW]
[ROW][C]8[/C][C]0.063574[/C][C]0.5827[/C][C]0.28084[/C][/ROW]
[ROW][C]9[/C][C]0.245034[/C][C]2.2458[/C][C]0.013672[/C][/ROW]
[ROW][C]10[/C][C]-0.002156[/C][C]-0.0198[/C][C]0.492142[/C][/ROW]
[ROW][C]11[/C][C]-0.194589[/C][C]-1.7834[/C][C]0.039063[/C][/ROW]
[ROW][C]12[/C][C]0.015292[/C][C]0.1402[/C][C]0.444437[/C][/ROW]
[ROW][C]13[/C][C]-0.259982[/C][C]-2.3828[/C][C]0.00972[/C][/ROW]
[ROW][C]14[/C][C]-0.012888[/C][C]-0.1181[/C][C]0.453127[/C][/ROW]
[ROW][C]15[/C][C]-0.017717[/C][C]-0.1624[/C][C]0.435698[/C][/ROW]
[ROW][C]16[/C][C]-0.065211[/C][C]-0.5977[/C][C]0.275834[/C][/ROW]
[ROW][C]17[/C][C]-0.068758[/C][C]-0.6302[/C][C]0.265145[/C][/ROW]
[ROW][C]18[/C][C]-0.04078[/C][C]-0.3738[/C][C]0.354765[/C][/ROW]
[ROW][C]19[/C][C]-0.104038[/C][C]-0.9535[/C][C]0.171531[/C][/ROW]
[ROW][C]20[/C][C]-0.031224[/C][C]-0.2862[/C][C]0.387727[/C][/ROW]
[ROW][C]21[/C][C]0.117172[/C][C]1.0739[/C][C]0.142971[/C][/ROW]
[ROW][C]22[/C][C]0.055982[/C][C]0.5131[/C][C]0.304621[/C][/ROW]
[ROW][C]23[/C][C]0.025558[/C][C]0.2342[/C][C]0.407685[/C][/ROW]
[ROW][C]24[/C][C]-0.06548[/C][C]-0.6001[/C][C]0.275017[/C][/ROW]
[ROW][C]25[/C][C]-0.046557[/C][C]-0.4267[/C][C]0.335344[/C][/ROW]
[ROW][C]26[/C][C]-0.069057[/C][C]-0.6329[/C][C]0.264252[/C][/ROW]
[ROW][C]27[/C][C]-0.008969[/C][C]-0.0822[/C][C]0.46734[/C][/ROW]
[ROW][C]28[/C][C]-0.025552[/C][C]-0.2342[/C][C]0.407704[/C][/ROW]
[ROW][C]29[/C][C]-0.086726[/C][C]-0.7949[/C][C]0.214468[/C][/ROW]
[ROW][C]30[/C][C]-0.059419[/C][C]-0.5446[/C][C]0.293741[/C][/ROW]
[ROW][C]31[/C][C]-0.111786[/C][C]-1.0245[/C][C]0.154262[/C][/ROW]
[ROW][C]32[/C][C]0.037995[/C][C]0.3482[/C][C]0.364268[/C][/ROW]
[ROW][C]33[/C][C]0.097491[/C][C]0.8935[/C][C]0.187065[/C][/ROW]
[ROW][C]34[/C][C]0.024609[/C][C]0.2255[/C][C]0.411053[/C][/ROW]
[ROW][C]35[/C][C]-0.163342[/C][C]-1.4971[/C][C]0.069064[/C][/ROW]
[ROW][C]36[/C][C]0.008221[/C][C]0.0753[/C][C]0.470058[/C][/ROW]
[ROW][C]37[/C][C]-0.100971[/C][C]-0.9254[/C][C]0.1787[/C][/ROW]
[ROW][C]38[/C][C]-0.061143[/C][C]-0.5604[/C][C]0.288355[/C][/ROW]
[ROW][C]39[/C][C]-0.023407[/C][C]-0.2145[/C][C]0.415328[/C][/ROW]
[ROW][C]40[/C][C]0.134626[/C][C]1.2339[/C][C]0.110347[/C][/ROW]
[ROW][C]41[/C][C]0.089943[/C][C]0.8243[/C][C]0.20604[/C][/ROW]
[ROW][C]42[/C][C]0.062603[/C][C]0.5738[/C][C]0.283831[/C][/ROW]
[ROW][C]43[/C][C]0.03373[/C][C]0.3091[/C][C]0.37899[/C][/ROW]
[ROW][C]44[/C][C]-0.028891[/C][C]-0.2648[/C][C]0.395911[/C][/ROW]
[ROW][C]45[/C][C]-0.038387[/C][C]-0.3518[/C][C]0.362925[/C][/ROW]
[ROW][C]46[/C][C]0.069611[/C][C]0.638[/C][C]0.262608[/C][/ROW]
[ROW][C]47[/C][C]0.059884[/C][C]0.5488[/C][C]0.292284[/C][/ROW]
[ROW][C]48[/C][C]-0.027671[/C][C]-0.2536[/C][C]0.40021[/C][/ROW]
[/TABLE]
Source: https://freestatistics.org/blog/index.php?pk=71822&T=2

Globally Unique Identifier (entire table): ba.freestatistics.org/blog/index.php?pk=71822&T=2

As an alternative you can also use a QR Code:  

The GUIDs for individual cells are displayed in the table below:

Partial Autocorrelation Function
Time lag kPACF(k)T-STATP-value
10.4814924.41291.5e-05
20.3392983.10970.001279
30.4306493.9478.2e-05
40.0598250.54830.292469
50.0039310.0360.485671
6-0.030073-0.27560.391758
70.0556160.50970.30579
80.0635740.58270.28084
90.2450342.24580.013672
10-0.002156-0.01980.492142
11-0.194589-1.78340.039063
120.0152920.14020.444437
13-0.259982-2.38280.00972
14-0.012888-0.11810.453127
15-0.017717-0.16240.435698
16-0.065211-0.59770.275834
17-0.068758-0.63020.265145
18-0.04078-0.37380.354765
19-0.104038-0.95350.171531
20-0.031224-0.28620.387727
210.1171721.07390.142971
220.0559820.51310.304621
230.0255580.23420.407685
24-0.06548-0.60010.275017
25-0.046557-0.42670.335344
26-0.069057-0.63290.264252
27-0.008969-0.08220.46734
28-0.025552-0.23420.407704
29-0.086726-0.79490.214468
30-0.059419-0.54460.293741
31-0.111786-1.02450.154262
320.0379950.34820.364268
330.0974910.89350.187065
340.0246090.22550.411053
35-0.163342-1.49710.069064
360.0082210.07530.470058
37-0.100971-0.92540.1787
38-0.061143-0.56040.288355
39-0.023407-0.21450.415328
400.1346261.23390.110347
410.0899430.82430.20604
420.0626030.57380.283831
430.033730.30910.37899
44-0.028891-0.26480.395911
45-0.038387-0.35180.362925
460.0696110.6380.262608
470.0598840.54880.292284
48-0.027671-0.25360.40021


Parameters (Session):
par1 = 48 ; par2 = 1 ; par3 = 0 ; par4 = 0 ; par5 = 12 ; par6 = White Noise ; par7 = 0.95 ;
Parameters (R input):
par1 = 48 ; par2 = 1 ; par3 = 0 ; par4 = 0 ; par5 = 12 ; par6 = White Noise ; par7 = 0.95 ;
R code (references can be found in the software module):
if (par1 == 'Default') {
par1 = 10*log10(length(x))
} else {
par1 <- as.numeric(par1)
}
par2 <- as.numeric(par2)
par3 <- as.numeric(par3)
par4 <- as.numeric(par4)
par5 <- as.numeric(par5)
if (par6 == 'White Noise') par6 <- 'white' else par6 <- 'ma'
par7 <- as.numeric(par7)
if (par2 == 0) {
x <- log(x)
} else {
x <- (x ^ par2 - 1) / par2
}
if (par3 > 0) x <- diff(x,lag=1,difference=par3)
if (par4 > 0) x <- diff(x,lag=par5,difference=par4)
bitmap(file='pic1.png')
racf <- acf(x, par1, main='Autocorrelation', xlab='time lag', ylab='ACF', ci.type=par6, ci=par7, sub=paste('(lambda=',par2,', d=',par3,', D=',par4,', CI=', par7, ', CI type=',par6,')',sep=''))
dev.off()
bitmap(file='pic2.png')
rpacf <- pacf(x,par1,main='Partial Autocorrelation',xlab='lags',ylab='PACF')
dev.off()
(myacf <- c(racf$acf))
(mypacf <- c(rpacf$acf))
lengthx <- length(x)
sqrtn <- sqrt(lengthx)
load(file='createtable')
a<-table.start()
a<-table.row.start(a)
a<-table.element(a,'Autocorrelation Function',4,TRUE)
a<-table.row.end(a)
a<-table.row.start(a)
a<-table.element(a,'Time lag k',header=TRUE)
a<-table.element(a,hyperlink('basics.htm','ACF(k)','click here for more information about the Autocorrelation Function'),header=TRUE)
a<-table.element(a,'T-STAT',header=TRUE)
a<-table.element(a,'P-value',header=TRUE)
a<-table.row.end(a)
for (i in 2:(par1+1)) {
a<-table.row.start(a)
a<-table.element(a,i-1,header=TRUE)
a<-table.element(a,round(myacf[i],6))
mytstat <- myacf[i]*sqrtn
a<-table.element(a,round(mytstat,4))
a<-table.element(a,round(1-pt(abs(mytstat),lengthx),6))
a<-table.row.end(a)
}
a<-table.end(a)
table.save(a,file='mytable.tab')
a<-table.start()
a<-table.row.start(a)
a<-table.element(a,'Partial Autocorrelation Function',4,TRUE)
a<-table.row.end(a)
a<-table.row.start(a)
a<-table.element(a,'Time lag k',header=TRUE)
a<-table.element(a,hyperlink('basics.htm','PACF(k)','click here for more information about the Partial Autocorrelation Function'),header=TRUE)
a<-table.element(a,'T-STAT',header=TRUE)
a<-table.element(a,'P-value',header=TRUE)
a<-table.row.end(a)
for (i in 1:par1) {
a<-table.row.start(a)
a<-table.element(a,i,header=TRUE)
a<-table.element(a,round(mypacf[i],6))
mytstat <- mypacf[i]*sqrtn
a<-table.element(a,round(mytstat,4))
a<-table.element(a,round(1-pt(abs(mytstat),lengthx),6))
a<-table.row.end(a)
}
a<-table.end(a)
table.save(a,file='mytable1.tab')