Free Statistics

of Irreproducible Research!

Author's title

Author*Unverified author*
R Software Modulerwasp_autocorrelation.wasp
Title produced by software(Partial) Autocorrelation Function
Date of computationSun, 10 Jan 2010 06:54:30 -0700
Cite this page as followsStatistical Computations at FreeStatistics.org, Office for Research Development and Education, URL https://freestatistics.org/blog/index.php?v=date/2010/Jan/10/t1263131717ry768ipet7d0gf1.htm/, Retrieved Sun, 05 May 2024 05:33:09 +0000
Statistical Computations at FreeStatistics.org, Office for Research Development and Education, URL https://freestatistics.org/blog/index.php?pk=71799, Retrieved Sun, 05 May 2024 05:33:09 +0000
QR Codes:

Original text written by user:
IsPrivate?No (this computation is public)
User-defined keywordsKDGP2W21
Estimated Impact170
Family? (F = Feedback message, R = changed R code, M = changed R Module, P = changed Parameters, D = changed Data)
-       [(Partial) Autocorrelation Function] [] [2010-01-10 13:54:30] [d7e29fbdd9c070952bc7bcf8a141229f] [Current]
Feedback Forum

Post a new message
Dataseries X:
104.28
104.33
104.46
104.46
104.5
104.61
104.66
104.66
105.03
105.32
105.52
105.67
105.71
105.81
106
106.02
106.19
106.22
106.34
106.42
106.84
107.23
107.42
107.63
107.69
107.81
107.92
108.06
108.21
108.44
108.55
108.66
109.23
109.7
109.94
110.13
110.39
110.46
110.67
110.89
110.98
111.12
111.33
111.43
111.87
112.22
112.47
112.64
112.84
113.03
113.09
113.27
113.44
113.51
113.66
113.62
114.01
114.55
114.77
114.87
115.11
115.09
115.24
115.27
115.41
115.59
115.6
115.68
116.2
116.55
116.73
117.04
117.12
117.28
117.48
117.66
117.92
118.12
118.17
118.39


Summary of computational transaction
Raw Inputview raw input (R code)
Raw Outputview raw output of R engine
Computing time3 seconds
R Server'Gwilym Jenkins' @ 72.249.127.135

\begin{tabular}{lllllllll}
\hline
Summary of computational transaction \tabularnewline
Raw Input & view raw input (R code)  \tabularnewline
Raw Output & view raw output of R engine  \tabularnewline
Computing time & 3 seconds \tabularnewline
R Server & 'Gwilym Jenkins' @ 72.249.127.135 \tabularnewline
\hline
\end{tabular}
%Source: https://freestatistics.org/blog/index.php?pk=71799&T=0

[TABLE]
[ROW][C]Summary of computational transaction[/C][/ROW]
[ROW][C]Raw Input[/C][C]view raw input (R code) [/C][/ROW]
[ROW][C]Raw Output[/C][C]view raw output of R engine [/C][/ROW]
[ROW][C]Computing time[/C][C]3 seconds[/C][/ROW]
[ROW][C]R Server[/C][C]'Gwilym Jenkins' @ 72.249.127.135[/C][/ROW]
[/TABLE]
Source: https://freestatistics.org/blog/index.php?pk=71799&T=0

Globally Unique Identifier (entire table): ba.freestatistics.org/blog/index.php?pk=71799&T=0

As an alternative you can also use a QR Code:  

The GUIDs for individual cells are displayed in the table below:

Summary of computational transaction
Raw Inputview raw input (R code)
Raw Outputview raw output of R engine
Computing time3 seconds
R Server'Gwilym Jenkins' @ 72.249.127.135


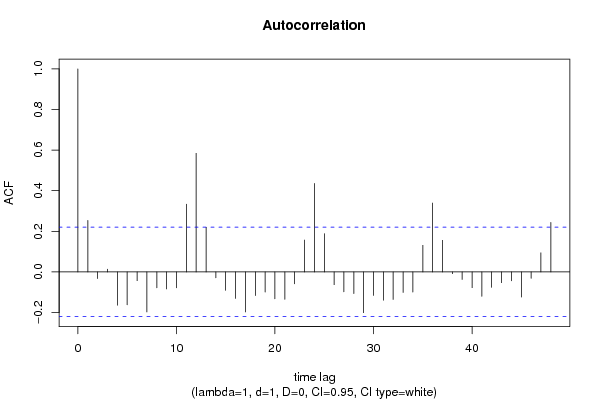
Autocorrelation Function
Time lag kACF(k)T-STATP-value
10.2532942.25130.013571
2-0.032979-0.29310.385099
30.0131080.11650.453774
4-0.163834-1.45620.074652
5-0.162128-1.4410.076765
6-0.043494-0.38660.350052
7-0.197032-1.75130.041891
8-0.078159-0.69470.244642
9-0.084279-0.74910.228013
10-0.078431-0.69710.24389
110.3337592.96650.001992
120.5844895.19511e-06
130.2199691.95510.027052
14-0.029096-0.25860.398303
15-0.090608-0.80530.21152
16-0.130461-1.15960.124859
17-0.19755-1.75590.041494
18-0.116759-1.03780.151269
19-0.09936-0.88310.189924
20-0.132367-1.17650.121463
21-0.134806-1.19820.117213
22-0.058917-0.52370.300989
230.1571381.39670.083212
240.4360713.87590.000109
250.1884671.67510.048931
26-0.062741-0.55770.289328
27-0.098181-0.87270.192748
28-0.106464-0.94630.173448
29-0.20126-1.78880.038737
30-0.116279-1.03350.152259
31-0.139477-1.23970.109379
32-0.13589-1.20780.115361
33-0.101405-0.90130.185083
34-0.099312-0.88270.190038
350.1311531.16570.123618
360.339163.01450.00173
370.155741.38420.08509
38-0.008768-0.07790.469041
39-0.037452-0.33290.370053
40-0.077691-0.69050.245942
41-0.120494-1.0710.143721
42-0.076195-0.67720.250116
43-0.05289-0.47010.319789
44-0.043881-0.390.348785
45-0.12395-1.10170.136971
46-0.031349-0.27860.390626
470.0937920.83360.203498
480.243842.16730.016612

\begin{tabular}{lllllllll}
\hline
Autocorrelation Function \tabularnewline
Time lag k & ACF(k) & T-STAT & P-value \tabularnewline
1 & 0.253294 & 2.2513 & 0.013571 \tabularnewline
2 & -0.032979 & -0.2931 & 0.385099 \tabularnewline
3 & 0.013108 & 0.1165 & 0.453774 \tabularnewline
4 & -0.163834 & -1.4562 & 0.074652 \tabularnewline
5 & -0.162128 & -1.441 & 0.076765 \tabularnewline
6 & -0.043494 & -0.3866 & 0.350052 \tabularnewline
7 & -0.197032 & -1.7513 & 0.041891 \tabularnewline
8 & -0.078159 & -0.6947 & 0.244642 \tabularnewline
9 & -0.084279 & -0.7491 & 0.228013 \tabularnewline
10 & -0.078431 & -0.6971 & 0.24389 \tabularnewline
11 & 0.333759 & 2.9665 & 0.001992 \tabularnewline
12 & 0.584489 & 5.1951 & 1e-06 \tabularnewline
13 & 0.219969 & 1.9551 & 0.027052 \tabularnewline
14 & -0.029096 & -0.2586 & 0.398303 \tabularnewline
15 & -0.090608 & -0.8053 & 0.21152 \tabularnewline
16 & -0.130461 & -1.1596 & 0.124859 \tabularnewline
17 & -0.19755 & -1.7559 & 0.041494 \tabularnewline
18 & -0.116759 & -1.0378 & 0.151269 \tabularnewline
19 & -0.09936 & -0.8831 & 0.189924 \tabularnewline
20 & -0.132367 & -1.1765 & 0.121463 \tabularnewline
21 & -0.134806 & -1.1982 & 0.117213 \tabularnewline
22 & -0.058917 & -0.5237 & 0.300989 \tabularnewline
23 & 0.157138 & 1.3967 & 0.083212 \tabularnewline
24 & 0.436071 & 3.8759 & 0.000109 \tabularnewline
25 & 0.188467 & 1.6751 & 0.048931 \tabularnewline
26 & -0.062741 & -0.5577 & 0.289328 \tabularnewline
27 & -0.098181 & -0.8727 & 0.192748 \tabularnewline
28 & -0.106464 & -0.9463 & 0.173448 \tabularnewline
29 & -0.20126 & -1.7888 & 0.038737 \tabularnewline
30 & -0.116279 & -1.0335 & 0.152259 \tabularnewline
31 & -0.139477 & -1.2397 & 0.109379 \tabularnewline
32 & -0.13589 & -1.2078 & 0.115361 \tabularnewline
33 & -0.101405 & -0.9013 & 0.185083 \tabularnewline
34 & -0.099312 & -0.8827 & 0.190038 \tabularnewline
35 & 0.131153 & 1.1657 & 0.123618 \tabularnewline
36 & 0.33916 & 3.0145 & 0.00173 \tabularnewline
37 & 0.15574 & 1.3842 & 0.08509 \tabularnewline
38 & -0.008768 & -0.0779 & 0.469041 \tabularnewline
39 & -0.037452 & -0.3329 & 0.370053 \tabularnewline
40 & -0.077691 & -0.6905 & 0.245942 \tabularnewline
41 & -0.120494 & -1.071 & 0.143721 \tabularnewline
42 & -0.076195 & -0.6772 & 0.250116 \tabularnewline
43 & -0.05289 & -0.4701 & 0.319789 \tabularnewline
44 & -0.043881 & -0.39 & 0.348785 \tabularnewline
45 & -0.12395 & -1.1017 & 0.136971 \tabularnewline
46 & -0.031349 & -0.2786 & 0.390626 \tabularnewline
47 & 0.093792 & 0.8336 & 0.203498 \tabularnewline
48 & 0.24384 & 2.1673 & 0.016612 \tabularnewline
\hline
\end{tabular}
%Source: https://freestatistics.org/blog/index.php?pk=71799&T=1

[TABLE]
[ROW][C]Autocorrelation Function[/C][/ROW]
[ROW][C]Time lag k[/C][C]ACF(k)[/C][C]T-STAT[/C][C]P-value[/C][/ROW]
[ROW][C]1[/C][C]0.253294[/C][C]2.2513[/C][C]0.013571[/C][/ROW]
[ROW][C]2[/C][C]-0.032979[/C][C]-0.2931[/C][C]0.385099[/C][/ROW]
[ROW][C]3[/C][C]0.013108[/C][C]0.1165[/C][C]0.453774[/C][/ROW]
[ROW][C]4[/C][C]-0.163834[/C][C]-1.4562[/C][C]0.074652[/C][/ROW]
[ROW][C]5[/C][C]-0.162128[/C][C]-1.441[/C][C]0.076765[/C][/ROW]
[ROW][C]6[/C][C]-0.043494[/C][C]-0.3866[/C][C]0.350052[/C][/ROW]
[ROW][C]7[/C][C]-0.197032[/C][C]-1.7513[/C][C]0.041891[/C][/ROW]
[ROW][C]8[/C][C]-0.078159[/C][C]-0.6947[/C][C]0.244642[/C][/ROW]
[ROW][C]9[/C][C]-0.084279[/C][C]-0.7491[/C][C]0.228013[/C][/ROW]
[ROW][C]10[/C][C]-0.078431[/C][C]-0.6971[/C][C]0.24389[/C][/ROW]
[ROW][C]11[/C][C]0.333759[/C][C]2.9665[/C][C]0.001992[/C][/ROW]
[ROW][C]12[/C][C]0.584489[/C][C]5.1951[/C][C]1e-06[/C][/ROW]
[ROW][C]13[/C][C]0.219969[/C][C]1.9551[/C][C]0.027052[/C][/ROW]
[ROW][C]14[/C][C]-0.029096[/C][C]-0.2586[/C][C]0.398303[/C][/ROW]
[ROW][C]15[/C][C]-0.090608[/C][C]-0.8053[/C][C]0.21152[/C][/ROW]
[ROW][C]16[/C][C]-0.130461[/C][C]-1.1596[/C][C]0.124859[/C][/ROW]
[ROW][C]17[/C][C]-0.19755[/C][C]-1.7559[/C][C]0.041494[/C][/ROW]
[ROW][C]18[/C][C]-0.116759[/C][C]-1.0378[/C][C]0.151269[/C][/ROW]
[ROW][C]19[/C][C]-0.09936[/C][C]-0.8831[/C][C]0.189924[/C][/ROW]
[ROW][C]20[/C][C]-0.132367[/C][C]-1.1765[/C][C]0.121463[/C][/ROW]
[ROW][C]21[/C][C]-0.134806[/C][C]-1.1982[/C][C]0.117213[/C][/ROW]
[ROW][C]22[/C][C]-0.058917[/C][C]-0.5237[/C][C]0.300989[/C][/ROW]
[ROW][C]23[/C][C]0.157138[/C][C]1.3967[/C][C]0.083212[/C][/ROW]
[ROW][C]24[/C][C]0.436071[/C][C]3.8759[/C][C]0.000109[/C][/ROW]
[ROW][C]25[/C][C]0.188467[/C][C]1.6751[/C][C]0.048931[/C][/ROW]
[ROW][C]26[/C][C]-0.062741[/C][C]-0.5577[/C][C]0.289328[/C][/ROW]
[ROW][C]27[/C][C]-0.098181[/C][C]-0.8727[/C][C]0.192748[/C][/ROW]
[ROW][C]28[/C][C]-0.106464[/C][C]-0.9463[/C][C]0.173448[/C][/ROW]
[ROW][C]29[/C][C]-0.20126[/C][C]-1.7888[/C][C]0.038737[/C][/ROW]
[ROW][C]30[/C][C]-0.116279[/C][C]-1.0335[/C][C]0.152259[/C][/ROW]
[ROW][C]31[/C][C]-0.139477[/C][C]-1.2397[/C][C]0.109379[/C][/ROW]
[ROW][C]32[/C][C]-0.13589[/C][C]-1.2078[/C][C]0.115361[/C][/ROW]
[ROW][C]33[/C][C]-0.101405[/C][C]-0.9013[/C][C]0.185083[/C][/ROW]
[ROW][C]34[/C][C]-0.099312[/C][C]-0.8827[/C][C]0.190038[/C][/ROW]
[ROW][C]35[/C][C]0.131153[/C][C]1.1657[/C][C]0.123618[/C][/ROW]
[ROW][C]36[/C][C]0.33916[/C][C]3.0145[/C][C]0.00173[/C][/ROW]
[ROW][C]37[/C][C]0.15574[/C][C]1.3842[/C][C]0.08509[/C][/ROW]
[ROW][C]38[/C][C]-0.008768[/C][C]-0.0779[/C][C]0.469041[/C][/ROW]
[ROW][C]39[/C][C]-0.037452[/C][C]-0.3329[/C][C]0.370053[/C][/ROW]
[ROW][C]40[/C][C]-0.077691[/C][C]-0.6905[/C][C]0.245942[/C][/ROW]
[ROW][C]41[/C][C]-0.120494[/C][C]-1.071[/C][C]0.143721[/C][/ROW]
[ROW][C]42[/C][C]-0.076195[/C][C]-0.6772[/C][C]0.250116[/C][/ROW]
[ROW][C]43[/C][C]-0.05289[/C][C]-0.4701[/C][C]0.319789[/C][/ROW]
[ROW][C]44[/C][C]-0.043881[/C][C]-0.39[/C][C]0.348785[/C][/ROW]
[ROW][C]45[/C][C]-0.12395[/C][C]-1.1017[/C][C]0.136971[/C][/ROW]
[ROW][C]46[/C][C]-0.031349[/C][C]-0.2786[/C][C]0.390626[/C][/ROW]
[ROW][C]47[/C][C]0.093792[/C][C]0.8336[/C][C]0.203498[/C][/ROW]
[ROW][C]48[/C][C]0.24384[/C][C]2.1673[/C][C]0.016612[/C][/ROW]
[/TABLE]
Source: https://freestatistics.org/blog/index.php?pk=71799&T=1

Globally Unique Identifier (entire table): ba.freestatistics.org/blog/index.php?pk=71799&T=1

As an alternative you can also use a QR Code:  

The GUIDs for individual cells are displayed in the table below:

Autocorrelation Function
Time lag kACF(k)T-STATP-value
10.2532942.25130.013571
2-0.032979-0.29310.385099
30.0131080.11650.453774
4-0.163834-1.45620.074652
5-0.162128-1.4410.076765
6-0.043494-0.38660.350052
7-0.197032-1.75130.041891
8-0.078159-0.69470.244642
9-0.084279-0.74910.228013
10-0.078431-0.69710.24389
110.3337592.96650.001992
120.5844895.19511e-06
130.2199691.95510.027052
14-0.029096-0.25860.398303
15-0.090608-0.80530.21152
16-0.130461-1.15960.124859
17-0.19755-1.75590.041494
18-0.116759-1.03780.151269
19-0.09936-0.88310.189924
20-0.132367-1.17650.121463
21-0.134806-1.19820.117213
22-0.058917-0.52370.300989
230.1571381.39670.083212
240.4360713.87590.000109
250.1884671.67510.048931
26-0.062741-0.55770.289328
27-0.098181-0.87270.192748
28-0.106464-0.94630.173448
29-0.20126-1.78880.038737
30-0.116279-1.03350.152259
31-0.139477-1.23970.109379
32-0.13589-1.20780.115361
33-0.101405-0.90130.185083
34-0.099312-0.88270.190038
350.1311531.16570.123618
360.339163.01450.00173
370.155741.38420.08509
38-0.008768-0.07790.469041
39-0.037452-0.33290.370053
40-0.077691-0.69050.245942
41-0.120494-1.0710.143721
42-0.076195-0.67720.250116
43-0.05289-0.47010.319789
44-0.043881-0.390.348785
45-0.12395-1.10170.136971
46-0.031349-0.27860.390626
470.0937920.83360.203498
480.243842.16730.016612


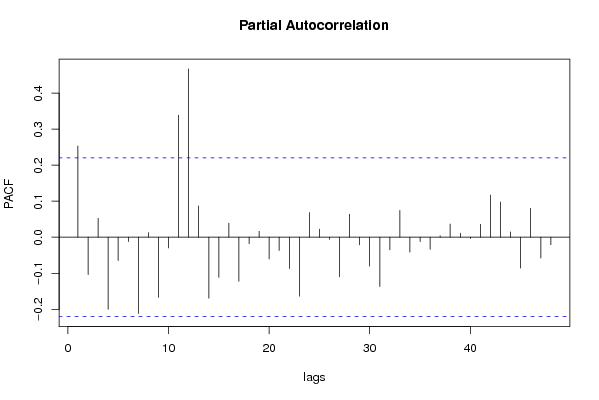
Partial Autocorrelation Function
Time lag kPACF(k)T-STATP-value
10.2532942.25130.013571
2-0.103796-0.92260.179523
30.0525180.46680.320967
4-0.20015-1.7790.039545
5-0.064919-0.5770.282785
6-0.012073-0.10730.457409
7-0.211899-1.88340.031663
80.0125190.11130.455843
9-0.167195-1.48610.070622
10-0.029598-0.26310.39659
110.3388013.01130.001746
120.4672554.15314.1e-05
130.0865110.76890.222114
14-0.169168-1.50360.068336
15-0.111315-0.98940.162747
160.0388980.34570.36523
17-0.122325-1.08720.140117
18-0.018172-0.16150.436049
190.0162760.14470.442673
20-0.060363-0.53650.296554
21-0.036729-0.32650.372473
22-0.087125-0.77440.220508
23-0.163797-1.45590.074696
240.0685090.60890.272161
250.0223860.1990.421399
26-0.00566-0.05030.480002
27-0.10995-0.97730.165712
280.0640220.5690.285472
29-0.021117-0.18770.425799
30-0.080105-0.7120.239285
31-0.136983-1.21750.113514
32-0.034964-0.31080.3784
330.0745180.66230.254843
34-0.041333-0.36740.35716
35-0.012114-0.10770.457266
36-0.033534-0.29810.38322
370.003860.03430.48636
380.0364370.32390.373451
390.0110970.09860.46084
40-0.003806-0.03380.486551
410.0359670.31970.375025
420.1170551.04040.150662
430.0975220.86680.194339
440.0147080.13070.448163
45-0.085753-0.76220.224108
460.080270.71350.238832
47-0.057743-0.51320.304612
48-0.020859-0.18540.426695

\begin{tabular}{lllllllll}
\hline
Partial Autocorrelation Function \tabularnewline
Time lag k & PACF(k) & T-STAT & P-value \tabularnewline
1 & 0.253294 & 2.2513 & 0.013571 \tabularnewline
2 & -0.103796 & -0.9226 & 0.179523 \tabularnewline
3 & 0.052518 & 0.4668 & 0.320967 \tabularnewline
4 & -0.20015 & -1.779 & 0.039545 \tabularnewline
5 & -0.064919 & -0.577 & 0.282785 \tabularnewline
6 & -0.012073 & -0.1073 & 0.457409 \tabularnewline
7 & -0.211899 & -1.8834 & 0.031663 \tabularnewline
8 & 0.012519 & 0.1113 & 0.455843 \tabularnewline
9 & -0.167195 & -1.4861 & 0.070622 \tabularnewline
10 & -0.029598 & -0.2631 & 0.39659 \tabularnewline
11 & 0.338801 & 3.0113 & 0.001746 \tabularnewline
12 & 0.467255 & 4.1531 & 4.1e-05 \tabularnewline
13 & 0.086511 & 0.7689 & 0.222114 \tabularnewline
14 & -0.169168 & -1.5036 & 0.068336 \tabularnewline
15 & -0.111315 & -0.9894 & 0.162747 \tabularnewline
16 & 0.038898 & 0.3457 & 0.36523 \tabularnewline
17 & -0.122325 & -1.0872 & 0.140117 \tabularnewline
18 & -0.018172 & -0.1615 & 0.436049 \tabularnewline
19 & 0.016276 & 0.1447 & 0.442673 \tabularnewline
20 & -0.060363 & -0.5365 & 0.296554 \tabularnewline
21 & -0.036729 & -0.3265 & 0.372473 \tabularnewline
22 & -0.087125 & -0.7744 & 0.220508 \tabularnewline
23 & -0.163797 & -1.4559 & 0.074696 \tabularnewline
24 & 0.068509 & 0.6089 & 0.272161 \tabularnewline
25 & 0.022386 & 0.199 & 0.421399 \tabularnewline
26 & -0.00566 & -0.0503 & 0.480002 \tabularnewline
27 & -0.10995 & -0.9773 & 0.165712 \tabularnewline
28 & 0.064022 & 0.569 & 0.285472 \tabularnewline
29 & -0.021117 & -0.1877 & 0.425799 \tabularnewline
30 & -0.080105 & -0.712 & 0.239285 \tabularnewline
31 & -0.136983 & -1.2175 & 0.113514 \tabularnewline
32 & -0.034964 & -0.3108 & 0.3784 \tabularnewline
33 & 0.074518 & 0.6623 & 0.254843 \tabularnewline
34 & -0.041333 & -0.3674 & 0.35716 \tabularnewline
35 & -0.012114 & -0.1077 & 0.457266 \tabularnewline
36 & -0.033534 & -0.2981 & 0.38322 \tabularnewline
37 & 0.00386 & 0.0343 & 0.48636 \tabularnewline
38 & 0.036437 & 0.3239 & 0.373451 \tabularnewline
39 & 0.011097 & 0.0986 & 0.46084 \tabularnewline
40 & -0.003806 & -0.0338 & 0.486551 \tabularnewline
41 & 0.035967 & 0.3197 & 0.375025 \tabularnewline
42 & 0.117055 & 1.0404 & 0.150662 \tabularnewline
43 & 0.097522 & 0.8668 & 0.194339 \tabularnewline
44 & 0.014708 & 0.1307 & 0.448163 \tabularnewline
45 & -0.085753 & -0.7622 & 0.224108 \tabularnewline
46 & 0.08027 & 0.7135 & 0.238832 \tabularnewline
47 & -0.057743 & -0.5132 & 0.304612 \tabularnewline
48 & -0.020859 & -0.1854 & 0.426695 \tabularnewline
\hline
\end{tabular}
%Source: https://freestatistics.org/blog/index.php?pk=71799&T=2

[TABLE]
[ROW][C]Partial Autocorrelation Function[/C][/ROW]
[ROW][C]Time lag k[/C][C]PACF(k)[/C][C]T-STAT[/C][C]P-value[/C][/ROW]
[ROW][C]1[/C][C]0.253294[/C][C]2.2513[/C][C]0.013571[/C][/ROW]
[ROW][C]2[/C][C]-0.103796[/C][C]-0.9226[/C][C]0.179523[/C][/ROW]
[ROW][C]3[/C][C]0.052518[/C][C]0.4668[/C][C]0.320967[/C][/ROW]
[ROW][C]4[/C][C]-0.20015[/C][C]-1.779[/C][C]0.039545[/C][/ROW]
[ROW][C]5[/C][C]-0.064919[/C][C]-0.577[/C][C]0.282785[/C][/ROW]
[ROW][C]6[/C][C]-0.012073[/C][C]-0.1073[/C][C]0.457409[/C][/ROW]
[ROW][C]7[/C][C]-0.211899[/C][C]-1.8834[/C][C]0.031663[/C][/ROW]
[ROW][C]8[/C][C]0.012519[/C][C]0.1113[/C][C]0.455843[/C][/ROW]
[ROW][C]9[/C][C]-0.167195[/C][C]-1.4861[/C][C]0.070622[/C][/ROW]
[ROW][C]10[/C][C]-0.029598[/C][C]-0.2631[/C][C]0.39659[/C][/ROW]
[ROW][C]11[/C][C]0.338801[/C][C]3.0113[/C][C]0.001746[/C][/ROW]
[ROW][C]12[/C][C]0.467255[/C][C]4.1531[/C][C]4.1e-05[/C][/ROW]
[ROW][C]13[/C][C]0.086511[/C][C]0.7689[/C][C]0.222114[/C][/ROW]
[ROW][C]14[/C][C]-0.169168[/C][C]-1.5036[/C][C]0.068336[/C][/ROW]
[ROW][C]15[/C][C]-0.111315[/C][C]-0.9894[/C][C]0.162747[/C][/ROW]
[ROW][C]16[/C][C]0.038898[/C][C]0.3457[/C][C]0.36523[/C][/ROW]
[ROW][C]17[/C][C]-0.122325[/C][C]-1.0872[/C][C]0.140117[/C][/ROW]
[ROW][C]18[/C][C]-0.018172[/C][C]-0.1615[/C][C]0.436049[/C][/ROW]
[ROW][C]19[/C][C]0.016276[/C][C]0.1447[/C][C]0.442673[/C][/ROW]
[ROW][C]20[/C][C]-0.060363[/C][C]-0.5365[/C][C]0.296554[/C][/ROW]
[ROW][C]21[/C][C]-0.036729[/C][C]-0.3265[/C][C]0.372473[/C][/ROW]
[ROW][C]22[/C][C]-0.087125[/C][C]-0.7744[/C][C]0.220508[/C][/ROW]
[ROW][C]23[/C][C]-0.163797[/C][C]-1.4559[/C][C]0.074696[/C][/ROW]
[ROW][C]24[/C][C]0.068509[/C][C]0.6089[/C][C]0.272161[/C][/ROW]
[ROW][C]25[/C][C]0.022386[/C][C]0.199[/C][C]0.421399[/C][/ROW]
[ROW][C]26[/C][C]-0.00566[/C][C]-0.0503[/C][C]0.480002[/C][/ROW]
[ROW][C]27[/C][C]-0.10995[/C][C]-0.9773[/C][C]0.165712[/C][/ROW]
[ROW][C]28[/C][C]0.064022[/C][C]0.569[/C][C]0.285472[/C][/ROW]
[ROW][C]29[/C][C]-0.021117[/C][C]-0.1877[/C][C]0.425799[/C][/ROW]
[ROW][C]30[/C][C]-0.080105[/C][C]-0.712[/C][C]0.239285[/C][/ROW]
[ROW][C]31[/C][C]-0.136983[/C][C]-1.2175[/C][C]0.113514[/C][/ROW]
[ROW][C]32[/C][C]-0.034964[/C][C]-0.3108[/C][C]0.3784[/C][/ROW]
[ROW][C]33[/C][C]0.074518[/C][C]0.6623[/C][C]0.254843[/C][/ROW]
[ROW][C]34[/C][C]-0.041333[/C][C]-0.3674[/C][C]0.35716[/C][/ROW]
[ROW][C]35[/C][C]-0.012114[/C][C]-0.1077[/C][C]0.457266[/C][/ROW]
[ROW][C]36[/C][C]-0.033534[/C][C]-0.2981[/C][C]0.38322[/C][/ROW]
[ROW][C]37[/C][C]0.00386[/C][C]0.0343[/C][C]0.48636[/C][/ROW]
[ROW][C]38[/C][C]0.036437[/C][C]0.3239[/C][C]0.373451[/C][/ROW]
[ROW][C]39[/C][C]0.011097[/C][C]0.0986[/C][C]0.46084[/C][/ROW]
[ROW][C]40[/C][C]-0.003806[/C][C]-0.0338[/C][C]0.486551[/C][/ROW]
[ROW][C]41[/C][C]0.035967[/C][C]0.3197[/C][C]0.375025[/C][/ROW]
[ROW][C]42[/C][C]0.117055[/C][C]1.0404[/C][C]0.150662[/C][/ROW]
[ROW][C]43[/C][C]0.097522[/C][C]0.8668[/C][C]0.194339[/C][/ROW]
[ROW][C]44[/C][C]0.014708[/C][C]0.1307[/C][C]0.448163[/C][/ROW]
[ROW][C]45[/C][C]-0.085753[/C][C]-0.7622[/C][C]0.224108[/C][/ROW]
[ROW][C]46[/C][C]0.08027[/C][C]0.7135[/C][C]0.238832[/C][/ROW]
[ROW][C]47[/C][C]-0.057743[/C][C]-0.5132[/C][C]0.304612[/C][/ROW]
[ROW][C]48[/C][C]-0.020859[/C][C]-0.1854[/C][C]0.426695[/C][/ROW]
[/TABLE]
Source: https://freestatistics.org/blog/index.php?pk=71799&T=2

Globally Unique Identifier (entire table): ba.freestatistics.org/blog/index.php?pk=71799&T=2

As an alternative you can also use a QR Code:  

The GUIDs for individual cells are displayed in the table below:

Partial Autocorrelation Function
Time lag kPACF(k)T-STATP-value
10.2532942.25130.013571
2-0.103796-0.92260.179523
30.0525180.46680.320967
4-0.20015-1.7790.039545
5-0.064919-0.5770.282785
6-0.012073-0.10730.457409
7-0.211899-1.88340.031663
80.0125190.11130.455843
9-0.167195-1.48610.070622
10-0.029598-0.26310.39659
110.3388013.01130.001746
120.4672554.15314.1e-05
130.0865110.76890.222114
14-0.169168-1.50360.068336
15-0.111315-0.98940.162747
160.0388980.34570.36523
17-0.122325-1.08720.140117
18-0.018172-0.16150.436049
190.0162760.14470.442673
20-0.060363-0.53650.296554
21-0.036729-0.32650.372473
22-0.087125-0.77440.220508
23-0.163797-1.45590.074696
240.0685090.60890.272161
250.0223860.1990.421399
26-0.00566-0.05030.480002
27-0.10995-0.97730.165712
280.0640220.5690.285472
29-0.021117-0.18770.425799
30-0.080105-0.7120.239285
31-0.136983-1.21750.113514
32-0.034964-0.31080.3784
330.0745180.66230.254843
34-0.041333-0.36740.35716
35-0.012114-0.10770.457266
36-0.033534-0.29810.38322
370.003860.03430.48636
380.0364370.32390.373451
390.0110970.09860.46084
40-0.003806-0.03380.486551
410.0359670.31970.375025
420.1170551.04040.150662
430.0975220.86680.194339
440.0147080.13070.448163
45-0.085753-0.76220.224108
460.080270.71350.238832
47-0.057743-0.51320.304612
48-0.020859-0.18540.426695


Parameters (Session):
par1 = 48 ; par2 = 1 ; par3 = 1 ; par4 = 0 ; par5 = 12 ; par6 = White Noise ; par7 = 0.95 ;
Parameters (R input):
par1 = 48 ; par2 = 1 ; par3 = 1 ; par4 = 0 ; par5 = 12 ; par6 = White Noise ; par7 = 0.95 ;
R code (references can be found in the software module):
if (par1 == 'Default') {
par1 = 10*log10(length(x))
} else {
par1 <- as.numeric(par1)
}
par2 <- as.numeric(par2)
par3 <- as.numeric(par3)
par4 <- as.numeric(par4)
par5 <- as.numeric(par5)
if (par6 == 'White Noise') par6 <- 'white' else par6 <- 'ma'
par7 <- as.numeric(par7)
if (par2 == 0) {
x <- log(x)
} else {
x <- (x ^ par2 - 1) / par2
}
if (par3 > 0) x <- diff(x,lag=1,difference=par3)
if (par4 > 0) x <- diff(x,lag=par5,difference=par4)
bitmap(file='pic1.png')
racf <- acf(x, par1, main='Autocorrelation', xlab='time lag', ylab='ACF', ci.type=par6, ci=par7, sub=paste('(lambda=',par2,', d=',par3,', D=',par4,', CI=', par7, ', CI type=',par6,')',sep=''))
dev.off()
bitmap(file='pic2.png')
rpacf <- pacf(x,par1,main='Partial Autocorrelation',xlab='lags',ylab='PACF')
dev.off()
(myacf <- c(racf$acf))
(mypacf <- c(rpacf$acf))
lengthx <- length(x)
sqrtn <- sqrt(lengthx)
load(file='createtable')
a<-table.start()
a<-table.row.start(a)
a<-table.element(a,'Autocorrelation Function',4,TRUE)
a<-table.row.end(a)
a<-table.row.start(a)
a<-table.element(a,'Time lag k',header=TRUE)
a<-table.element(a,hyperlink('basics.htm','ACF(k)','click here for more information about the Autocorrelation Function'),header=TRUE)
a<-table.element(a,'T-STAT',header=TRUE)
a<-table.element(a,'P-value',header=TRUE)
a<-table.row.end(a)
for (i in 2:(par1+1)) {
a<-table.row.start(a)
a<-table.element(a,i-1,header=TRUE)
a<-table.element(a,round(myacf[i],6))
mytstat <- myacf[i]*sqrtn
a<-table.element(a,round(mytstat,4))
a<-table.element(a,round(1-pt(abs(mytstat),lengthx),6))
a<-table.row.end(a)
}
a<-table.end(a)
table.save(a,file='mytable.tab')
a<-table.start()
a<-table.row.start(a)
a<-table.element(a,'Partial Autocorrelation Function',4,TRUE)
a<-table.row.end(a)
a<-table.row.start(a)
a<-table.element(a,'Time lag k',header=TRUE)
a<-table.element(a,hyperlink('basics.htm','PACF(k)','click here for more information about the Partial Autocorrelation Function'),header=TRUE)
a<-table.element(a,'T-STAT',header=TRUE)
a<-table.element(a,'P-value',header=TRUE)
a<-table.row.end(a)
for (i in 1:par1) {
a<-table.row.start(a)
a<-table.element(a,i,header=TRUE)
a<-table.element(a,round(mypacf[i],6))
mytstat <- mypacf[i]*sqrtn
a<-table.element(a,round(mytstat,4))
a<-table.element(a,round(1-pt(abs(mytstat),lengthx),6))
a<-table.row.end(a)
}
a<-table.end(a)
table.save(a,file='mytable1.tab')