Free Statistics

of Irreproducible Research!

Author's title

Author*Unverified author*
R Software Modulerwasp_histogram.wasp
Title produced by softwareHistogram
Date of computationSat, 09 Jan 2010 14:25:05 -0700
Cite this page as followsStatistical Computations at FreeStatistics.org, Office for Research Development and Education, URL https://freestatistics.org/blog/index.php?v=date/2010/Jan/09/t1263072434589wzmkz5dgtwmv.htm/, Retrieved Sun, 28 Apr 2024 20:00:56 +0000
Statistical Computations at FreeStatistics.org, Office for Research Development and Education, URL https://freestatistics.org/blog/index.php?pk=71788, Retrieved Sun, 28 Apr 2024 20:00:56 +0000
QR Codes:

Original text written by user:
IsPrivate?No (this computation is public)
User-defined keywordsKDGP1W1
Estimated Impact155
Family? (F = Feedback message, R = changed R code, M = changed R Module, P = changed Parameters, D = changed Data)
-       [Histogram] [Frequentietabel ...] [2010-01-09 21:25:05] [d41d8cd98f00b204e9800998ecf8427e] [Current]
-         [Histogram] [Frequentietabel e...] [2010-01-10 14:26:57] [74be16979710d4c4e7c6647856088456]
-   P       [Histogram] [Frequentietabel e...] [2010-01-10 14:39:29] [74be16979710d4c4e7c6647856088456]
Feedback Forum

Post a new message
Dataseries X:
2766
3851
3289
3848
3348
3682
4058
3655
3811
3341
3032
3475
3353
3186
3902
4164
3499
4145
3796
3711
3949
3740
3243
4407
4814
3908
5250
3937
4004
5560
3922
3759
4138
4634
3996
4308
4143
4429
5219
4929
5761
5592
4163
4962
5208
4755
4491
5732
5731
5040
6102
4904
5369
5578
4619
4731
5011
5299
4146
4625
4736
4219
5116
4205
4121
5103
4300
4578
3809
5526
4248
3830
4430
4837
4408
4569
4104
4807
3944
3794
4390
4041
4104
4823


Summary of computational transaction
Raw Inputview raw input (R code)
Raw Outputview raw output of R engine
Computing time1 seconds
R Server'Gwilym Jenkins' @ 72.249.127.135

\begin{tabular}{lllllllll}
\hline
Summary of computational transaction \tabularnewline
Raw Input & view raw input (R code)  \tabularnewline
Raw Output & view raw output of R engine  \tabularnewline
Computing time & 1 seconds \tabularnewline
R Server & 'Gwilym Jenkins' @ 72.249.127.135 \tabularnewline
\hline
\end{tabular}
%Source: https://freestatistics.org/blog/index.php?pk=71788&T=0

[TABLE]
[ROW][C]Summary of computational transaction[/C][/ROW]
[ROW][C]Raw Input[/C][C]view raw input (R code) [/C][/ROW]
[ROW][C]Raw Output[/C][C]view raw output of R engine [/C][/ROW]
[ROW][C]Computing time[/C][C]1 seconds[/C][/ROW]
[ROW][C]R Server[/C][C]'Gwilym Jenkins' @ 72.249.127.135[/C][/ROW]
[/TABLE]
Source: https://freestatistics.org/blog/index.php?pk=71788&T=0

Globally Unique Identifier (entire table): ba.freestatistics.org/blog/index.php?pk=71788&T=0

As an alternative you can also use a QR Code:  

The GUIDs for individual cells are displayed in the table below:

Summary of computational transaction
Raw Inputview raw input (R code)
Raw Outputview raw output of R engine
Computing time1 seconds
R Server'Gwilym Jenkins' @ 72.249.127.135


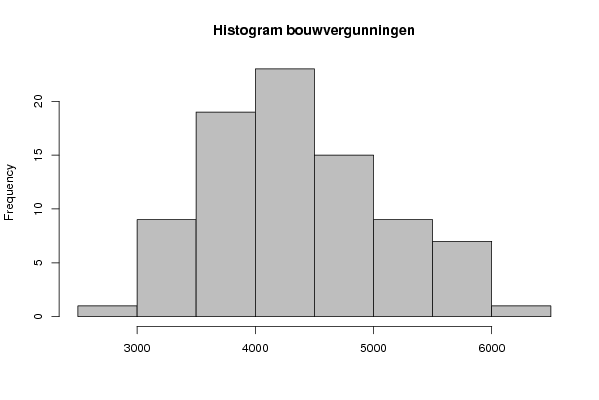
Frequency Table (Histogram)
BinsMidpointAbs. FrequencyRel. FrequencyCumul. Rel. Freq.Density
[2500,3000[275010.0119050.0119052.4e-05
[3000,3500[325090.1071430.1190480.000214
[3500,4000[3750190.226190.3452380.000452
[4000,4500[4250230.273810.6190480.000548
[4500,5000[4750150.1785710.7976190.000357
[5000,5500[525090.1071430.9047620.000214
[5500,6000[575070.0833330.9880950.000167
[6000,6500]625010.01190512.4e-05

\begin{tabular}{lllllllll}
\hline
Frequency Table (Histogram) \tabularnewline
Bins & Midpoint & Abs. Frequency & Rel. Frequency & Cumul. Rel. Freq. & Density \tabularnewline
[2500,3000[ & 2750 & 1 & 0.011905 & 0.011905 & 2.4e-05 \tabularnewline
[3000,3500[ & 3250 & 9 & 0.107143 & 0.119048 & 0.000214 \tabularnewline
[3500,4000[ & 3750 & 19 & 0.22619 & 0.345238 & 0.000452 \tabularnewline
[4000,4500[ & 4250 & 23 & 0.27381 & 0.619048 & 0.000548 \tabularnewline
[4500,5000[ & 4750 & 15 & 0.178571 & 0.797619 & 0.000357 \tabularnewline
[5000,5500[ & 5250 & 9 & 0.107143 & 0.904762 & 0.000214 \tabularnewline
[5500,6000[ & 5750 & 7 & 0.083333 & 0.988095 & 0.000167 \tabularnewline
[6000,6500] & 6250 & 1 & 0.011905 & 1 & 2.4e-05 \tabularnewline
\hline
\end{tabular}
%Source: https://freestatistics.org/blog/index.php?pk=71788&T=1

[TABLE]
[ROW][C]Frequency Table (Histogram)[/C][/ROW]
[ROW][C]Bins[/C][C]Midpoint[/C][C]Abs. Frequency[/C][C]Rel. Frequency[/C][C]Cumul. Rel. Freq.[/C][C]Density[/C][/ROW]
[ROW][C][2500,3000[[/C][C]2750[/C][C]1[/C][C]0.011905[/C][C]0.011905[/C][C]2.4e-05[/C][/ROW]
[ROW][C][3000,3500[[/C][C]3250[/C][C]9[/C][C]0.107143[/C][C]0.119048[/C][C]0.000214[/C][/ROW]
[ROW][C][3500,4000[[/C][C]3750[/C][C]19[/C][C]0.22619[/C][C]0.345238[/C][C]0.000452[/C][/ROW]
[ROW][C][4000,4500[[/C][C]4250[/C][C]23[/C][C]0.27381[/C][C]0.619048[/C][C]0.000548[/C][/ROW]
[ROW][C][4500,5000[[/C][C]4750[/C][C]15[/C][C]0.178571[/C][C]0.797619[/C][C]0.000357[/C][/ROW]
[ROW][C][5000,5500[[/C][C]5250[/C][C]9[/C][C]0.107143[/C][C]0.904762[/C][C]0.000214[/C][/ROW]
[ROW][C][5500,6000[[/C][C]5750[/C][C]7[/C][C]0.083333[/C][C]0.988095[/C][C]0.000167[/C][/ROW]
[ROW][C][6000,6500][/C][C]6250[/C][C]1[/C][C]0.011905[/C][C]1[/C][C]2.4e-05[/C][/ROW]
[/TABLE]
Source: https://freestatistics.org/blog/index.php?pk=71788&T=1

Globally Unique Identifier (entire table): ba.freestatistics.org/blog/index.php?pk=71788&T=1

As an alternative you can also use a QR Code:  

The GUIDs for individual cells are displayed in the table below:

Frequency Table (Histogram)
BinsMidpointAbs. FrequencyRel. FrequencyCumul. Rel. Freq.Density
[2500,3000[275010.0119050.0119052.4e-05
[3000,3500[325090.1071430.1190480.000214
[3500,4000[3750190.226190.3452380.000452
[4000,4500[4250230.273810.6190480.000548
[4500,5000[4750150.1785710.7976190.000357
[5000,5500[525090.1071430.9047620.000214
[5500,6000[575070.0833330.9880950.000167
[6000,6500]625010.01190512.4e-05


Parameters (Session):
par2 = grey ; par3 = FALSE ; par4 = Unknown ;
Parameters (R input):
par1 = ; par2 = grey ; par3 = FALSE ; par4 = Unknown ;
R code (references can be found in the software module):
par1 <- as.numeric(par1)
if (par3 == 'TRUE') par3 <- TRUE
if (par3 == 'FALSE') par3 <- FALSE
if (par4 == 'Unknown') par1 <- as.numeric(par1)
if (par4 == 'Interval/Ratio') par1 <- as.numeric(par1)
if (par4 == '3-point Likert') par1 <- c(1:3 - 0.5, 3.5)
if (par4 == '4-point Likert') par1 <- c(1:4 - 0.5, 4.5)
if (par4 == '5-point Likert') par1 <- c(1:5 - 0.5, 5.5)
if (par4 == '6-point Likert') par1 <- c(1:6 - 0.5, 6.5)
if (par4 == '7-point Likert') par1 <- c(1:7 - 0.5, 7.5)
if (par4 == '8-point Likert') par1 <- c(1:8 - 0.5, 8.5)
if (par4 == '9-point Likert') par1 <- c(1:9 - 0.5, 9.5)
if (par4 == '10-point Likert') par1 <- c(1:10 - 0.5, 10.5)
bitmap(file='test1.png')
if (is.na(par1)) {
myhist<-hist(x,col=par2,main=main,xlab=xlab,right=par3)
} else {
if (par1 < 0) par1 <- 3
if (par1 > 50) par1 <- 50
myhist<-hist(x,breaks=par1,col=par2,main=main,xlab=xlab,right=par3)
}
dev.off()
myhist
n <- length(x)
load(file='createtable')
a<-table.start()
a<-table.row.start(a)
a<-table.element(a,hyperlink('histogram.htm','Frequency Table (Histogram)',''),6,TRUE)
a<-table.row.end(a)
a<-table.row.start(a)
a<-table.element(a,'Bins',header=TRUE)
a<-table.element(a,'Midpoint',header=TRUE)
a<-table.element(a,'Abs. Frequency',header=TRUE)
a<-table.element(a,'Rel. Frequency',header=TRUE)
a<-table.element(a,'Cumul. Rel. Freq.',header=TRUE)
a<-table.element(a,'Density',header=TRUE)
a<-table.row.end(a)
crf <- 0
if (par3 == FALSE) mybracket <- '[' else mybracket <- ']'
mynumrows <- (length(myhist$breaks)-1)
for (i in 1:mynumrows) {
a<-table.row.start(a)
if (i == 1)
dum <- paste('[',myhist$breaks[i],sep='')
else
dum <- paste(mybracket,myhist$breaks[i],sep='')
dum <- paste(dum,myhist$breaks[i+1],sep=',')
if (i==mynumrows)
dum <- paste(dum,']',sep='')
else
dum <- paste(dum,mybracket,sep='')
a<-table.element(a,dum,header=TRUE)
a<-table.element(a,myhist$mids[i])
a<-table.element(a,myhist$counts[i])
rf <- myhist$counts[i]/n
crf <- crf + rf
a<-table.element(a,round(rf,6))
a<-table.element(a,round(crf,6))
a<-table.element(a,round(myhist$density[i],6))
a<-table.row.end(a)
}
a<-table.end(a)
table.save(a,file='mytable.tab')