| Multiple Linear Regression - Estimated Regression Equation |
| werkl[t] = + 26.3106019568154 + 1.31669964010823`werkl-1`[t] -0.717070137986305`werkl-2`[t] -0.232618213537436afzetp[t] + 0.0457433670576205M1[t] + 0.193077155005919M2[t] + 0.213469490726063M3[t] -0.0394471352569172M4[t] -0.00298783299766641M5[t] -0.0692285262308115M6[t] -0.0376573725565223M7[t] + 0.0442625747595174M8[t] + 0.664799937984984M9[t] -0.203343875163899M10[t] + 0.078324253693556M11[t] + 0.0195867962194246t + e[t] |
| Multiple Linear Regression - Ordinary Least Squares | |||||
| Variable | Parameter | S.D. | T-STAT H0: parameter = 0 | 2-tail p-value | 1-tail p-value |
| (Intercept) | 26.3106019568154 | 5.272524 | 4.9901 | 6e-06 | 3e-06 |
| `werkl-1` | 1.31669964010823 | 0.0903 | 14.5814 | 0 | 0 |
| `werkl-2` | -0.717070137986305 | 0.087976 | -8.1507 | 0 | 0 |
| afzetp | -0.232618213537436 | 0.04956 | -4.6937 | 1.8e-05 | 9e-06 |
| M1 | 0.0457433670576205 | 0.104131 | 0.4393 | 0.662175 | 0.331087 |
| M2 | 0.193077155005919 | 0.109927 | 1.7564 | 0.084585 | 0.042292 |
| M3 | 0.213469490726063 | 0.108866 | 1.9609 | 0.054968 | 0.027484 |
| M4 | -0.0394471352569172 | 0.108836 | -0.3624 | 0.718408 | 0.359204 |
| M5 | -0.00298783299766641 | 0.101962 | -0.0293 | 0.976729 | 0.488364 |
| M6 | -0.0692285262308115 | 0.102329 | -0.6765 | 0.501541 | 0.250771 |
| M7 | -0.0376573725565223 | 0.104668 | -0.3598 | 0.720389 | 0.360194 |
| M8 | 0.0442625747595174 | 0.109779 | 0.4032 | 0.688366 | 0.344183 |
| M9 | 0.664799937984984 | 0.113401 | 5.8624 | 0 | 0 |
| M10 | -0.203343875163899 | 0.127001 | -1.6011 | 0.115079 | 0.057539 |
| M11 | 0.078324253693556 | 0.103561 | 0.7563 | 0.452691 | 0.226346 |
| t | 0.0195867962194246 | 0.005247 | 3.7329 | 0.000451 | 0.000225 |
| Multiple Linear Regression - Regression Statistics | |
| Multiple R | 0.977494074989697 |
| R-squared | 0.955494666639963 |
| Adjusted R-squared | 0.943356848450863 |
| F-TEST (value) | 78.7204629163045 |
| F-TEST (DF numerator) | 15 |
| F-TEST (DF denominator) | 55 |
| p-value | 0 |
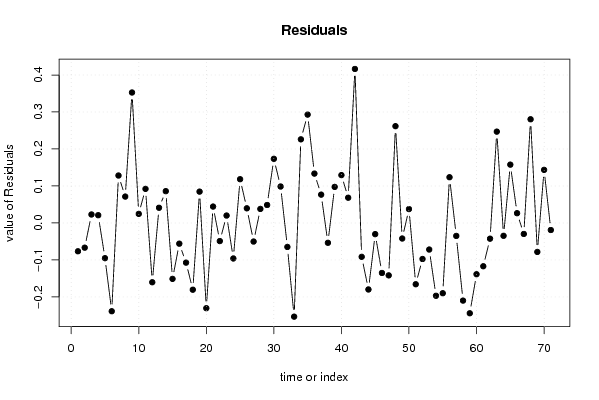
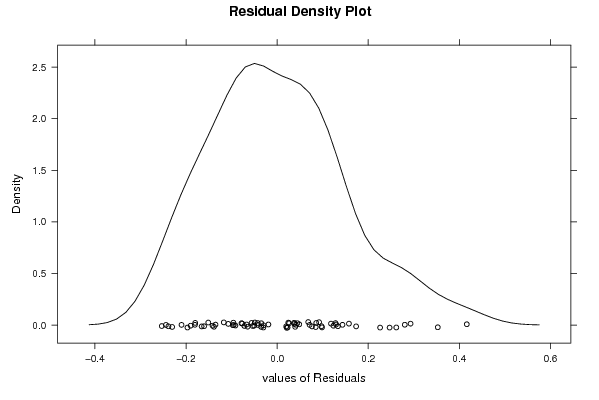
| Multiple Linear Regression - Residual Statistics | |
| Residual Standard Deviation | 0.166646632358458 |
| Sum Squared Residuals | 1.52741050420283 |
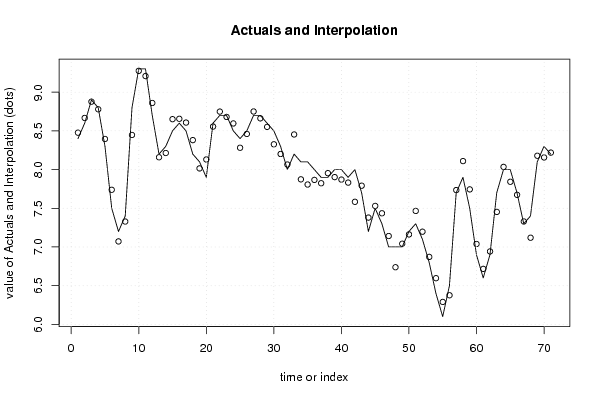
| Multiple Linear Regression - Actuals, Interpolation, and Residuals | |||
| Time or Index | Actuals | Interpolation Forecast | Residuals Prediction Error |
| 1 | 8.4 | 8.47666408312547 | -0.0766640831254713 |
| 2 | 8.6 | 8.66684648864691 | -0.0668464886469122 |
| 3 | 8.9 | 8.87711826319315 | 0.0228817368068487 |
| 4 | 8.8 | 8.77907519109608 | 0.0209248089039169 |
| 5 | 8.3 | 8.39528299875307 | -0.0952829987530737 |
| 6 | 7.5 | 7.73872447413013 | -0.238724474130125 |
| 7 | 7.2 | 7.07179595957667 | 0.128204040423333 |
| 8 | 7.4 | 7.32868710011497 | 0.0713128998850345 |
| 9 | 8.8 | 8.4472722289774 | 0.352727771022605 |
| 10 | 9.3 | 9.27541885924845 | 0.0245811407515535 |
| 11 | 9.3 | 9.20786358984487 | 0.0921364101551311 |
| 12 | 8.7 | 8.86037652743881 | -0.160376527438816 |
| 13 | 8.2 | 8.15894872800467 | 0.0410512719953341 |
| 14 | 8.3 | 8.21407068167878 | 0.085929318321224 |
| 15 | 8.5 | 8.65120756120735 | -0.151207561207351 |
| 16 | 8.6 | 8.6560342883743 | -0.0560342883742955 |
| 17 | 8.5 | 8.60728903785156 | -0.107289037851557 |
| 18 | 8.2 | 8.38051998438213 | -0.180519984382127 |
| 19 | 8.1 | 8.01532777062703 | 0.0846722293729708 |
| 20 | 7.9 | 8.13050012748633 | -0.230500127486333 |
| 21 | 8.6 | 8.55572955135447 | 0.0442704486455342 |
| 22 | 8.7 | 8.74901448874428 | -0.0490144887442831 |
| 23 | 8.7 | 8.67999028124157 | 0.0200097187584284 |
| 24 | 8.5 | 8.5960694526763 | -0.096069452676297 |
| 25 | 8.4 | 8.28175058116298 | 0.118249418837021 |
| 26 | 8.5 | 8.46041522891714 | 0.0395847710828588 |
| 27 | 8.7 | 8.75029498137365 | -0.0502949813736478 |
| 28 | 8.7 | 8.66207442312562 | 0.0379255768743785 |
| 29 | 8.6 | 8.55144467265329 | 0.0485553273467098 |
| 30 | 8.5 | 8.32659716892126 | 0.173402831078740 |
| 31 | 8.3 | 8.20148306183406 | 0.0985169381659373 |
| 32 | 8 | 8.06483324843903 | -0.0648332484390293 |
| 33 | 8.2 | 8.45336154344871 | -0.253361543448713 |
| 34 | 8.1 | 7.8739091037531 | 0.226090896246903 |
| 35 | 8.1 | 7.80703275180692 | 0.292967248193081 |
| 36 | 8 | 7.8665259508389 | 0.133474049161095 |
| 37 | 7.9 | 7.82344797145887 | 0.0765520285411273 |
| 38 | 7.9 | 7.95366742676815 | -0.0536674267681462 |
| 39 | 8 | 7.90252082303014 | 0.0974791769698596 |
| 40 | 8 | 7.87064642133864 | 0.129353578661364 |
| 41 | 7.9 | 7.83172368466494 | 0.0682763153350615 |
| 42 | 8 | 7.58361435957917 | 0.416385640420833 |
| 43 | 7.7 | 7.79162564457484 | -0.0916256445748447 |
| 44 | 7.2 | 7.37989183957172 | -0.179891839571723 |
| 45 | 7.5 | 7.5302635776509 | -0.0302635776509057 |
| 46 | 7.3 | 7.43525152174707 | -0.135251521747068 |
| 47 | 7 | 7.1417363706377 | -0.141736370637692 |
| 48 | 7 | 6.73835576331338 | 0.261644236686618 |
| 49 | 7 | 7.04206878934006 | -0.0420687893400602 |
| 50 | 7.2 | 7.1624657308003 | 0.0375342691997045 |
| 51 | 7.3 | 7.46578479076151 | -0.165784790761510 |
| 52 | 7.1 | 7.19744907605777 | -0.0974490760577733 |
| 53 | 6.8 | 6.87192459000868 | -0.0719245900086847 |
| 54 | 6.4 | 6.5969366499135 | -0.196936649913503 |
| 55 | 6.1 | 6.29001214245233 | -0.190012142452331 |
| 56 | 6.5 | 6.37638433456482 | 0.123615665435180 |
| 57 | 7.7 | 7.73504757009515 | -0.0350475700951526 |
| 58 | 7.9 | 8.10991660203981 | -0.209916602039813 |
| 59 | 7.5 | 7.74424182549354 | -0.244241825493542 |
| 60 | 6.9 | 7.0386723057326 | -0.138672305732600 |
| 61 | 6.6 | 6.71711984690795 | -0.117119846907950 |
| 62 | 6.9 | 6.94253444318873 | -0.0425344431887289 |
| 63 | 7.7 | 7.4530735804342 | 0.246926419565801 |
| 64 | 8 | 8.0347206000076 | -0.0347206000075903 |
| 65 | 8 | 7.84233501606846 | 0.157664983931544 |
| 66 | 7.7 | 7.67360736307382 | 0.0263926369261809 |
| 67 | 7.3 | 7.32975542093507 | -0.0297554209350653 |
| 68 | 7.4 | 7.11970334982313 | 0.280296650176870 |
| 69 | 8.1 | 8.17832552847337 | -0.078325528473368 |
| 70 | 8.3 | 8.1564894244673 | 0.143510575532708 |
| 71 | 8.2 | 8.2191351809754 | -0.0191351809754066 |
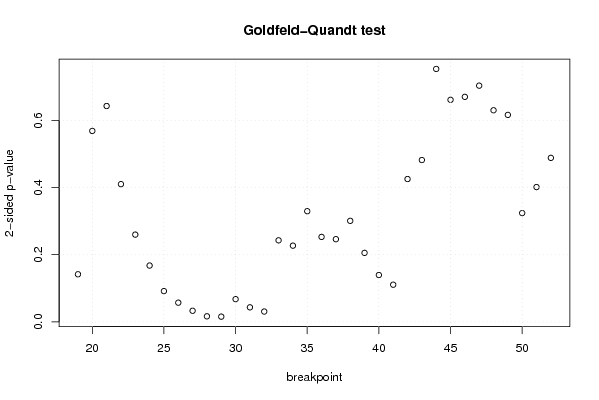
| Goldfeld-Quandt test for Heteroskedasticity | |||
| p-values | Alternative Hypothesis | ||
| breakpoint index | greater | 2-sided | less |
| 19 | 0.0708558767589141 | 0.141711753517828 | 0.929144123241086 |
| 20 | 0.284203277795617 | 0.568406555591234 | 0.715796722204383 |
| 21 | 0.321253293316592 | 0.642506586633184 | 0.678746706683408 |
| 22 | 0.205007919205788 | 0.410015838411576 | 0.794992080794212 |
| 23 | 0.129879369746952 | 0.259758739493905 | 0.870120630253048 |
| 24 | 0.0838253068968951 | 0.167650613793790 | 0.916174693103105 |
| 25 | 0.0458643231207309 | 0.0917286462414617 | 0.95413567687927 |
| 26 | 0.028565918964774 | 0.057131837929548 | 0.971434081035226 |
| 27 | 0.0165374856663115 | 0.0330749713326231 | 0.983462514333688 |
| 28 | 0.008295586925367 | 0.016591173850734 | 0.991704413074633 |
| 29 | 0.007786004743401 | 0.015572009486802 | 0.992213995256599 |
| 30 | 0.0338425849261086 | 0.0676851698522173 | 0.966157415073891 |
| 31 | 0.0216544274312256 | 0.0433088548624511 | 0.978345572568774 |
| 32 | 0.0154049450760977 | 0.0308098901521954 | 0.984595054923902 |
| 33 | 0.121377779994996 | 0.242755559989992 | 0.878622220005004 |
| 34 | 0.113450290826441 | 0.226900581652883 | 0.886549709173559 |
| 35 | 0.164728129558683 | 0.329456259117367 | 0.835271870441317 |
| 36 | 0.126474779702595 | 0.252949559405191 | 0.873525220297405 |
| 37 | 0.123087043958945 | 0.246174087917891 | 0.876912956041055 |
| 38 | 0.150386893103996 | 0.300773786207993 | 0.849613106896004 |
| 39 | 0.102728783865495 | 0.20545756773099 | 0.897271216134505 |
| 40 | 0.0697409270202281 | 0.139481854040456 | 0.930259072979772 |
| 41 | 0.0553428565095963 | 0.110685713019193 | 0.944657143490404 |
| 42 | 0.212577491039254 | 0.425154982078507 | 0.787422508960747 |
| 43 | 0.240879624810273 | 0.481759249620545 | 0.759120375189727 |
| 44 | 0.376424973087704 | 0.752849946175408 | 0.623575026912296 |
| 45 | 0.330503536377132 | 0.661007072754264 | 0.669496463622868 |
| 46 | 0.334930401836526 | 0.669860803673053 | 0.665069598163474 |
| 47 | 0.351560570863202 | 0.703121141726404 | 0.648439429136798 |
| 48 | 0.685083054644923 | 0.629833890710154 | 0.314916945355077 |
| 49 | 0.691944717129525 | 0.616110565740951 | 0.308055282870475 |
| 50 | 0.838060747705874 | 0.323878504588252 | 0.161939252294126 |
| 51 | 0.799369259536432 | 0.401261480927136 | 0.200630740463568 |
| 52 | 0.755898563837322 | 0.488202872325355 | 0.244101436162678 |
| Meta Analysis of Goldfeld-Quandt test for Heteroskedasticity | |||
| Description | # significant tests | % significant tests | OK/NOK |
| 1% type I error level | 0 | 0 | OK |
| 5% type I error level | 5 | 0.147058823529412 | NOK |
| 10% type I error level | 8 | 0.235294117647059 | NOK |