| Multiple Linear Regression - Estimated Regression Equation |
| werkl[t] = + 19.4250848391952 + 1.38018027566590`werkl-1`[t] -0.694005422132068`werkl-2`[t] -0.200396397847844`werkl-3`[t] + 0.217499603220255`werkl-4`[t] + 0.0508481331699843`werkl-5`[t] -0.174579752192536afzetp[t] -0.226257796357584M1[t] -0.129506295557380M2[t] -0.148491155978233M3[t] -0.169728355178839M4[t] -0.119227957982638M5[t] + 0.489046736630819M6[t] -0.415557532986574M7[t] -0.10456110042014M8[t] + 0.0158936263692312M9[t] -0.0350934389340346M10[t] + 0.0506195813463781M11[t] + 0.0162133957639823t + e[t] |
| Multiple Linear Regression - Ordinary Least Squares | |||||
| Variable | Parameter | S.D. | T-STAT H0: parameter = 0 | 2-tail p-value | 1-tail p-value |
| (Intercept) | 19.4250848391952 | 6.034377 | 3.2191 | 0.002284 | 0.001142 |
| `werkl-1` | 1.38018027566590 | 0.146104 | 9.4465 | 0 | 0 |
| `werkl-2` | -0.694005422132068 | 0.247281 | -2.8065 | 0.007166 | 0.003583 |
| `werkl-3` | -0.200396397847844 | 0.270402 | -0.7411 | 0.462167 | 0.231084 |
| `werkl-4` | 0.217499603220255 | 0.248385 | 0.8757 | 0.385489 | 0.192745 |
| `werkl-5` | 0.0508481331699843 | 0.134054 | 0.3793 | 0.706096 | 0.353048 |
| afzetp | -0.174579752192536 | 0.055399 | -3.1513 | 0.002771 | 0.001386 |
| M1 | -0.226257796357584 | 0.102885 | -2.1991 | 0.032619 | 0.01631 |
| M2 | -0.129506295557380 | 0.116627 | -1.1104 | 0.272234 | 0.136117 |
| M3 | -0.148491155978233 | 0.113998 | -1.3026 | 0.19881 | 0.099405 |
| M4 | -0.169728355178839 | 0.108223 | -1.5683 | 0.123242 | 0.061621 |
| M5 | -0.119227957982638 | 0.106469 | -1.1198 | 0.26824 | 0.13412 |
| M6 | 0.489046736630819 | 0.103489 | 4.7256 | 2e-05 | 1e-05 |
| M7 | -0.415557532986574 | 0.11831 | -3.5124 | 0.000965 | 0.000482 |
| M8 | -0.10456110042014 | 0.152152 | -0.6872 | 0.495186 | 0.247593 |
| M9 | 0.0158936263692312 | 0.162364 | 0.0979 | 0.92242 | 0.46121 |
| M10 | -0.0350934389340346 | 0.131428 | -0.267 | 0.790577 | 0.395289 |
| M11 | 0.0506195813463781 | 0.107891 | 0.4692 | 0.641027 | 0.320513 |
| t | 0.0162133957639823 | 0.005522 | 2.9362 | 0.005048 | 0.002524 |
| Multiple Linear Regression - Regression Statistics | |
| Multiple R | 0.980228972060803 |
| R-squared | 0.96084883766738 |
| Adjusted R-squared | 0.946466778034988 |
| F-TEST (value) | 66.8088481223753 |
| F-TEST (DF numerator) | 18 |
| F-TEST (DF denominator) | 49 |
| p-value | 0 |
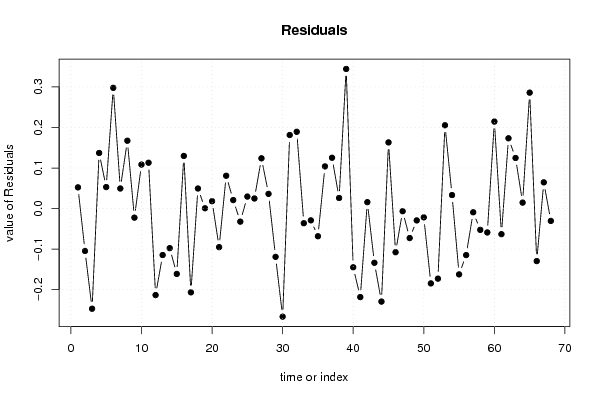
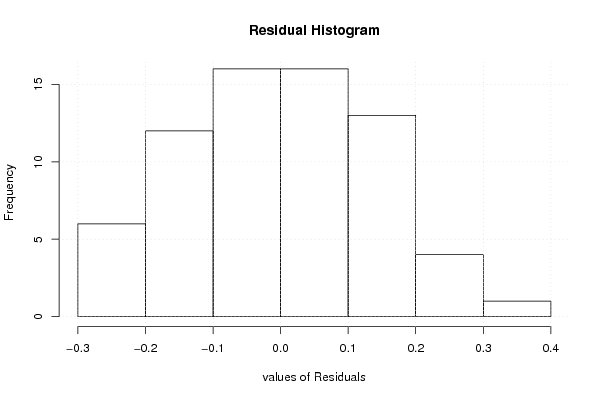
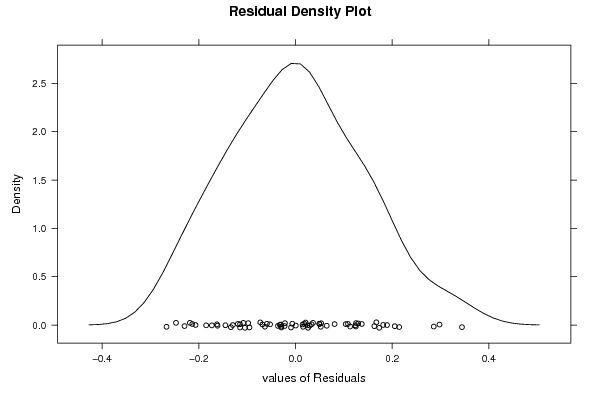
| Multiple Linear Regression - Residual Statistics | |
| Residual Standard Deviation | 0.161355997571108 |
| Sum Squared Residuals | 1.2757521396562 |
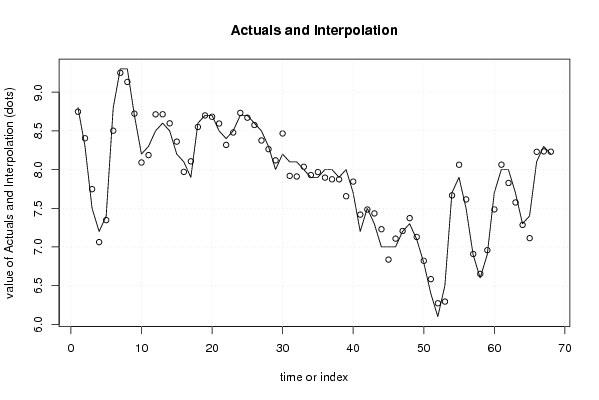
| Multiple Linear Regression - Actuals, Interpolation, and Residuals | |||
| Time or Index | Actuals | Interpolation Forecast | Residuals Prediction Error |
| 1 | 8.8 | 8.74776213751048 | 0.0522378624895221 |
| 2 | 8.3 | 8.40459619942178 | -0.104596199421779 |
| 3 | 7.5 | 7.74705816521561 | -0.247058165215610 |
| 4 | 7.2 | 7.0628940244779 | 0.137105975522094 |
| 5 | 7.4 | 7.34700277577762 | 0.0529972242223853 |
| 6 | 8.8 | 8.502211051279 | 0.297788948720997 |
| 7 | 9.3 | 9.25050867390534 | 0.0494913260946615 |
| 8 | 9.3 | 9.13273540679292 | 0.167264593207078 |
| 9 | 8.7 | 8.72246526764408 | -0.0224652676440766 |
| 10 | 8.2 | 8.09151228014294 | 0.108487719857062 |
| 11 | 8.3 | 8.186978875778 | 0.113021124222003 |
| 12 | 8.5 | 8.71342343324491 | -0.213423433244914 |
| 13 | 8.6 | 8.71462893300156 | -0.114628933001559 |
| 14 | 8.5 | 8.597680550532 | -0.097680550532003 |
| 15 | 8.2 | 8.36119510548206 | -0.161195105482055 |
| 16 | 8.1 | 7.97023095485812 | 0.129769045141880 |
| 17 | 7.9 | 8.10671364797438 | -0.206713647974380 |
| 18 | 8.6 | 8.55056202256192 | 0.0494379774380806 |
| 19 | 8.7 | 8.6993453963835 | 0.000654603616493099 |
| 20 | 8.7 | 8.68184433608461 | 0.0181556639153870 |
| 21 | 8.5 | 8.59516565440873 | -0.0951656544087262 |
| 22 | 8.4 | 8.3191065094754 | 0.080893490524606 |
| 23 | 8.5 | 8.47915963592063 | 0.0208403640793728 |
| 24 | 8.7 | 8.7322520634431 | -0.0322520634431003 |
| 25 | 8.7 | 8.6704669444717 | 0.0295330555283018 |
| 26 | 8.6 | 8.57521355464941 | 0.0247864453505907 |
| 27 | 8.5 | 8.3760939794229 | 0.123906020577099 |
| 28 | 8.3 | 8.26374754849768 | 0.0362524515023253 |
| 29 | 8 | 8.11911914451816 | -0.119119144518163 |
| 30 | 8.2 | 8.466643916085 | -0.266643916085004 |
| 31 | 8.1 | 7.91861345296165 | 0.181386547038345 |
| 32 | 8.1 | 7.91070645381536 | 0.189293546184643 |
| 33 | 8 | 8.03619228185078 | -0.0361922818507823 |
| 34 | 7.9 | 7.929143680442 | -0.0291436804420043 |
| 35 | 7.9 | 7.96833025266424 | -0.0683302526642403 |
| 36 | 8 | 7.89607360922806 | 0.103926390771938 |
| 37 | 8 | 7.87471084132157 | 0.125289158678432 |
| 38 | 7.9 | 7.87398244681427 | 0.0260175531857289 |
| 39 | 8 | 7.65569457583127 | 0.344305424168731 |
| 40 | 7.7 | 7.84492335205796 | -0.144923352057959 |
| 41 | 7.2 | 7.41839102276844 | -0.218391022768442 |
| 42 | 7.5 | 7.48428505140723 | 0.0157149485927650 |
| 43 | 7.3 | 7.43373503767901 | -0.133735037679008 |
| 44 | 7 | 7.2294504394152 | -0.229450439415200 |
| 45 | 7 | 6.83691050190271 | 0.163089498097291 |
| 46 | 7 | 7.10770152817295 | -0.107701528172952 |
| 47 | 7.2 | 7.20658543244014 | -0.00658543244013645 |
| 48 | 7.3 | 7.37279579439085 | -0.0727957943908475 |
| 49 | 7.1 | 7.12925592176717 | -0.0292559217671732 |
| 50 | 6.8 | 6.8217889909769 | -0.0217889909768962 |
| 51 | 6.4 | 6.5846827841252 | -0.184682784125192 |
| 52 | 6.1 | 6.27287141314891 | -0.172871413148915 |
| 53 | 6.5 | 6.29466900516647 | 0.205330994833533 |
| 54 | 7.7 | 7.6667119087697 | 0.033288091230301 |
| 55 | 7.9 | 8.06242590932003 | -0.162425909320034 |
| 56 | 7.5 | 7.61474366719418 | -0.11474366719418 |
| 57 | 6.9 | 6.90926629419371 | -0.009266294193706 |
| 58 | 6.6 | 6.65253600176671 | -0.0525360017667118 |
| 59 | 6.9 | 6.958945803197 | -0.0589458031969987 |
| 60 | 7.7 | 7.48545509969308 | 0.214544900306925 |
| 61 | 8 | 8.06317522192752 | -0.0631752219275241 |
| 62 | 8 | 7.82673825760564 | 0.173261742394358 |
| 63 | 7.7 | 7.57527538992297 | 0.124724610077028 |
| 64 | 7.3 | 7.28533270695943 | 0.0146672930405738 |
| 65 | 7.4 | 7.11410440379493 | 0.285895596205067 |
| 66 | 8.1 | 8.22958604989714 | -0.12958604989714 |
| 67 | 8.3 | 8.23537152975046 | 0.0646284702495425 |
| 68 | 8.2 | 8.23051969669773 | -0.0305196966977268 |
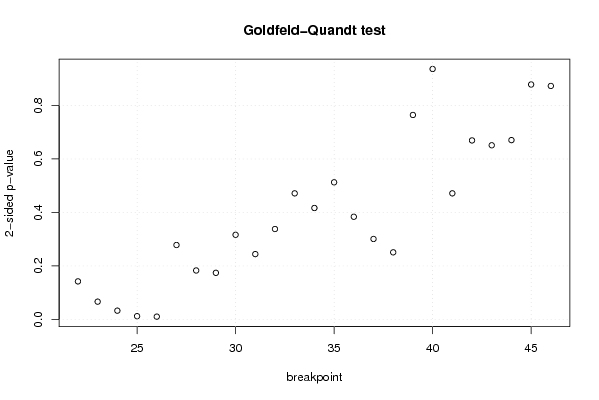
| Goldfeld-Quandt test for Heteroskedasticity | |||
| p-values | Alternative Hypothesis | ||
| breakpoint index | greater | 2-sided | less |
| 22 | 0.071080176356782 | 0.142160352713564 | 0.928919823643218 |
| 23 | 0.0331918658114294 | 0.0663837316228588 | 0.96680813418857 |
| 24 | 0.0163363979757382 | 0.0326727959514764 | 0.983663602024262 |
| 25 | 0.00605337929270302 | 0.0121067585854060 | 0.993946620707297 |
| 26 | 0.00514048473153522 | 0.0102809694630704 | 0.994859515268465 |
| 27 | 0.139111179960755 | 0.278222359921509 | 0.860888820039245 |
| 28 | 0.0914821074073654 | 0.182964214814731 | 0.908517892592635 |
| 29 | 0.087107570229665 | 0.17421514045933 | 0.912892429770335 |
| 30 | 0.158212515208783 | 0.316425030417566 | 0.841787484791217 |
| 31 | 0.122116623791342 | 0.244233247582684 | 0.877883376208658 |
| 32 | 0.169047755432358 | 0.338095510864716 | 0.830952244567642 |
| 33 | 0.235731315757121 | 0.471462631514243 | 0.764268684242879 |
| 34 | 0.20833474723282 | 0.41666949446564 | 0.79166525276718 |
| 35 | 0.256393032532873 | 0.512786065065746 | 0.743606967467127 |
| 36 | 0.191962711413402 | 0.383925422826805 | 0.808037288586598 |
| 37 | 0.150430187494302 | 0.300860374988604 | 0.849569812505698 |
| 38 | 0.125460807334195 | 0.250921614668390 | 0.874539192665805 |
| 39 | 0.382323427862769 | 0.764646855725537 | 0.617676572137231 |
| 40 | 0.468394709634720 | 0.936789419269441 | 0.53160529036528 |
| 41 | 0.764225821282755 | 0.47154835743449 | 0.235774178717245 |
| 42 | 0.665277535684001 | 0.669444928631998 | 0.334722464315999 |
| 43 | 0.674366110165412 | 0.651267779669176 | 0.325633889834588 |
| 44 | 0.664693881669431 | 0.670612236661138 | 0.335306118330569 |
| 45 | 0.560692153242982 | 0.878615693514035 | 0.439307846757018 |
| 46 | 0.436604016129902 | 0.873208032259803 | 0.563395983870098 |
| Meta Analysis of Goldfeld-Quandt test for Heteroskedasticity | |||
| Description | # significant tests | % significant tests | OK/NOK |
| 1% type I error level | 0 | 0 | OK |
| 5% type I error level | 3 | 0.12 | NOK |
| 10% type I error level | 4 | 0.16 | NOK |