| Multiple Linear Regression - Estimated Regression Equation |
| werkl[t] = + 27.862457704015 -0.189544972149105afzetp[t] -0.178728142494257M1[t] -0.558499469364017M2[t] -0.734643384638138M3[t] -0.603597881853048M4[t] -0.260241974005832M5[t] -0.230938975862558M6[t] -0.366886066158616M7[t] -0.666886066158615M8[t] -0.889325572657158M9[t] -0.926689241180551M10[t] -0.164052909703943M11[t] + e[t] |
| Multiple Linear Regression - Ordinary Least Squares | |||||
| Variable | Parameter | S.D. | T-STAT H0: parameter = 0 | 2-tail p-value | 1-tail p-value |
| (Intercept) | 27.862457704015 | 2.113952 | 13.1803 | 0 | 0 |
| afzetp | -0.189544972149105 | 0.020372 | -9.3041 | 0 | 0 |
| M1 | -0.178728142494257 | 0.247576 | -0.7219 | 0.473153 | 0.236576 |
| M2 | -0.558499469364017 | 0.257729 | -2.167 | 0.034215 | 0.017108 |
| M3 | -0.734643384638138 | 0.25782 | -2.8494 | 0.005993 | 0.002996 |
| M4 | -0.603597881853048 | 0.258013 | -2.3394 | 0.022661 | 0.01133 |
| M5 | -0.260241974005832 | 0.257456 | -1.0108 | 0.316161 | 0.158081 |
| M6 | -0.230938975862558 | 0.257359 | -0.8973 | 0.373124 | 0.186562 |
| M7 | -0.366886066158616 | 0.25706 | -1.4272 | 0.158695 | 0.079348 |
| M8 | -0.666886066158615 | 0.25706 | -2.5943 | 0.011895 | 0.005948 |
| M9 | -0.889325572657158 | 0.256872 | -3.4621 | 0.000994 | 0.000497 |
| M10 | -0.926689241180551 | 0.256834 | -3.6081 | 0.00063 | 0.000315 |
| M11 | -0.164052909703943 | 0.256804 | -0.6388 | 0.525367 | 0.262684 |
| Multiple Linear Regression - Regression Statistics | |
| Multiple R | 0.811643807977646 |
| R-squared | 0.658765671028454 |
| Adjusted R-squared | 0.590518805234145 |
| F-TEST (value) | 9.65268753899884 |
| F-TEST (DF numerator) | 12 |
| F-TEST (DF denominator) | 60 |
| p-value | 4.30271707152485e-10 |
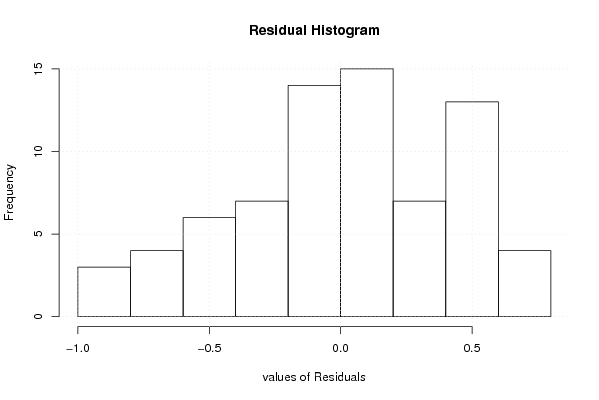
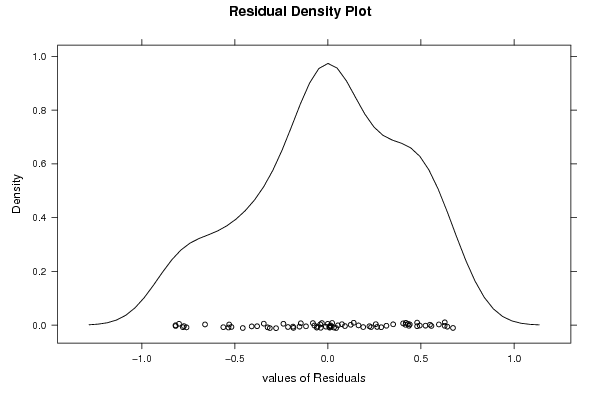
| Multiple Linear Regression - Residual Statistics | |
| Residual Standard Deviation | 0.444709263038103 |
| Sum Squared Residuals | 11.8659797179136 |
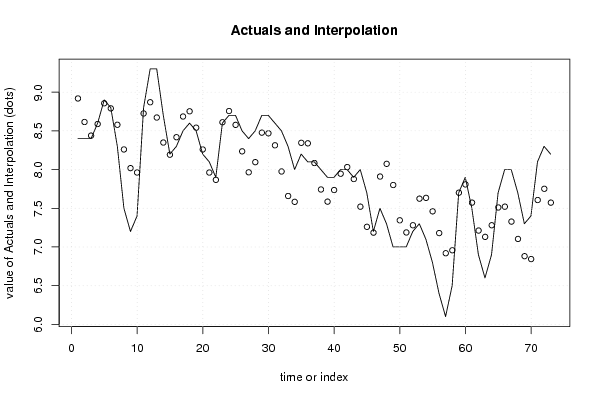
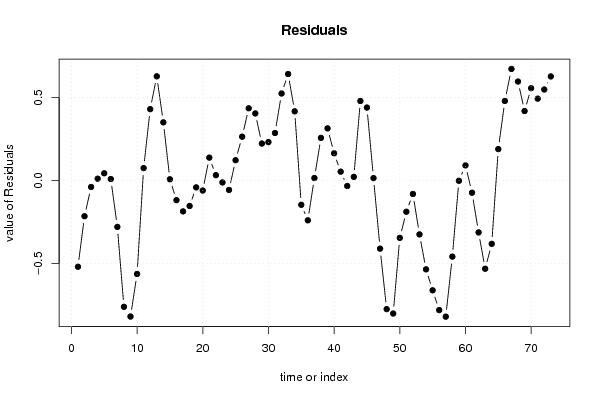
| Multiple Linear Regression - Actuals, Interpolation, and Residuals | |||
| Time or Index | Actuals | Interpolation Forecast | Residuals Prediction Error |
| 1 | 8.4 | 8.91877731875937 | -0.518777318759372 |
| 2 | 8.4 | 8.6148239807492 | -0.214823980749204 |
| 3 | 8.4 | 8.43868006547508 | -0.0386800654750822 |
| 4 | 8.6 | 8.58868006547508 | 0.0113199345249173 |
| 5 | 8.9 | 8.85621798446266 | 0.0437820155373440 |
| 6 | 8.8 | 8.79074849653137 | 0.00925150346862508 |
| 7 | 8.3 | 8.57898341737568 | -0.278983417375678 |
| 8 | 7.5 | 8.26002892016077 | -0.760028920160768 |
| 9 | 7.2 | 8.01863491644731 | -0.818634916447314 |
| 10 | 7.4 | 7.96231675070901 | -0.562316750709013 |
| 11 | 8.8 | 8.72495308218562 | 0.0750469178143812 |
| 12 | 9.3 | 8.87005149467465 | 0.429948505325351 |
| 13 | 9.3 | 8.67236885496549 | 0.627631145034516 |
| 14 | 8.7 | 8.34946101974046 | 0.350538980259543 |
| 15 | 8.2 | 8.19227160168124 | 0.00772839831875522 |
| 16 | 8.3 | 8.41808959054089 | -0.118089590540886 |
| 17 | 8.5 | 8.68562750952846 | -0.185627509528463 |
| 18 | 8.6 | 8.75283950210156 | -0.152839502101558 |
| 19 | 8.5 | 8.54107442294586 | -0.0410744229458577 |
| 20 | 8.2 | 8.26002892016077 | -0.0600289201607676 |
| 21 | 8.1 | 7.96177142480258 | 0.138228575197415 |
| 22 | 7.9 | 7.86754426463446 | 0.0324557353655402 |
| 23 | 8.6 | 8.61122609889616 | -0.0112260988961556 |
| 24 | 8.7 | 8.75632451138519 | -0.0563245113851899 |
| 25 | 8.7 | 8.57759636889093 | 0.122403631109067 |
| 26 | 8.5 | 8.235734036451 | 0.264265963549006 |
| 27 | 8.4 | 7.96481763510232 | 0.435182364897681 |
| 28 | 8.5 | 8.0958631378874 | 0.40413686211259 |
| 29 | 8.7 | 8.47712804016444 | 0.222871959835554 |
| 30 | 8.7 | 8.4685220438779 | 0.231477956122100 |
| 31 | 8.6 | 8.31362045636693 | 0.286379543633068 |
| 32 | 8.5 | 7.97571146193711 | 0.524288538062891 |
| 33 | 8.3 | 7.65849946936401 | 0.641500530635986 |
| 34 | 8 | 7.5832268064108 | 0.416773193589198 |
| 35 | 8.2 | 8.3458631378874 | -0.145863137887410 |
| 36 | 8.1 | 8.33932557265716 | -0.239325572657158 |
| 37 | 8.1 | 8.08477944130326 | 0.015220558696742 |
| 38 | 8 | 7.74291710886332 | 0.257082891136680 |
| 39 | 7.9 | 7.58572769080411 | 0.314272309195890 |
| 40 | 7.9 | 7.73572769080411 | 0.164272309195891 |
| 41 | 8 | 7.94640211814695 | 0.0535978818530483 |
| 42 | 8 | 8.03256860793496 | -0.0325686079349559 |
| 43 | 7.9 | 7.87766702042399 | 0.0223329795760104 |
| 44 | 8 | 7.52080352877926 | 0.479196471220741 |
| 45 | 7.7 | 7.2604550278509 | 0.439544972149105 |
| 46 | 7.2 | 7.18518236489768 | 0.0148176351023201 |
| 47 | 7.5 | 7.90990970194447 | -0.409909701944466 |
| 48 | 7.3 | 8.0739626116484 | -0.773962611648409 |
| 49 | 7 | 7.8004619830796 | -0.8004619830796 |
| 50 | 7 | 7.3448726673502 | -0.3448726673502 |
| 51 | 7 | 7.18768324929099 | -0.187683249290987 |
| 52 | 7.2 | 7.28081975764626 | -0.0808197576462561 |
| 53 | 7.3 | 7.62417566549347 | -0.324175665493473 |
| 54 | 7.1 | 7.63452416642184 | -0.534524166421837 |
| 55 | 6.8 | 7.46066808169596 | -0.660668081695958 |
| 56 | 6.4 | 7.17962257891087 | -0.77962257891087 |
| 57 | 6.1 | 6.9192740779825 | -0.819274077982507 |
| 58 | 6.5 | 6.95772839831875 | -0.457728398318754 |
| 59 | 7.7 | 7.70141023258045 | -0.00141023258045101 |
| 60 | 7.9 | 7.80859965063966 | 0.0914003493603366 |
| 61 | 7.5 | 7.57300801650068 | -0.073008016500676 |
| 62 | 6.9 | 7.21219118684583 | -0.312191186845826 |
| 63 | 6.6 | 7.13081975764626 | -0.530819757646257 |
| 64 | 6.9 | 7.28081975764626 | -0.380819757646256 |
| 65 | 7.7 | 7.51044868220401 | 0.189551317795990 |
| 66 | 8 | 7.52079718313237 | 0.479202816867626 |
| 67 | 8 | 7.32798660119158 | 0.672013398808416 |
| 68 | 7.7 | 7.10380459005123 | 0.596195409948773 |
| 69 | 7.3 | 6.88136508355268 | 0.418634916447315 |
| 70 | 7.4 | 6.84400141502929 | 0.555998584970708 |
| 71 | 8.1 | 7.6066377465059 | 0.493362253494101 |
| 72 | 8.3 | 7.75173615899493 | 0.548263841005068 |
| 73 | 8.2 | 7.57300801650068 | 0.626991983499324 |
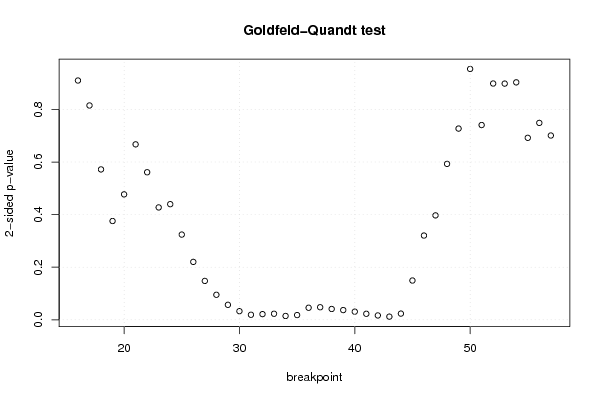
| Goldfeld-Quandt test for Heteroskedasticity | |||
| p-values | Alternative Hypothesis | ||
| breakpoint index | greater | 2-sided | less |
| 16 | 0.455070840551577 | 0.910141681103154 | 0.544929159448423 |
| 17 | 0.407600087532378 | 0.815200175064756 | 0.592399912467622 |
| 18 | 0.285990130023005 | 0.57198026004601 | 0.714009869976995 |
| 19 | 0.187834774270815 | 0.375669548541630 | 0.812165225729185 |
| 20 | 0.238518006125678 | 0.477036012251356 | 0.761481993874322 |
| 21 | 0.333649669404469 | 0.667299338808938 | 0.666350330595531 |
| 22 | 0.280598059746178 | 0.561196119492357 | 0.719401940253822 |
| 23 | 0.21367804341037 | 0.42735608682074 | 0.78632195658963 |
| 24 | 0.219912812593181 | 0.439825625186362 | 0.780087187406819 |
| 25 | 0.162045409423105 | 0.32409081884621 | 0.837954590576895 |
| 26 | 0.110119988153509 | 0.220239976307018 | 0.889880011846491 |
| 27 | 0.073895203418545 | 0.14779040683709 | 0.926104796581455 |
| 28 | 0.047569423942351 | 0.095138847884702 | 0.952430576057649 |
| 29 | 0.0284577423503733 | 0.0569154847007466 | 0.971542257649627 |
| 30 | 0.0163731757960353 | 0.0327463515920705 | 0.983626824203965 |
| 31 | 0.00954880911841636 | 0.0190976182368327 | 0.990451190881584 |
| 32 | 0.0107471582575501 | 0.0214943165151002 | 0.98925284174245 |
| 33 | 0.0114717928680272 | 0.0229435857360545 | 0.988528207131973 |
| 34 | 0.00727577892695357 | 0.0145515578539071 | 0.992724221073046 |
| 35 | 0.00900158258446219 | 0.0180031651689244 | 0.990998417415538 |
| 36 | 0.0229023211939820 | 0.0458046423879640 | 0.977097678806018 |
| 37 | 0.0238662328888059 | 0.0477324657776117 | 0.976133767111194 |
| 38 | 0.0205485971019279 | 0.0410971942038559 | 0.979451402898072 |
| 39 | 0.0184585063846128 | 0.0369170127692255 | 0.981541493615387 |
| 40 | 0.0154600038102840 | 0.0309200076205679 | 0.984539996189716 |
| 41 | 0.0114097046905800 | 0.0228194093811601 | 0.98859029530942 |
| 42 | 0.00826681199603015 | 0.0165336239920603 | 0.99173318800397 |
| 43 | 0.0059650225422706 | 0.0119300450845412 | 0.99403497745773 |
| 44 | 0.0117502531708912 | 0.0235005063417825 | 0.988249746829109 |
| 45 | 0.0746545595400973 | 0.149309119080195 | 0.925345440459903 |
| 46 | 0.160198427677807 | 0.320396855355615 | 0.839801572322193 |
| 47 | 0.198597880299571 | 0.397195760599142 | 0.801402119700429 |
| 48 | 0.296482073356868 | 0.592964146713737 | 0.703517926643132 |
| 49 | 0.363679356816687 | 0.727358713633374 | 0.636320643183313 |
| 50 | 0.522944172065068 | 0.954111655869865 | 0.477055827934932 |
| 51 | 0.629651513457192 | 0.740696973085616 | 0.370348486542808 |
| 52 | 0.550661878165937 | 0.898676243668126 | 0.449338121834063 |
| 53 | 0.550801336602287 | 0.898397326795426 | 0.449198663397713 |
| 54 | 0.451564363430038 | 0.903128726860076 | 0.548435636569962 |
| 55 | 0.346067125246831 | 0.692134250493663 | 0.653932874753169 |
| 56 | 0.374453597684712 | 0.748907195369425 | 0.625546402315288 |
| 57 | 0.649561992855417 | 0.700876014289166 | 0.350438007144583 |
| Meta Analysis of Goldfeld-Quandt test for Heteroskedasticity | |||
| Description | # significant tests | % significant tests | OK/NOK |
| 1% type I error level | 0 | 0 | OK |
| 5% type I error level | 15 | 0.357142857142857 | NOK |
| 10% type I error level | 17 | 0.404761904761905 | NOK |