| Multiple Linear Regression - Estimated Regression Equation |
| werkloosheid[t] = + 0.59572539246056 -3.94502235891268indicator[t] + 0.9968486769921economie[t] + 1.06507538235466`finaciën`[t] + 0.880345457337178spaarvermogen[t] + e[t] |
| Multiple Linear Regression - Ordinary Least Squares | |||||
| Variable | Parameter | S.D. | T-STAT H0: parameter = 0 | 2-tail p-value | 1-tail p-value |
| (Intercept) | 0.59572539246056 | 0.456224 | 1.3058 | 0.197065 | 0.098532 |
| indicator | -3.94502235891268 | 0.030602 | -128.9139 | 0 | 0 |
| economie | 0.9968486769921 | 0.022312 | 44.6775 | 0 | 0 |
| `finaciën` | 1.06507538235466 | 0.12733 | 8.3647 | 0 | 0 |
| spaarvermogen | 0.880345457337178 | 0.059472 | 14.8027 | 0 | 0 |
| Multiple Linear Regression - Regression Statistics | |
| Multiple R | 0.998682644366743 |
| R-squared | 0.99736702415935 |
| Adjusted R-squared | 0.997175535007303 |
| F-TEST (value) | 5208.47793985421 |
| F-TEST (DF numerator) | 4 |
| F-TEST (DF denominator) | 55 |
| p-value | 0 |
| Multiple Linear Regression - Residual Statistics | |
| Residual Standard Deviation | 1.23256411359052 |
| Sum Squared Residuals | 83.5567861761153 |
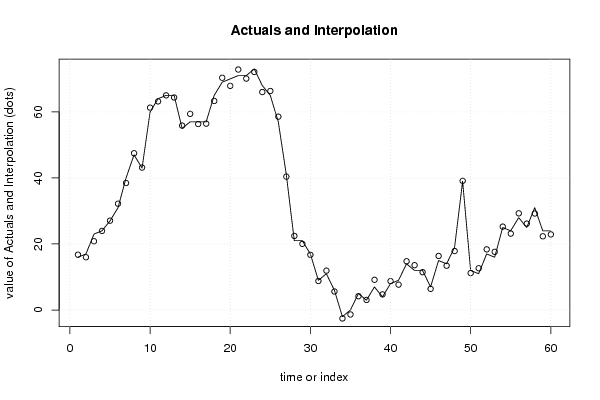
| Multiple Linear Regression - Actuals, Interpolation, and Residuals | |||
| Time or Index | Actuals | Interpolation Forecast | Residuals Prediction Error |
| 1 | 16 | 16.7583888852851 | -0.758388885285125 |
| 2 | 17 | 15.9827383171297 | 1.01726168287027 |
| 3 | 23 | 20.8339604896864 | 2.16603951031357 |
| 4 | 24 | 23.9528180707909 | 0.0471819292090527 |
| 5 | 27 | 27.0598673214222 | -0.0598673214221827 |
| 6 | 31 | 32.1982766128177 | -1.19827661281774 |
| 7 | 40 | 38.460680041084 | 1.53931995891598 |
| 8 | 47 | 47.4758849860297 | -0.475884986029709 |
| 9 | 43 | 43.1411899017453 | -0.141189901745318 |
| 10 | 60 | 61.286936921042 | -1.28693692104203 |
| 11 | 64 | 63.1759393858446 | 0.82406061415541 |
| 12 | 65 | 65.0048570058815 | -0.00485700588150435 |
| 13 | 65 | 64.3575179878542 | 0.642482012145825 |
| 14 | 55 | 55.8506982705839 | -0.850698270583905 |
| 15 | 57 | 59.4038386214761 | -2.4038386214761 |
| 16 | 57 | 56.3192115288304 | 0.680788471169607 |
| 17 | 57 | 56.4357147484853 | 0.564285251514684 |
| 18 | 65 | 63.3042509359728 | 1.69574906402718 |
| 19 | 69 | 70.3279962222946 | -1.32799622229456 |
| 20 | 70 | 67.8775939405372 | 2.12240605946285 |
| 21 | 71 | 72.8312733069152 | -1.83127330691523 |
| 22 | 71 | 70.0821382601122 | 0.917861739887776 |
| 23 | 73 | 72.0957858051666 | 0.904214194833377 |
| 24 | 68 | 66.0029001858347 | 1.99709981416532 |
| 25 | 65 | 66.3336541566903 | -1.33365415669032 |
| 26 | 57 | 58.5542084932832 | -1.55420849328322 |
| 27 | 41 | 40.4050576883767 | 0.594942311623332 |
| 28 | 21 | 22.4428745038479 | -1.44287450384786 |
| 29 | 21 | 20.0466529016195 | 0.953347098380537 |
| 30 | 17 | 16.7184055421517 | 0.28159445784831 |
| 31 | 9 | 8.80841063325611 | 0.191589366743885 |
| 32 | 11 | 11.9236017444842 | -0.923601744484246 |
| 33 | 6 | 5.6129218019256 | 0.387078198074401 |
| 34 | -2 | -2.54188787675311 | 0.541887876753107 |
| 35 | 0 | -1.34035908367333 | 1.34035908367333 |
| 36 | 5 | 4.19243259536952 | 0.807567404630477 |
| 37 | 3 | 3.06727236824921 | -0.067272368249206 |
| 38 | 7 | 9.16015798758115 | -2.16015798758115 |
| 39 | 4 | 4.74202408185106 | -0.742024081851062 |
| 40 | 8 | 8.7552731461263 | -0.755273146126306 |
| 41 | 9 | 7.69019776377165 | 1.30980223622835 |
| 42 | 14 | 14.7787375571346 | -0.778737557134626 |
| 43 | 12 | 13.5853506246518 | -1.58535062465175 |
| 44 | 12 | 11.469245885776 | 0.530754114224019 |
| 45 | 7 | 6.42017958106277 | 0.579820418937235 |
| 46 | 15 | 16.3746487378617 | -1.37464873786169 |
| 47 | 14 | 13.4205708907045 | 0.579429109295531 |
| 48 | 19 | 17.8574604845437 | 1.14253951545631 |
| 49 | 39 | 39.1220650849449 | -0.122065084944903 |
| 50 | 12 | 11.1972708830203 | 0.802729116979733 |
| 51 | 11 | 12.6508244877856 | -1.65082448778557 |
| 52 | 17 | 18.3742502570825 | -1.37425025708254 |
| 53 | 16 | 17.6303582104705 | -1.63035821047048 |
| 54 | 25 | 25.2556379674425 | -0.255637967442515 |
| 55 | 24 | 23.1454373938034 | 0.854562606196609 |
| 56 | 28 | 29.2865995274277 | -1.2865995274277 |
| 57 | 25 | 26.1677419463232 | -1.16774194632318 |
| 58 | 31 | 29.2324188478987 | 1.76758115210131 |
| 59 | 24 | 22.3333186418288 | 1.66668135817123 |
| 60 | 24 | 22.9065267892569 | 1.0934732107431 |
| Goldfeld-Quandt test for Heteroskedasticity | |||
| p-values | Alternative Hypothesis | ||
| breakpoint index | greater | 2-sided | less |
| 8 | 0.00139581978660337 | 0.00279163957320674 | 0.998604180213397 |
| 9 | 0.0110730367183872 | 0.0221460734367743 | 0.988926963281613 |
| 10 | 0.0428564707246797 | 0.0857129414493594 | 0.95714352927532 |
| 11 | 0.298110046580894 | 0.596220093161788 | 0.701889953419106 |
| 12 | 0.196650813946822 | 0.393301627893645 | 0.803349186053178 |
| 13 | 0.156252385408925 | 0.31250477081785 | 0.843747614591075 |
| 14 | 0.111256292522323 | 0.222512585044645 | 0.888743707477677 |
| 15 | 0.467775068305249 | 0.935550136610499 | 0.532224931694751 |
| 16 | 0.444820369783773 | 0.889640739567546 | 0.555179630216227 |
| 17 | 0.385648076041866 | 0.771296152083732 | 0.614351923958134 |
| 18 | 0.478667531613046 | 0.957335063226092 | 0.521332468386954 |
| 19 | 0.440307615047069 | 0.880615230094138 | 0.559692384952931 |
| 20 | 0.650862167753021 | 0.698275664493958 | 0.349137832246979 |
| 21 | 0.748599495786612 | 0.502801008426775 | 0.251400504213388 |
| 22 | 0.691811395609513 | 0.616377208780974 | 0.308188604390487 |
| 23 | 0.62657405863984 | 0.746851882720321 | 0.37342594136016 |
| 24 | 0.712169023883214 | 0.575661952233572 | 0.287830976116786 |
| 25 | 0.742381158222039 | 0.515237683555923 | 0.257618841777961 |
| 26 | 0.764993307649475 | 0.470013384701049 | 0.235006692350524 |
| 27 | 0.72484298192719 | 0.550314036145621 | 0.27515701807281 |
| 28 | 0.794232070796536 | 0.411535858406929 | 0.205767929203464 |
| 29 | 0.77782454733281 | 0.444350905334381 | 0.22217545266719 |
| 30 | 0.718140799187504 | 0.563718401624992 | 0.281859200812496 |
| 31 | 0.684678079836789 | 0.630643840326421 | 0.315321920163211 |
| 32 | 0.638944749803544 | 0.722110500392912 | 0.361055250196456 |
| 33 | 0.584218990219321 | 0.831562019561358 | 0.415781009780679 |
| 34 | 0.569725935398716 | 0.860548129202568 | 0.430274064601284 |
| 35 | 0.559757808493413 | 0.880484383013174 | 0.440242191506587 |
| 36 | 0.659910976105238 | 0.680178047789524 | 0.340089023894762 |
| 37 | 0.632606053228215 | 0.73478789354357 | 0.367393946771785 |
| 38 | 0.674208427691289 | 0.651583144617422 | 0.325791572308711 |
| 39 | 0.609183498950494 | 0.781633002099012 | 0.390816501049506 |
| 40 | 0.588802260780143 | 0.822395478439714 | 0.411197739219857 |
| 41 | 0.711572882272582 | 0.576854235454836 | 0.288427117727418 |
| 42 | 0.667785589697011 | 0.664428820605978 | 0.332214410302989 |
| 43 | 0.633160447748526 | 0.733679104502947 | 0.366839552251474 |
| 44 | 0.585321344727905 | 0.82935731054419 | 0.414678655272095 |
| 45 | 0.568905641527201 | 0.862188716945598 | 0.431094358472799 |
| 46 | 0.485782593986516 | 0.971565187973033 | 0.514217406013484 |
| 47 | 0.473899680505433 | 0.947799361010867 | 0.526100319494567 |
| 48 | 0.405367680376904 | 0.810735360753807 | 0.594632319623096 |
| 49 | 0.337056668196691 | 0.674113336393381 | 0.66294333180331 |
| 50 | 0.432612821320772 | 0.865225642641544 | 0.567387178679228 |
| 51 | 0.361542924754275 | 0.723085849508549 | 0.638457075245725 |
| 52 | 0.349680075158762 | 0.699360150317523 | 0.650319924841238 |
| Meta Analysis of Goldfeld-Quandt test for Heteroskedasticity | |||
| Description | # significant tests | % significant tests | OK/NOK |
| 1% type I error level | 1 | 0.0222222222222222 | NOK |
| 5% type I error level | 2 | 0.0444444444444444 | OK |
| 10% type I error level | 3 | 0.0666666666666667 | OK |