Free Statistics

of Irreproducible Research!

Author's title

Author*The author of this computation has been verified*
R Software Modulerwasp_autocorrelation.wasp
Title produced by software(Partial) Autocorrelation Function
Date of computationWed, 29 Dec 2010 19:49:25 +0000
Cite this page as followsStatistical Computations at FreeStatistics.org, Office for Research Development and Education, URL https://freestatistics.org/blog/index.php?v=date/2010/Dec/29/t1293652037swj21cglr2yozl0.htm/, Retrieved Fri, 03 May 2024 10:35:33 +0000
Statistical Computations at FreeStatistics.org, Office for Research Development and Education, URL https://freestatistics.org/blog/index.php?pk=117069, Retrieved Fri, 03 May 2024 10:35:33 +0000
QR Codes:

Original text written by user:
IsPrivate?No (this computation is public)
User-defined keywords
Estimated Impact103
Family? (F = Feedback message, R = changed R code, M = changed R Module, P = changed Parameters, D = changed Data)
-     [(Partial) Autocorrelation Function] [Autocorrelatie] [2010-12-26 11:32:25] [c4f608d390ad7371b1365a9b84541edb]
-         [(Partial) Autocorrelation Function] [Autocorrelation] [2010-12-29 19:49:25] [d7e71f84f972bd09532f49e6d8781449] [Current]
Feedback Forum

Post a new message
Dataseries X:
16198.90
16554.20
19554.20
15903.80
18003.80
18329.60
16260.70
14851.90
18174.10
18406.60
18466.50
16016.50
17428.50
17167.20
19630.00
17183.60
18344.70
19301.40
18147.50
16192.90
18374.40
20515.20
18957.20
16471.50
18746.80
19009.50
19211.20
20547.70
19325.80
20605.50
20056.90
16141.40
20359.80
19711.60
15638.60
14384.50
13721.40
14134.30
15021.70
14212.60
13635.00
15446.90
14762.10
12521.00
16236.80
16065.00
16032.10
15794.30
15160.00
15692.10
18908.90
17424.50
17014.20
19790.40
17681.20
16006.90
19601.70


Summary of computational transaction
Raw Inputview raw input (R code)
Raw Outputview raw output of R engine
Computing time2 seconds
R Server'Gwilym Jenkins' @ www.wessa.org

\begin{tabular}{lllllllll}
\hline
Summary of computational transaction \tabularnewline
Raw Input & view raw input (R code)  \tabularnewline
Raw Output & view raw output of R engine  \tabularnewline
Computing time & 2 seconds \tabularnewline
R Server & 'Gwilym Jenkins' @ www.wessa.org \tabularnewline
\hline
\end{tabular}
%Source: https://freestatistics.org/blog/index.php?pk=117069&T=0

[TABLE]
[ROW][C]Summary of computational transaction[/C][/ROW]
[ROW][C]Raw Input[/C][C]view raw input (R code) [/C][/ROW]
[ROW][C]Raw Output[/C][C]view raw output of R engine [/C][/ROW]
[ROW][C]Computing time[/C][C]2 seconds[/C][/ROW]
[ROW][C]R Server[/C][C]'Gwilym Jenkins' @ www.wessa.org[/C][/ROW]
[/TABLE]
Source: https://freestatistics.org/blog/index.php?pk=117069&T=0

Globally Unique Identifier (entire table): ba.freestatistics.org/blog/index.php?pk=117069&T=0

As an alternative you can also use a QR Code:  

The GUIDs for individual cells are displayed in the table below:

Summary of computational transaction
Raw Inputview raw input (R code)
Raw Outputview raw output of R engine
Computing time2 seconds
R Server'Gwilym Jenkins' @ www.wessa.org


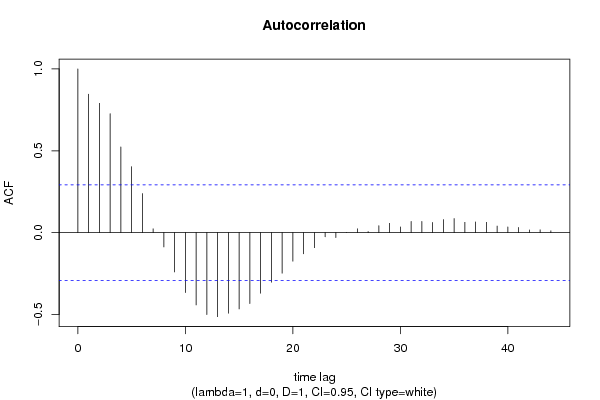
Autocorrelation Function
Time lag kACF(k)T-STATP-value
10.846155.67610
20.7900515.29982e-06
30.7267534.87527e-06
40.5234843.51160.000513
50.4025362.70030.004864
60.2385771.60040.058251
70.0233680.15680.438068
8-0.087652-0.5880.279741
9-0.24011-1.61070.057119
10-0.36673-2.46010.008898
11-0.442218-2.96650.002404
12-0.500995-3.36080.000796
13-0.513656-3.44570.000622
14-0.492758-3.30550.000934
15-0.466606-3.13010.001533
16-0.434039-2.91160.002788
17-0.370522-2.48550.008359
18-0.302841-2.03150.024067
19-0.248033-1.66390.051545
20-0.174608-1.17130.123821
21-0.130029-0.87230.193849
22-0.0923-0.61920.269463
23-0.025673-0.17220.432018
24-0.030544-0.20490.419288
25-0.000171-0.00110.499544
260.0229590.1540.439143
270.0067150.0450.482136
280.0421370.28270.389365
290.0566330.37990.3529
300.0348740.23390.408046
310.0678950.45550.325487
320.0684680.45930.324115
330.0620530.41630.339598
340.0798330.53550.297458
350.0856780.57470.284164
360.0631850.42390.336844
370.0653880.43860.331512
380.0626150.420.33823
390.0396180.26580.395818
400.034370.23060.409349
410.0316070.2120.416523
420.0164110.11010.456415
430.0170880.11460.454626
440.011040.07410.470646
45NANANA
46NANANA
47NANANA
48NANANA
49NANANA
50NANANA
51NANANA
52NANANA
53NANANA
54NANANA
55NANANA
56NANANA
57NANANA
58NANANA
59NANANA
60NANANA

\begin{tabular}{lllllllll}
\hline
Autocorrelation Function \tabularnewline
Time lag k & ACF(k) & T-STAT & P-value \tabularnewline
1 & 0.84615 & 5.6761 & 0 \tabularnewline
2 & 0.790051 & 5.2998 & 2e-06 \tabularnewline
3 & 0.726753 & 4.8752 & 7e-06 \tabularnewline
4 & 0.523484 & 3.5116 & 0.000513 \tabularnewline
5 & 0.402536 & 2.7003 & 0.004864 \tabularnewline
6 & 0.238577 & 1.6004 & 0.058251 \tabularnewline
7 & 0.023368 & 0.1568 & 0.438068 \tabularnewline
8 & -0.087652 & -0.588 & 0.279741 \tabularnewline
9 & -0.24011 & -1.6107 & 0.057119 \tabularnewline
10 & -0.36673 & -2.4601 & 0.008898 \tabularnewline
11 & -0.442218 & -2.9665 & 0.002404 \tabularnewline
12 & -0.500995 & -3.3608 & 0.000796 \tabularnewline
13 & -0.513656 & -3.4457 & 0.000622 \tabularnewline
14 & -0.492758 & -3.3055 & 0.000934 \tabularnewline
15 & -0.466606 & -3.1301 & 0.001533 \tabularnewline
16 & -0.434039 & -2.9116 & 0.002788 \tabularnewline
17 & -0.370522 & -2.4855 & 0.008359 \tabularnewline
18 & -0.302841 & -2.0315 & 0.024067 \tabularnewline
19 & -0.248033 & -1.6639 & 0.051545 \tabularnewline
20 & -0.174608 & -1.1713 & 0.123821 \tabularnewline
21 & -0.130029 & -0.8723 & 0.193849 \tabularnewline
22 & -0.0923 & -0.6192 & 0.269463 \tabularnewline
23 & -0.025673 & -0.1722 & 0.432018 \tabularnewline
24 & -0.030544 & -0.2049 & 0.419288 \tabularnewline
25 & -0.000171 & -0.0011 & 0.499544 \tabularnewline
26 & 0.022959 & 0.154 & 0.439143 \tabularnewline
27 & 0.006715 & 0.045 & 0.482136 \tabularnewline
28 & 0.042137 & 0.2827 & 0.389365 \tabularnewline
29 & 0.056633 & 0.3799 & 0.3529 \tabularnewline
30 & 0.034874 & 0.2339 & 0.408046 \tabularnewline
31 & 0.067895 & 0.4555 & 0.325487 \tabularnewline
32 & 0.068468 & 0.4593 & 0.324115 \tabularnewline
33 & 0.062053 & 0.4163 & 0.339598 \tabularnewline
34 & 0.079833 & 0.5355 & 0.297458 \tabularnewline
35 & 0.085678 & 0.5747 & 0.284164 \tabularnewline
36 & 0.063185 & 0.4239 & 0.336844 \tabularnewline
37 & 0.065388 & 0.4386 & 0.331512 \tabularnewline
38 & 0.062615 & 0.42 & 0.33823 \tabularnewline
39 & 0.039618 & 0.2658 & 0.395818 \tabularnewline
40 & 0.03437 & 0.2306 & 0.409349 \tabularnewline
41 & 0.031607 & 0.212 & 0.416523 \tabularnewline
42 & 0.016411 & 0.1101 & 0.456415 \tabularnewline
43 & 0.017088 & 0.1146 & 0.454626 \tabularnewline
44 & 0.01104 & 0.0741 & 0.470646 \tabularnewline
45 & NA & NA & NA \tabularnewline
46 & NA & NA & NA \tabularnewline
47 & NA & NA & NA \tabularnewline
48 & NA & NA & NA \tabularnewline
49 & NA & NA & NA \tabularnewline
50 & NA & NA & NA \tabularnewline
51 & NA & NA & NA \tabularnewline
52 & NA & NA & NA \tabularnewline
53 & NA & NA & NA \tabularnewline
54 & NA & NA & NA \tabularnewline
55 & NA & NA & NA \tabularnewline
56 & NA & NA & NA \tabularnewline
57 & NA & NA & NA \tabularnewline
58 & NA & NA & NA \tabularnewline
59 & NA & NA & NA \tabularnewline
60 & NA & NA & NA \tabularnewline
\hline
\end{tabular}
%Source: https://freestatistics.org/blog/index.php?pk=117069&T=1

[TABLE]
[ROW][C]Autocorrelation Function[/C][/ROW]
[ROW][C]Time lag k[/C][C]ACF(k)[/C][C]T-STAT[/C][C]P-value[/C][/ROW]
[ROW][C]1[/C][C]0.84615[/C][C]5.6761[/C][C]0[/C][/ROW]
[ROW][C]2[/C][C]0.790051[/C][C]5.2998[/C][C]2e-06[/C][/ROW]
[ROW][C]3[/C][C]0.726753[/C][C]4.8752[/C][C]7e-06[/C][/ROW]
[ROW][C]4[/C][C]0.523484[/C][C]3.5116[/C][C]0.000513[/C][/ROW]
[ROW][C]5[/C][C]0.402536[/C][C]2.7003[/C][C]0.004864[/C][/ROW]
[ROW][C]6[/C][C]0.238577[/C][C]1.6004[/C][C]0.058251[/C][/ROW]
[ROW][C]7[/C][C]0.023368[/C][C]0.1568[/C][C]0.438068[/C][/ROW]
[ROW][C]8[/C][C]-0.087652[/C][C]-0.588[/C][C]0.279741[/C][/ROW]
[ROW][C]9[/C][C]-0.24011[/C][C]-1.6107[/C][C]0.057119[/C][/ROW]
[ROW][C]10[/C][C]-0.36673[/C][C]-2.4601[/C][C]0.008898[/C][/ROW]
[ROW][C]11[/C][C]-0.442218[/C][C]-2.9665[/C][C]0.002404[/C][/ROW]
[ROW][C]12[/C][C]-0.500995[/C][C]-3.3608[/C][C]0.000796[/C][/ROW]
[ROW][C]13[/C][C]-0.513656[/C][C]-3.4457[/C][C]0.000622[/C][/ROW]
[ROW][C]14[/C][C]-0.492758[/C][C]-3.3055[/C][C]0.000934[/C][/ROW]
[ROW][C]15[/C][C]-0.466606[/C][C]-3.1301[/C][C]0.001533[/C][/ROW]
[ROW][C]16[/C][C]-0.434039[/C][C]-2.9116[/C][C]0.002788[/C][/ROW]
[ROW][C]17[/C][C]-0.370522[/C][C]-2.4855[/C][C]0.008359[/C][/ROW]
[ROW][C]18[/C][C]-0.302841[/C][C]-2.0315[/C][C]0.024067[/C][/ROW]
[ROW][C]19[/C][C]-0.248033[/C][C]-1.6639[/C][C]0.051545[/C][/ROW]
[ROW][C]20[/C][C]-0.174608[/C][C]-1.1713[/C][C]0.123821[/C][/ROW]
[ROW][C]21[/C][C]-0.130029[/C][C]-0.8723[/C][C]0.193849[/C][/ROW]
[ROW][C]22[/C][C]-0.0923[/C][C]-0.6192[/C][C]0.269463[/C][/ROW]
[ROW][C]23[/C][C]-0.025673[/C][C]-0.1722[/C][C]0.432018[/C][/ROW]
[ROW][C]24[/C][C]-0.030544[/C][C]-0.2049[/C][C]0.419288[/C][/ROW]
[ROW][C]25[/C][C]-0.000171[/C][C]-0.0011[/C][C]0.499544[/C][/ROW]
[ROW][C]26[/C][C]0.022959[/C][C]0.154[/C][C]0.439143[/C][/ROW]
[ROW][C]27[/C][C]0.006715[/C][C]0.045[/C][C]0.482136[/C][/ROW]
[ROW][C]28[/C][C]0.042137[/C][C]0.2827[/C][C]0.389365[/C][/ROW]
[ROW][C]29[/C][C]0.056633[/C][C]0.3799[/C][C]0.3529[/C][/ROW]
[ROW][C]30[/C][C]0.034874[/C][C]0.2339[/C][C]0.408046[/C][/ROW]
[ROW][C]31[/C][C]0.067895[/C][C]0.4555[/C][C]0.325487[/C][/ROW]
[ROW][C]32[/C][C]0.068468[/C][C]0.4593[/C][C]0.324115[/C][/ROW]
[ROW][C]33[/C][C]0.062053[/C][C]0.4163[/C][C]0.339598[/C][/ROW]
[ROW][C]34[/C][C]0.079833[/C][C]0.5355[/C][C]0.297458[/C][/ROW]
[ROW][C]35[/C][C]0.085678[/C][C]0.5747[/C][C]0.284164[/C][/ROW]
[ROW][C]36[/C][C]0.063185[/C][C]0.4239[/C][C]0.336844[/C][/ROW]
[ROW][C]37[/C][C]0.065388[/C][C]0.4386[/C][C]0.331512[/C][/ROW]
[ROW][C]38[/C][C]0.062615[/C][C]0.42[/C][C]0.33823[/C][/ROW]
[ROW][C]39[/C][C]0.039618[/C][C]0.2658[/C][C]0.395818[/C][/ROW]
[ROW][C]40[/C][C]0.03437[/C][C]0.2306[/C][C]0.409349[/C][/ROW]
[ROW][C]41[/C][C]0.031607[/C][C]0.212[/C][C]0.416523[/C][/ROW]
[ROW][C]42[/C][C]0.016411[/C][C]0.1101[/C][C]0.456415[/C][/ROW]
[ROW][C]43[/C][C]0.017088[/C][C]0.1146[/C][C]0.454626[/C][/ROW]
[ROW][C]44[/C][C]0.01104[/C][C]0.0741[/C][C]0.470646[/C][/ROW]
[ROW][C]45[/C][C]NA[/C][C]NA[/C][C]NA[/C][/ROW]
[ROW][C]46[/C][C]NA[/C][C]NA[/C][C]NA[/C][/ROW]
[ROW][C]47[/C][C]NA[/C][C]NA[/C][C]NA[/C][/ROW]
[ROW][C]48[/C][C]NA[/C][C]NA[/C][C]NA[/C][/ROW]
[ROW][C]49[/C][C]NA[/C][C]NA[/C][C]NA[/C][/ROW]
[ROW][C]50[/C][C]NA[/C][C]NA[/C][C]NA[/C][/ROW]
[ROW][C]51[/C][C]NA[/C][C]NA[/C][C]NA[/C][/ROW]
[ROW][C]52[/C][C]NA[/C][C]NA[/C][C]NA[/C][/ROW]
[ROW][C]53[/C][C]NA[/C][C]NA[/C][C]NA[/C][/ROW]
[ROW][C]54[/C][C]NA[/C][C]NA[/C][C]NA[/C][/ROW]
[ROW][C]55[/C][C]NA[/C][C]NA[/C][C]NA[/C][/ROW]
[ROW][C]56[/C][C]NA[/C][C]NA[/C][C]NA[/C][/ROW]
[ROW][C]57[/C][C]NA[/C][C]NA[/C][C]NA[/C][/ROW]
[ROW][C]58[/C][C]NA[/C][C]NA[/C][C]NA[/C][/ROW]
[ROW][C]59[/C][C]NA[/C][C]NA[/C][C]NA[/C][/ROW]
[ROW][C]60[/C][C]NA[/C][C]NA[/C][C]NA[/C][/ROW]
[/TABLE]
Source: https://freestatistics.org/blog/index.php?pk=117069&T=1

Globally Unique Identifier (entire table): ba.freestatistics.org/blog/index.php?pk=117069&T=1

As an alternative you can also use a QR Code:  

The GUIDs for individual cells are displayed in the table below:

Autocorrelation Function
Time lag kACF(k)T-STATP-value
10.846155.67610
20.7900515.29982e-06
30.7267534.87527e-06
40.5234843.51160.000513
50.4025362.70030.004864
60.2385771.60040.058251
70.0233680.15680.438068
8-0.087652-0.5880.279741
9-0.24011-1.61070.057119
10-0.36673-2.46010.008898
11-0.442218-2.96650.002404
12-0.500995-3.36080.000796
13-0.513656-3.44570.000622
14-0.492758-3.30550.000934
15-0.466606-3.13010.001533
16-0.434039-2.91160.002788
17-0.370522-2.48550.008359
18-0.302841-2.03150.024067
19-0.248033-1.66390.051545
20-0.174608-1.17130.123821
21-0.130029-0.87230.193849
22-0.0923-0.61920.269463
23-0.025673-0.17220.432018
24-0.030544-0.20490.419288
25-0.000171-0.00110.499544
260.0229590.1540.439143
270.0067150.0450.482136
280.0421370.28270.389365
290.0566330.37990.3529
300.0348740.23390.408046
310.0678950.45550.325487
320.0684680.45930.324115
330.0620530.41630.339598
340.0798330.53550.297458
350.0856780.57470.284164
360.0631850.42390.336844
370.0653880.43860.331512
380.0626150.420.33823
390.0396180.26580.395818
400.034370.23060.409349
410.0316070.2120.416523
420.0164110.11010.456415
430.0170880.11460.454626
440.011040.07410.470646
45NANANA
46NANANA
47NANANA
48NANANA
49NANANA
50NANANA
51NANANA
52NANANA
53NANANA
54NANANA
55NANANA
56NANANA
57NANANA
58NANANA
59NANANA
60NANANA


Partial Autocorrelation Function
Time lag kPACF(k)T-STATP-value
10.846155.67610
20.2608221.74960.043498
30.045020.3020.382022
4-0.546779-3.66790.000322
5-0.168405-1.12970.132295
6-0.190826-1.28010.103535
7-0.222761-1.49430.071035
80.0662270.44430.32949
90.0275880.18510.427004
100.0667690.44790.328188
11-0.119499-0.80160.213492
120.0809830.54320.29482
130.0745150.49990.309804
140.0527850.35410.362462
15-0.065774-0.44120.330581
16-0.264218-1.77240.041547
17-0.140762-0.94430.175039
18-0.069739-0.46780.321085
190.0089090.05980.476303
200.0458570.30760.379897
21-0.052665-0.35330.36276
22-0.084221-0.5650.28745
230.0519040.34820.364662
24-0.108962-0.73090.234302
250.0687210.4610.323512
26-0.043205-0.28980.386641
27-0.065536-0.43960.331154
28-0.030002-0.20130.420701
290.054090.36280.359208
30-0.040202-0.26970.394318
31-0.060076-0.4030.344427
32-0.034284-0.230.409572
33-0.100382-0.67340.252075
34-0.075162-0.50420.30829
350.0789330.52950.299531
36-0.103781-0.69620.244947
37-0.116682-0.78270.218943
38-0.011759-0.07890.468739
390.0674690.45260.326507
400.0484590.32510.373317
410.0534790.35870.360731
420.0331350.22230.412553
43-0.142286-0.95450.172469
44-0.114723-0.76960.222784
45NANANA
46NANANA
47NANANA
48NANANA
49NANANA
50NANANA
51NANANA
52NANANA
53NANANA
54NANANA
55NANANA
56NANANA
57NANANA
58NANANA
59NANANA
60NANANA

\begin{tabular}{lllllllll}
\hline
Partial Autocorrelation Function \tabularnewline
Time lag k & PACF(k) & T-STAT & P-value \tabularnewline
1 & 0.84615 & 5.6761 & 0 \tabularnewline
2 & 0.260822 & 1.7496 & 0.043498 \tabularnewline
3 & 0.04502 & 0.302 & 0.382022 \tabularnewline
4 & -0.546779 & -3.6679 & 0.000322 \tabularnewline
5 & -0.168405 & -1.1297 & 0.132295 \tabularnewline
6 & -0.190826 & -1.2801 & 0.103535 \tabularnewline
7 & -0.222761 & -1.4943 & 0.071035 \tabularnewline
8 & 0.066227 & 0.4443 & 0.32949 \tabularnewline
9 & 0.027588 & 0.1851 & 0.427004 \tabularnewline
10 & 0.066769 & 0.4479 & 0.328188 \tabularnewline
11 & -0.119499 & -0.8016 & 0.213492 \tabularnewline
12 & 0.080983 & 0.5432 & 0.29482 \tabularnewline
13 & 0.074515 & 0.4999 & 0.309804 \tabularnewline
14 & 0.052785 & 0.3541 & 0.362462 \tabularnewline
15 & -0.065774 & -0.4412 & 0.330581 \tabularnewline
16 & -0.264218 & -1.7724 & 0.041547 \tabularnewline
17 & -0.140762 & -0.9443 & 0.175039 \tabularnewline
18 & -0.069739 & -0.4678 & 0.321085 \tabularnewline
19 & 0.008909 & 0.0598 & 0.476303 \tabularnewline
20 & 0.045857 & 0.3076 & 0.379897 \tabularnewline
21 & -0.052665 & -0.3533 & 0.36276 \tabularnewline
22 & -0.084221 & -0.565 & 0.28745 \tabularnewline
23 & 0.051904 & 0.3482 & 0.364662 \tabularnewline
24 & -0.108962 & -0.7309 & 0.234302 \tabularnewline
25 & 0.068721 & 0.461 & 0.323512 \tabularnewline
26 & -0.043205 & -0.2898 & 0.386641 \tabularnewline
27 & -0.065536 & -0.4396 & 0.331154 \tabularnewline
28 & -0.030002 & -0.2013 & 0.420701 \tabularnewline
29 & 0.05409 & 0.3628 & 0.359208 \tabularnewline
30 & -0.040202 & -0.2697 & 0.394318 \tabularnewline
31 & -0.060076 & -0.403 & 0.344427 \tabularnewline
32 & -0.034284 & -0.23 & 0.409572 \tabularnewline
33 & -0.100382 & -0.6734 & 0.252075 \tabularnewline
34 & -0.075162 & -0.5042 & 0.30829 \tabularnewline
35 & 0.078933 & 0.5295 & 0.299531 \tabularnewline
36 & -0.103781 & -0.6962 & 0.244947 \tabularnewline
37 & -0.116682 & -0.7827 & 0.218943 \tabularnewline
38 & -0.011759 & -0.0789 & 0.468739 \tabularnewline
39 & 0.067469 & 0.4526 & 0.326507 \tabularnewline
40 & 0.048459 & 0.3251 & 0.373317 \tabularnewline
41 & 0.053479 & 0.3587 & 0.360731 \tabularnewline
42 & 0.033135 & 0.2223 & 0.412553 \tabularnewline
43 & -0.142286 & -0.9545 & 0.172469 \tabularnewline
44 & -0.114723 & -0.7696 & 0.222784 \tabularnewline
45 & NA & NA & NA \tabularnewline
46 & NA & NA & NA \tabularnewline
47 & NA & NA & NA \tabularnewline
48 & NA & NA & NA \tabularnewline
49 & NA & NA & NA \tabularnewline
50 & NA & NA & NA \tabularnewline
51 & NA & NA & NA \tabularnewline
52 & NA & NA & NA \tabularnewline
53 & NA & NA & NA \tabularnewline
54 & NA & NA & NA \tabularnewline
55 & NA & NA & NA \tabularnewline
56 & NA & NA & NA \tabularnewline
57 & NA & NA & NA \tabularnewline
58 & NA & NA & NA \tabularnewline
59 & NA & NA & NA \tabularnewline
60 & NA & NA & NA \tabularnewline
\hline
\end{tabular}
%Source: https://freestatistics.org/blog/index.php?pk=117069&T=2

[TABLE]
[ROW][C]Partial Autocorrelation Function[/C][/ROW]
[ROW][C]Time lag k[/C][C]PACF(k)[/C][C]T-STAT[/C][C]P-value[/C][/ROW]
[ROW][C]1[/C][C]0.84615[/C][C]5.6761[/C][C]0[/C][/ROW]
[ROW][C]2[/C][C]0.260822[/C][C]1.7496[/C][C]0.043498[/C][/ROW]
[ROW][C]3[/C][C]0.04502[/C][C]0.302[/C][C]0.382022[/C][/ROW]
[ROW][C]4[/C][C]-0.546779[/C][C]-3.6679[/C][C]0.000322[/C][/ROW]
[ROW][C]5[/C][C]-0.168405[/C][C]-1.1297[/C][C]0.132295[/C][/ROW]
[ROW][C]6[/C][C]-0.190826[/C][C]-1.2801[/C][C]0.103535[/C][/ROW]
[ROW][C]7[/C][C]-0.222761[/C][C]-1.4943[/C][C]0.071035[/C][/ROW]
[ROW][C]8[/C][C]0.066227[/C][C]0.4443[/C][C]0.32949[/C][/ROW]
[ROW][C]9[/C][C]0.027588[/C][C]0.1851[/C][C]0.427004[/C][/ROW]
[ROW][C]10[/C][C]0.066769[/C][C]0.4479[/C][C]0.328188[/C][/ROW]
[ROW][C]11[/C][C]-0.119499[/C][C]-0.8016[/C][C]0.213492[/C][/ROW]
[ROW][C]12[/C][C]0.080983[/C][C]0.5432[/C][C]0.29482[/C][/ROW]
[ROW][C]13[/C][C]0.074515[/C][C]0.4999[/C][C]0.309804[/C][/ROW]
[ROW][C]14[/C][C]0.052785[/C][C]0.3541[/C][C]0.362462[/C][/ROW]
[ROW][C]15[/C][C]-0.065774[/C][C]-0.4412[/C][C]0.330581[/C][/ROW]
[ROW][C]16[/C][C]-0.264218[/C][C]-1.7724[/C][C]0.041547[/C][/ROW]
[ROW][C]17[/C][C]-0.140762[/C][C]-0.9443[/C][C]0.175039[/C][/ROW]
[ROW][C]18[/C][C]-0.069739[/C][C]-0.4678[/C][C]0.321085[/C][/ROW]
[ROW][C]19[/C][C]0.008909[/C][C]0.0598[/C][C]0.476303[/C][/ROW]
[ROW][C]20[/C][C]0.045857[/C][C]0.3076[/C][C]0.379897[/C][/ROW]
[ROW][C]21[/C][C]-0.052665[/C][C]-0.3533[/C][C]0.36276[/C][/ROW]
[ROW][C]22[/C][C]-0.084221[/C][C]-0.565[/C][C]0.28745[/C][/ROW]
[ROW][C]23[/C][C]0.051904[/C][C]0.3482[/C][C]0.364662[/C][/ROW]
[ROW][C]24[/C][C]-0.108962[/C][C]-0.7309[/C][C]0.234302[/C][/ROW]
[ROW][C]25[/C][C]0.068721[/C][C]0.461[/C][C]0.323512[/C][/ROW]
[ROW][C]26[/C][C]-0.043205[/C][C]-0.2898[/C][C]0.386641[/C][/ROW]
[ROW][C]27[/C][C]-0.065536[/C][C]-0.4396[/C][C]0.331154[/C][/ROW]
[ROW][C]28[/C][C]-0.030002[/C][C]-0.2013[/C][C]0.420701[/C][/ROW]
[ROW][C]29[/C][C]0.05409[/C][C]0.3628[/C][C]0.359208[/C][/ROW]
[ROW][C]30[/C][C]-0.040202[/C][C]-0.2697[/C][C]0.394318[/C][/ROW]
[ROW][C]31[/C][C]-0.060076[/C][C]-0.403[/C][C]0.344427[/C][/ROW]
[ROW][C]32[/C][C]-0.034284[/C][C]-0.23[/C][C]0.409572[/C][/ROW]
[ROW][C]33[/C][C]-0.100382[/C][C]-0.6734[/C][C]0.252075[/C][/ROW]
[ROW][C]34[/C][C]-0.075162[/C][C]-0.5042[/C][C]0.30829[/C][/ROW]
[ROW][C]35[/C][C]0.078933[/C][C]0.5295[/C][C]0.299531[/C][/ROW]
[ROW][C]36[/C][C]-0.103781[/C][C]-0.6962[/C][C]0.244947[/C][/ROW]
[ROW][C]37[/C][C]-0.116682[/C][C]-0.7827[/C][C]0.218943[/C][/ROW]
[ROW][C]38[/C][C]-0.011759[/C][C]-0.0789[/C][C]0.468739[/C][/ROW]
[ROW][C]39[/C][C]0.067469[/C][C]0.4526[/C][C]0.326507[/C][/ROW]
[ROW][C]40[/C][C]0.048459[/C][C]0.3251[/C][C]0.373317[/C][/ROW]
[ROW][C]41[/C][C]0.053479[/C][C]0.3587[/C][C]0.360731[/C][/ROW]
[ROW][C]42[/C][C]0.033135[/C][C]0.2223[/C][C]0.412553[/C][/ROW]
[ROW][C]43[/C][C]-0.142286[/C][C]-0.9545[/C][C]0.172469[/C][/ROW]
[ROW][C]44[/C][C]-0.114723[/C][C]-0.7696[/C][C]0.222784[/C][/ROW]
[ROW][C]45[/C][C]NA[/C][C]NA[/C][C]NA[/C][/ROW]
[ROW][C]46[/C][C]NA[/C][C]NA[/C][C]NA[/C][/ROW]
[ROW][C]47[/C][C]NA[/C][C]NA[/C][C]NA[/C][/ROW]
[ROW][C]48[/C][C]NA[/C][C]NA[/C][C]NA[/C][/ROW]
[ROW][C]49[/C][C]NA[/C][C]NA[/C][C]NA[/C][/ROW]
[ROW][C]50[/C][C]NA[/C][C]NA[/C][C]NA[/C][/ROW]
[ROW][C]51[/C][C]NA[/C][C]NA[/C][C]NA[/C][/ROW]
[ROW][C]52[/C][C]NA[/C][C]NA[/C][C]NA[/C][/ROW]
[ROW][C]53[/C][C]NA[/C][C]NA[/C][C]NA[/C][/ROW]
[ROW][C]54[/C][C]NA[/C][C]NA[/C][C]NA[/C][/ROW]
[ROW][C]55[/C][C]NA[/C][C]NA[/C][C]NA[/C][/ROW]
[ROW][C]56[/C][C]NA[/C][C]NA[/C][C]NA[/C][/ROW]
[ROW][C]57[/C][C]NA[/C][C]NA[/C][C]NA[/C][/ROW]
[ROW][C]58[/C][C]NA[/C][C]NA[/C][C]NA[/C][/ROW]
[ROW][C]59[/C][C]NA[/C][C]NA[/C][C]NA[/C][/ROW]
[ROW][C]60[/C][C]NA[/C][C]NA[/C][C]NA[/C][/ROW]
[/TABLE]
Source: https://freestatistics.org/blog/index.php?pk=117069&T=2

Globally Unique Identifier (entire table): ba.freestatistics.org/blog/index.php?pk=117069&T=2

As an alternative you can also use a QR Code:  

The GUIDs for individual cells are displayed in the table below:

Partial Autocorrelation Function
Time lag kPACF(k)T-STATP-value
10.846155.67610
20.2608221.74960.043498
30.045020.3020.382022
4-0.546779-3.66790.000322
5-0.168405-1.12970.132295
6-0.190826-1.28010.103535
7-0.222761-1.49430.071035
80.0662270.44430.32949
90.0275880.18510.427004
100.0667690.44790.328188
11-0.119499-0.80160.213492
120.0809830.54320.29482
130.0745150.49990.309804
140.0527850.35410.362462
15-0.065774-0.44120.330581
16-0.264218-1.77240.041547
17-0.140762-0.94430.175039
18-0.069739-0.46780.321085
190.0089090.05980.476303
200.0458570.30760.379897
21-0.052665-0.35330.36276
22-0.084221-0.5650.28745
230.0519040.34820.364662
24-0.108962-0.73090.234302
250.0687210.4610.323512
26-0.043205-0.28980.386641
27-0.065536-0.43960.331154
28-0.030002-0.20130.420701
290.054090.36280.359208
30-0.040202-0.26970.394318
31-0.060076-0.4030.344427
32-0.034284-0.230.409572
33-0.100382-0.67340.252075
34-0.075162-0.50420.30829
350.0789330.52950.299531
36-0.103781-0.69620.244947
37-0.116682-0.78270.218943
38-0.011759-0.07890.468739
390.0674690.45260.326507
400.0484590.32510.373317
410.0534790.35870.360731
420.0331350.22230.412553
43-0.142286-0.95450.172469
44-0.114723-0.76960.222784
45NANANA
46NANANA
47NANANA
48NANANA
49NANANA
50NANANA
51NANANA
52NANANA
53NANANA
54NANANA
55NANANA
56NANANA
57NANANA
58NANANA
59NANANA
60NANANA


Parameters (Session):
par1 = 60 ; par2 = 1 ; par3 = 0 ; par4 = 1 ; par5 = 12 ; par6 = White Noise ; par7 = 0.95 ;
Parameters (R input):
par1 = 60 ; par2 = 1 ; par3 = 0 ; par4 = 1 ; par5 = 12 ; par6 = White Noise ; par7 = 0.95 ; par8 = ;
R code (references can be found in the software module):
if (par1 == 'Default') {
par1 = 10*log10(length(x))
} else {
par1 <- as.numeric(par1)
}
par2 <- as.numeric(par2)
par3 <- as.numeric(par3)
par4 <- as.numeric(par4)
par5 <- as.numeric(par5)
if (par6 == 'White Noise') par6 <- 'white' else par6 <- 'ma'
par7 <- as.numeric(par7)
if (par8 != '') par8 <- as.numeric(par8)
ox <- x
if (par8 == '') {
if (par2 == 0) {
x <- log(x)
} else {
x <- (x ^ par2 - 1) / par2
}
} else {
x <- log(x,base=par8)
}
if (par3 > 0) x <- diff(x,lag=1,difference=par3)
if (par4 > 0) x <- diff(x,lag=par5,difference=par4)
bitmap(file='picts.png')
op <- par(mfrow=c(2,1))
plot(ox,type='l',main='Original Time Series',xlab='time',ylab='value')
if (par8=='') {
mytitle <- paste('Working Time Series (lambda=',par2,', d=',par3,', D=',par4,')',sep='')
mysub <- paste('(lambda=',par2,', d=',par3,', D=',par4,', CI=', par7, ', CI type=',par6,')',sep='')
} else {
mytitle <- paste('Working Time Series (base=',par8,', d=',par3,', D=',par4,')',sep='')
mysub <- paste('(base=',par8,', d=',par3,', D=',par4,', CI=', par7, ', CI type=',par6,')',sep='')
}
plot(x,type='l', main=mytitle,xlab='time',ylab='value')
par(op)
dev.off()
bitmap(file='pic1.png')
racf <- acf(x, par1, main='Autocorrelation', xlab='time lag', ylab='ACF', ci.type=par6, ci=par7, sub=mysub)
dev.off()
bitmap(file='pic2.png')
rpacf <- pacf(x,par1,main='Partial Autocorrelation',xlab='lags',ylab='PACF',sub=mysub)
dev.off()
(myacf <- c(racf$acf))
(mypacf <- c(rpacf$acf))
lengthx <- length(x)
sqrtn <- sqrt(lengthx)
load(file='createtable')
a<-table.start()
a<-table.row.start(a)
a<-table.element(a,'Autocorrelation Function',4,TRUE)
a<-table.row.end(a)
a<-table.row.start(a)
a<-table.element(a,'Time lag k',header=TRUE)
a<-table.element(a,hyperlink('basics.htm','ACF(k)','click here for more information about the Autocorrelation Function'),header=TRUE)
a<-table.element(a,'T-STAT',header=TRUE)
a<-table.element(a,'P-value',header=TRUE)
a<-table.row.end(a)
for (i in 2:(par1+1)) {
a<-table.row.start(a)
a<-table.element(a,i-1,header=TRUE)
a<-table.element(a,round(myacf[i],6))
mytstat <- myacf[i]*sqrtn
a<-table.element(a,round(mytstat,4))
a<-table.element(a,round(1-pt(abs(mytstat),lengthx),6))
a<-table.row.end(a)
}
a<-table.end(a)
table.save(a,file='mytable.tab')
a<-table.start()
a<-table.row.start(a)
a<-table.element(a,'Partial Autocorrelation Function',4,TRUE)
a<-table.row.end(a)
a<-table.row.start(a)
a<-table.element(a,'Time lag k',header=TRUE)
a<-table.element(a,hyperlink('basics.htm','PACF(k)','click here for more information about the Partial Autocorrelation Function'),header=TRUE)
a<-table.element(a,'T-STAT',header=TRUE)
a<-table.element(a,'P-value',header=TRUE)
a<-table.row.end(a)
for (i in 1:par1) {
a<-table.row.start(a)
a<-table.element(a,i,header=TRUE)
a<-table.element(a,round(mypacf[i],6))
mytstat <- mypacf[i]*sqrtn
a<-table.element(a,round(mytstat,4))
a<-table.element(a,round(1-pt(abs(mytstat),lengthx),6))
a<-table.row.end(a)
}
a<-table.end(a)
table.save(a,file='mytable1.tab')