Free Statistics

of Irreproducible Research!

Author's title

Author*Unverified author*
R Software Modulerwasp_arimabackwardselection.wasp
Title produced by softwareARIMA Backward Selection
Date of computationWed, 29 Dec 2010 19:03:04 +0000
Cite this page as followsStatistical Computations at FreeStatistics.org, Office for Research Development and Education, URL https://freestatistics.org/blog/index.php?v=date/2010/Dec/29/t1293649304i3twzfy1pkdjt0p.htm/, Retrieved Fri, 03 May 2024 12:14:55 +0000
Statistical Computations at FreeStatistics.org, Office for Research Development and Education, URL https://freestatistics.org/blog/index.php?pk=117036, Retrieved Fri, 03 May 2024 12:14:55 +0000
QR Codes:

Original text written by user:
IsPrivate?No (this computation is public)
User-defined keywords
Estimated Impact99
Family? (F = Feedback message, R = changed R code, M = changed R Module, P = changed Parameters, D = changed Data)
-       [ARIMA Backward Selection] [Paper] [2010-12-29 19:03:04] [d5e0edb7e0239841e94676417b2a1e2e] [Current]
Feedback Forum

Post a new message
Dataseries X:
9782
9938
10111
10259
10419
10622
11173
11542
11538
11837
12060
12423
12791
12891
13098
13418
13614
13653
13980
14087
14332
14232
14226
14186
14310
14152
14127
14163
13964
13811
14440
14724
14790
14961
15117
15452
16080
16284
16524
16782
16663
16678
17448
17745
17789
17864
18079
18483
19037
19344
19590
19862
20207
20593
21253
21507
21528
21818
22205
22621
23006
23178
23358
23519
23725
23789
24472
24773
24477
24669
24827


Summary of computational transaction
Raw Inputview raw input (R code)
Raw Outputview raw output of R engine
Computing time11 seconds
R Server'Herman Ole Andreas Wold' @ www.yougetit.org

\begin{tabular}{lllllllll}
\hline
Summary of computational transaction \tabularnewline
Raw Input & view raw input (R code)  \tabularnewline
Raw Output & view raw output of R engine  \tabularnewline
Computing time & 11 seconds \tabularnewline
R Server & 'Herman Ole Andreas Wold' @ www.yougetit.org \tabularnewline
\hline
\end{tabular}
%Source: https://freestatistics.org/blog/index.php?pk=117036&T=0

[TABLE]
[ROW][C]Summary of computational transaction[/C][/ROW]
[ROW][C]Raw Input[/C][C]view raw input (R code) [/C][/ROW]
[ROW][C]Raw Output[/C][C]view raw output of R engine [/C][/ROW]
[ROW][C]Computing time[/C][C]11 seconds[/C][/ROW]
[ROW][C]R Server[/C][C]'Herman Ole Andreas Wold' @ www.yougetit.org[/C][/ROW]
[/TABLE]
Source: https://freestatistics.org/blog/index.php?pk=117036&T=0

Globally Unique Identifier (entire table): ba.freestatistics.org/blog/index.php?pk=117036&T=0

As an alternative you can also use a QR Code:  

The GUIDs for individual cells are displayed in the table below:

Summary of computational transaction
Raw Inputview raw input (R code)
Raw Outputview raw output of R engine
Computing time11 seconds
R Server'Herman Ole Andreas Wold' @ www.yougetit.org


ARIMA Parameter Estimation and Backward Selection
Iterationar1ar2ar3ma1sar1sar2sma1
Estimates ( 1 )0.9218-0.25410.2157-0.5351.0942-0.0948-0.9625
(p-val)(0 )(0.1436 )(0.0964 )(0.0054 )(0 )(0.5709 )(0 )
Estimates ( 2 )0.9408-0.27140.2214-0.55310.99370-0.8719
(p-val)(0 )(0.112 )(0.0859 )(0.0025 )(0 )(NA )(0 )
Estimates ( 3 )0.724600.1258-0.4380.99380-0.8665
(p-val)(0.0017 )(NA )(0.3487 )(0.1592 )(0 )(NA )(0 )
Estimates ( 4 )0.894800-0.61140.99160-0.8428
(p-val)(0 )(NA )(NA )(0 )(0 )(NA )(0 )
Estimates ( 5 )NANANANANANANA
(p-val)(NA )(NA )(NA )(NA )(NA )(NA )(NA )
Estimates ( 6 )NANANANANANANA
(p-val)(NA )(NA )(NA )(NA )(NA )(NA )(NA )
Estimates ( 7 )NANANANANANANA
(p-val)(NA )(NA )(NA )(NA )(NA )(NA )(NA )
Estimates ( 8 )NANANANANANANA
(p-val)(NA )(NA )(NA )(NA )(NA )(NA )(NA )
Estimates ( 9 )NANANANANANANA
(p-val)(NA )(NA )(NA )(NA )(NA )(NA )(NA )
Estimates ( 10 )NANANANANANANA
(p-val)(NA )(NA )(NA )(NA )(NA )(NA )(NA )
Estimates ( 11 )NANANANANANANA
(p-val)(NA )(NA )(NA )(NA )(NA )(NA )(NA )
Estimates ( 12 )NANANANANANANA
(p-val)(NA )(NA )(NA )(NA )(NA )(NA )(NA )
Estimates ( 13 )NANANANANANANA
(p-val)(NA )(NA )(NA )(NA )(NA )(NA )(NA )

\begin{tabular}{lllllllll}
\hline
ARIMA Parameter Estimation and Backward Selection \tabularnewline
Iteration & ar1 & ar2 & ar3 & ma1 & sar1 & sar2 & sma1 \tabularnewline
Estimates ( 1 ) & 0.9218 & -0.2541 & 0.2157 & -0.535 & 1.0942 & -0.0948 & -0.9625 \tabularnewline
(p-val) & (0 ) & (0.1436 ) & (0.0964 ) & (0.0054 ) & (0 ) & (0.5709 ) & (0 ) \tabularnewline
Estimates ( 2 ) & 0.9408 & -0.2714 & 0.2214 & -0.5531 & 0.9937 & 0 & -0.8719 \tabularnewline
(p-val) & (0 ) & (0.112 ) & (0.0859 ) & (0.0025 ) & (0 ) & (NA ) & (0 ) \tabularnewline
Estimates ( 3 ) & 0.7246 & 0 & 0.1258 & -0.438 & 0.9938 & 0 & -0.8665 \tabularnewline
(p-val) & (0.0017 ) & (NA ) & (0.3487 ) & (0.1592 ) & (0 ) & (NA ) & (0 ) \tabularnewline
Estimates ( 4 ) & 0.8948 & 0 & 0 & -0.6114 & 0.9916 & 0 & -0.8428 \tabularnewline
(p-val) & (0 ) & (NA ) & (NA ) & (0 ) & (0 ) & (NA ) & (0 ) \tabularnewline
Estimates ( 5 ) & NA & NA & NA & NA & NA & NA & NA \tabularnewline
(p-val) & (NA ) & (NA ) & (NA ) & (NA ) & (NA ) & (NA ) & (NA ) \tabularnewline
Estimates ( 6 ) & NA & NA & NA & NA & NA & NA & NA \tabularnewline
(p-val) & (NA ) & (NA ) & (NA ) & (NA ) & (NA ) & (NA ) & (NA ) \tabularnewline
Estimates ( 7 ) & NA & NA & NA & NA & NA & NA & NA \tabularnewline
(p-val) & (NA ) & (NA ) & (NA ) & (NA ) & (NA ) & (NA ) & (NA ) \tabularnewline
Estimates ( 8 ) & NA & NA & NA & NA & NA & NA & NA \tabularnewline
(p-val) & (NA ) & (NA ) & (NA ) & (NA ) & (NA ) & (NA ) & (NA ) \tabularnewline
Estimates ( 9 ) & NA & NA & NA & NA & NA & NA & NA \tabularnewline
(p-val) & (NA ) & (NA ) & (NA ) & (NA ) & (NA ) & (NA ) & (NA ) \tabularnewline
Estimates ( 10 ) & NA & NA & NA & NA & NA & NA & NA \tabularnewline
(p-val) & (NA ) & (NA ) & (NA ) & (NA ) & (NA ) & (NA ) & (NA ) \tabularnewline
Estimates ( 11 ) & NA & NA & NA & NA & NA & NA & NA \tabularnewline
(p-val) & (NA ) & (NA ) & (NA ) & (NA ) & (NA ) & (NA ) & (NA ) \tabularnewline
Estimates ( 12 ) & NA & NA & NA & NA & NA & NA & NA \tabularnewline
(p-val) & (NA ) & (NA ) & (NA ) & (NA ) & (NA ) & (NA ) & (NA ) \tabularnewline
Estimates ( 13 ) & NA & NA & NA & NA & NA & NA & NA \tabularnewline
(p-val) & (NA ) & (NA ) & (NA ) & (NA ) & (NA ) & (NA ) & (NA ) \tabularnewline
\hline
\end{tabular}
%Source: https://freestatistics.org/blog/index.php?pk=117036&T=1

[TABLE]
[ROW][C]ARIMA Parameter Estimation and Backward Selection[/C][/ROW]
[ROW][C]Iteration[/C][C]ar1[/C][C]ar2[/C][C]ar3[/C][C]ma1[/C][C]sar1[/C][C]sar2[/C][C]sma1[/C][/ROW]
[ROW][C]Estimates ( 1 )[/C][C]0.9218[/C][C]-0.2541[/C][C]0.2157[/C][C]-0.535[/C][C]1.0942[/C][C]-0.0948[/C][C]-0.9625[/C][/ROW]
[ROW][C](p-val)[/C][C](0 )[/C][C](0.1436 )[/C][C](0.0964 )[/C][C](0.0054 )[/C][C](0 )[/C][C](0.5709 )[/C][C](0 )[/C][/ROW]
[ROW][C]Estimates ( 2 )[/C][C]0.9408[/C][C]-0.2714[/C][C]0.2214[/C][C]-0.5531[/C][C]0.9937[/C][C]0[/C][C]-0.8719[/C][/ROW]
[ROW][C](p-val)[/C][C](0 )[/C][C](0.112 )[/C][C](0.0859 )[/C][C](0.0025 )[/C][C](0 )[/C][C](NA )[/C][C](0 )[/C][/ROW]
[ROW][C]Estimates ( 3 )[/C][C]0.7246[/C][C]0[/C][C]0.1258[/C][C]-0.438[/C][C]0.9938[/C][C]0[/C][C]-0.8665[/C][/ROW]
[ROW][C](p-val)[/C][C](0.0017 )[/C][C](NA )[/C][C](0.3487 )[/C][C](0.1592 )[/C][C](0 )[/C][C](NA )[/C][C](0 )[/C][/ROW]
[ROW][C]Estimates ( 4 )[/C][C]0.8948[/C][C]0[/C][C]0[/C][C]-0.6114[/C][C]0.9916[/C][C]0[/C][C]-0.8428[/C][/ROW]
[ROW][C](p-val)[/C][C](0 )[/C][C](NA )[/C][C](NA )[/C][C](0 )[/C][C](0 )[/C][C](NA )[/C][C](0 )[/C][/ROW]
[ROW][C]Estimates ( 5 )[/C][C]NA[/C][C]NA[/C][C]NA[/C][C]NA[/C][C]NA[/C][C]NA[/C][C]NA[/C][/ROW]
[ROW][C](p-val)[/C][C](NA )[/C][C](NA )[/C][C](NA )[/C][C](NA )[/C][C](NA )[/C][C](NA )[/C][C](NA )[/C][/ROW]
[ROW][C]Estimates ( 6 )[/C][C]NA[/C][C]NA[/C][C]NA[/C][C]NA[/C][C]NA[/C][C]NA[/C][C]NA[/C][/ROW]
[ROW][C](p-val)[/C][C](NA )[/C][C](NA )[/C][C](NA )[/C][C](NA )[/C][C](NA )[/C][C](NA )[/C][C](NA )[/C][/ROW]
[ROW][C]Estimates ( 7 )[/C][C]NA[/C][C]NA[/C][C]NA[/C][C]NA[/C][C]NA[/C][C]NA[/C][C]NA[/C][/ROW]
[ROW][C](p-val)[/C][C](NA )[/C][C](NA )[/C][C](NA )[/C][C](NA )[/C][C](NA )[/C][C](NA )[/C][C](NA )[/C][/ROW]
[ROW][C]Estimates ( 8 )[/C][C]NA[/C][C]NA[/C][C]NA[/C][C]NA[/C][C]NA[/C][C]NA[/C][C]NA[/C][/ROW]
[ROW][C](p-val)[/C][C](NA )[/C][C](NA )[/C][C](NA )[/C][C](NA )[/C][C](NA )[/C][C](NA )[/C][C](NA )[/C][/ROW]
[ROW][C]Estimates ( 9 )[/C][C]NA[/C][C]NA[/C][C]NA[/C][C]NA[/C][C]NA[/C][C]NA[/C][C]NA[/C][/ROW]
[ROW][C](p-val)[/C][C](NA )[/C][C](NA )[/C][C](NA )[/C][C](NA )[/C][C](NA )[/C][C](NA )[/C][C](NA )[/C][/ROW]
[ROW][C]Estimates ( 10 )[/C][C]NA[/C][C]NA[/C][C]NA[/C][C]NA[/C][C]NA[/C][C]NA[/C][C]NA[/C][/ROW]
[ROW][C](p-val)[/C][C](NA )[/C][C](NA )[/C][C](NA )[/C][C](NA )[/C][C](NA )[/C][C](NA )[/C][C](NA )[/C][/ROW]
[ROW][C]Estimates ( 11 )[/C][C]NA[/C][C]NA[/C][C]NA[/C][C]NA[/C][C]NA[/C][C]NA[/C][C]NA[/C][/ROW]
[ROW][C](p-val)[/C][C](NA )[/C][C](NA )[/C][C](NA )[/C][C](NA )[/C][C](NA )[/C][C](NA )[/C][C](NA )[/C][/ROW]
[ROW][C]Estimates ( 12 )[/C][C]NA[/C][C]NA[/C][C]NA[/C][C]NA[/C][C]NA[/C][C]NA[/C][C]NA[/C][/ROW]
[ROW][C](p-val)[/C][C](NA )[/C][C](NA )[/C][C](NA )[/C][C](NA )[/C][C](NA )[/C][C](NA )[/C][C](NA )[/C][/ROW]
[ROW][C]Estimates ( 13 )[/C][C]NA[/C][C]NA[/C][C]NA[/C][C]NA[/C][C]NA[/C][C]NA[/C][C]NA[/C][/ROW]
[ROW][C](p-val)[/C][C](NA )[/C][C](NA )[/C][C](NA )[/C][C](NA )[/C][C](NA )[/C][C](NA )[/C][C](NA )[/C][/ROW]
[/TABLE]
Source: https://freestatistics.org/blog/index.php?pk=117036&T=1

Globally Unique Identifier (entire table): ba.freestatistics.org/blog/index.php?pk=117036&T=1

As an alternative you can also use a QR Code:  

The GUIDs for individual cells are displayed in the table below:

ARIMA Parameter Estimation and Backward Selection
Iterationar1ar2ar3ma1sar1sar2sma1
Estimates ( 1 )0.9218-0.25410.2157-0.5351.0942-0.0948-0.9625
(p-val)(0 )(0.1436 )(0.0964 )(0.0054 )(0 )(0.5709 )(0 )
Estimates ( 2 )0.9408-0.27140.2214-0.55310.99370-0.8719
(p-val)(0 )(0.112 )(0.0859 )(0.0025 )(0 )(NA )(0 )
Estimates ( 3 )0.724600.1258-0.4380.99380-0.8665
(p-val)(0.0017 )(NA )(0.3487 )(0.1592 )(0 )(NA )(0 )
Estimates ( 4 )0.894800-0.61140.99160-0.8428
(p-val)(0 )(NA )(NA )(0 )(0 )(NA )(0 )
Estimates ( 5 )NANANANANANANA
(p-val)(NA )(NA )(NA )(NA )(NA )(NA )(NA )
Estimates ( 6 )NANANANANANANA
(p-val)(NA )(NA )(NA )(NA )(NA )(NA )(NA )
Estimates ( 7 )NANANANANANANA
(p-val)(NA )(NA )(NA )(NA )(NA )(NA )(NA )
Estimates ( 8 )NANANANANANANA
(p-val)(NA )(NA )(NA )(NA )(NA )(NA )(NA )
Estimates ( 9 )NANANANANANANA
(p-val)(NA )(NA )(NA )(NA )(NA )(NA )(NA )
Estimates ( 10 )NANANANANANANA
(p-val)(NA )(NA )(NA )(NA )(NA )(NA )(NA )
Estimates ( 11 )NANANANANANANA
(p-val)(NA )(NA )(NA )(NA )(NA )(NA )(NA )
Estimates ( 12 )NANANANANANANA
(p-val)(NA )(NA )(NA )(NA )(NA )(NA )(NA )
Estimates ( 13 )NANANANANANANA
(p-val)(NA )(NA )(NA )(NA )(NA )(NA )(NA )


Estimated ARIMA Residuals
Value
9.78198008433112
77.2970173212448
50.8666662358049
21.0524971784537
25.6484079434653
48.6791181412395
269.345295722701
80.8521667245227
-165.539158498036
73.068744742929
-1.09964640123293
125.68516791323
96.1977532884494
-98.0154393966773
18.3207820507893
116.379571742072
-8.10861357648774
-147.220474036072
-50.4776689000662
-128.226647744198
231.612862375596
-289.808843391234
-67.9987543741645
-195.308887020891
9.88340684400728
-138.366274545724
-20.1567410191485
-16.1932751259041
-190.177960778618
-69.5787674102214
408.62854527976
113.714978654897
-19.3236008266522
58.1485773171268
11.2649760279543
148.920519054005
308.400239219631
25.0606231440283
1.12494678461705
-32.050975886678
-267.176323581298
-33.9703795932856
304.689632793074
-7.3438451688113
-102.926329013586
-86.623772545878
71.8004278972441
166.438385861336
148.994913456813
127.954134388137
-24.5573667449223
-16.8680877929267
216.545340712892
193.475898556614
-25.9095444940763
-142.29469645534
-176.913097010979
126.202122389915
163.732620657264
74.2533383392611
-101.463950445483
-27.9280624796273
-47.2818390275224
-66.2801583388192
111.518755286302
-77.8908665643403
140.991365937297
1.17083053573795
-394.295917941613
117.174633737369
-19.8827303761295

\begin{tabular}{lllllllll}
\hline
Estimated ARIMA Residuals \tabularnewline
Value \tabularnewline
9.78198008433112 \tabularnewline
77.2970173212448 \tabularnewline
50.8666662358049 \tabularnewline
21.0524971784537 \tabularnewline
25.6484079434653 \tabularnewline
48.6791181412395 \tabularnewline
269.345295722701 \tabularnewline
80.8521667245227 \tabularnewline
-165.539158498036 \tabularnewline
73.068744742929 \tabularnewline
-1.09964640123293 \tabularnewline
125.68516791323 \tabularnewline
96.1977532884494 \tabularnewline
-98.0154393966773 \tabularnewline
18.3207820507893 \tabularnewline
116.379571742072 \tabularnewline
-8.10861357648774 \tabularnewline
-147.220474036072 \tabularnewline
-50.4776689000662 \tabularnewline
-128.226647744198 \tabularnewline
231.612862375596 \tabularnewline
-289.808843391234 \tabularnewline
-67.9987543741645 \tabularnewline
-195.308887020891 \tabularnewline
9.88340684400728 \tabularnewline
-138.366274545724 \tabularnewline
-20.1567410191485 \tabularnewline
-16.1932751259041 \tabularnewline
-190.177960778618 \tabularnewline
-69.5787674102214 \tabularnewline
408.62854527976 \tabularnewline
113.714978654897 \tabularnewline
-19.3236008266522 \tabularnewline
58.1485773171268 \tabularnewline
11.2649760279543 \tabularnewline
148.920519054005 \tabularnewline
308.400239219631 \tabularnewline
25.0606231440283 \tabularnewline
1.12494678461705 \tabularnewline
-32.050975886678 \tabularnewline
-267.176323581298 \tabularnewline
-33.9703795932856 \tabularnewline
304.689632793074 \tabularnewline
-7.3438451688113 \tabularnewline
-102.926329013586 \tabularnewline
-86.623772545878 \tabularnewline
71.8004278972441 \tabularnewline
166.438385861336 \tabularnewline
148.994913456813 \tabularnewline
127.954134388137 \tabularnewline
-24.5573667449223 \tabularnewline
-16.8680877929267 \tabularnewline
216.545340712892 \tabularnewline
193.475898556614 \tabularnewline
-25.9095444940763 \tabularnewline
-142.29469645534 \tabularnewline
-176.913097010979 \tabularnewline
126.202122389915 \tabularnewline
163.732620657264 \tabularnewline
74.2533383392611 \tabularnewline
-101.463950445483 \tabularnewline
-27.9280624796273 \tabularnewline
-47.2818390275224 \tabularnewline
-66.2801583388192 \tabularnewline
111.518755286302 \tabularnewline
-77.8908665643403 \tabularnewline
140.991365937297 \tabularnewline
1.17083053573795 \tabularnewline
-394.295917941613 \tabularnewline
117.174633737369 \tabularnewline
-19.8827303761295 \tabularnewline
\hline
\end{tabular}
%Source: https://freestatistics.org/blog/index.php?pk=117036&T=2

[TABLE]
[ROW][C]Estimated ARIMA Residuals[/C][/ROW]
[ROW][C]Value[/C][/ROW]
[ROW][C]9.78198008433112[/C][/ROW]
[ROW][C]77.2970173212448[/C][/ROW]
[ROW][C]50.8666662358049[/C][/ROW]
[ROW][C]21.0524971784537[/C][/ROW]
[ROW][C]25.6484079434653[/C][/ROW]
[ROW][C]48.6791181412395[/C][/ROW]
[ROW][C]269.345295722701[/C][/ROW]
[ROW][C]80.8521667245227[/C][/ROW]
[ROW][C]-165.539158498036[/C][/ROW]
[ROW][C]73.068744742929[/C][/ROW]
[ROW][C]-1.09964640123293[/C][/ROW]
[ROW][C]125.68516791323[/C][/ROW]
[ROW][C]96.1977532884494[/C][/ROW]
[ROW][C]-98.0154393966773[/C][/ROW]
[ROW][C]18.3207820507893[/C][/ROW]
[ROW][C]116.379571742072[/C][/ROW]
[ROW][C]-8.10861357648774[/C][/ROW]
[ROW][C]-147.220474036072[/C][/ROW]
[ROW][C]-50.4776689000662[/C][/ROW]
[ROW][C]-128.226647744198[/C][/ROW]
[ROW][C]231.612862375596[/C][/ROW]
[ROW][C]-289.808843391234[/C][/ROW]
[ROW][C]-67.9987543741645[/C][/ROW]
[ROW][C]-195.308887020891[/C][/ROW]
[ROW][C]9.88340684400728[/C][/ROW]
[ROW][C]-138.366274545724[/C][/ROW]
[ROW][C]-20.1567410191485[/C][/ROW]
[ROW][C]-16.1932751259041[/C][/ROW]
[ROW][C]-190.177960778618[/C][/ROW]
[ROW][C]-69.5787674102214[/C][/ROW]
[ROW][C]408.62854527976[/C][/ROW]
[ROW][C]113.714978654897[/C][/ROW]
[ROW][C]-19.3236008266522[/C][/ROW]
[ROW][C]58.1485773171268[/C][/ROW]
[ROW][C]11.2649760279543[/C][/ROW]
[ROW][C]148.920519054005[/C][/ROW]
[ROW][C]308.400239219631[/C][/ROW]
[ROW][C]25.0606231440283[/C][/ROW]
[ROW][C]1.12494678461705[/C][/ROW]
[ROW][C]-32.050975886678[/C][/ROW]
[ROW][C]-267.176323581298[/C][/ROW]
[ROW][C]-33.9703795932856[/C][/ROW]
[ROW][C]304.689632793074[/C][/ROW]
[ROW][C]-7.3438451688113[/C][/ROW]
[ROW][C]-102.926329013586[/C][/ROW]
[ROW][C]-86.623772545878[/C][/ROW]
[ROW][C]71.8004278972441[/C][/ROW]
[ROW][C]166.438385861336[/C][/ROW]
[ROW][C]148.994913456813[/C][/ROW]
[ROW][C]127.954134388137[/C][/ROW]
[ROW][C]-24.5573667449223[/C][/ROW]
[ROW][C]-16.8680877929267[/C][/ROW]
[ROW][C]216.545340712892[/C][/ROW]
[ROW][C]193.475898556614[/C][/ROW]
[ROW][C]-25.9095444940763[/C][/ROW]
[ROW][C]-142.29469645534[/C][/ROW]
[ROW][C]-176.913097010979[/C][/ROW]
[ROW][C]126.202122389915[/C][/ROW]
[ROW][C]163.732620657264[/C][/ROW]
[ROW][C]74.2533383392611[/C][/ROW]
[ROW][C]-101.463950445483[/C][/ROW]
[ROW][C]-27.9280624796273[/C][/ROW]
[ROW][C]-47.2818390275224[/C][/ROW]
[ROW][C]-66.2801583388192[/C][/ROW]
[ROW][C]111.518755286302[/C][/ROW]
[ROW][C]-77.8908665643403[/C][/ROW]
[ROW][C]140.991365937297[/C][/ROW]
[ROW][C]1.17083053573795[/C][/ROW]
[ROW][C]-394.295917941613[/C][/ROW]
[ROW][C]117.174633737369[/C][/ROW]
[ROW][C]-19.8827303761295[/C][/ROW]
[/TABLE]
Source: https://freestatistics.org/blog/index.php?pk=117036&T=2

Globally Unique Identifier (entire table): ba.freestatistics.org/blog/index.php?pk=117036&T=2

As an alternative you can also use a QR Code:  

The GUIDs for individual cells are displayed in the table below:

Estimated ARIMA Residuals
Value
9.78198008433112
77.2970173212448
50.8666662358049
21.0524971784537
25.6484079434653
48.6791181412395
269.345295722701
80.8521667245227
-165.539158498036
73.068744742929
-1.09964640123293
125.68516791323
96.1977532884494
-98.0154393966773
18.3207820507893
116.379571742072
-8.10861357648774
-147.220474036072
-50.4776689000662
-128.226647744198
231.612862375596
-289.808843391234
-67.9987543741645
-195.308887020891
9.88340684400728
-138.366274545724
-20.1567410191485
-16.1932751259041
-190.177960778618
-69.5787674102214
408.62854527976
113.714978654897
-19.3236008266522
58.1485773171268
11.2649760279543
148.920519054005
308.400239219631
25.0606231440283
1.12494678461705
-32.050975886678
-267.176323581298
-33.9703795932856
304.689632793074
-7.3438451688113
-102.926329013586
-86.623772545878
71.8004278972441
166.438385861336
148.994913456813
127.954134388137
-24.5573667449223
-16.8680877929267
216.545340712892
193.475898556614
-25.9095444940763
-142.29469645534
-176.913097010979
126.202122389915
163.732620657264
74.2533383392611
-101.463950445483
-27.9280624796273
-47.2818390275224
-66.2801583388192
111.518755286302
-77.8908665643403
140.991365937297
1.17083053573795
-394.295917941613
117.174633737369
-19.8827303761295


Parameters (Session):
par1 = 1 ; par2 = 1 ; par3 = 0 ; par4 = 12 ;
Parameters (R input):
par1 = FALSE ; par2 = 1 ; par3 = 1 ; par4 = 0 ; par5 = 12 ; par6 = 3 ; par7 = 1 ; par8 = 2 ; par9 = 1 ;
R code (references can be found in the software module):
library(lattice)
if (par1 == 'TRUE') par1 <- TRUE
if (par1 == 'FALSE') par1 <- FALSE
par2 <- as.numeric(par2) #Box-Cox lambda transformation parameter
par3 <- as.numeric(par3) #degree of non-seasonal differencing
par4 <- as.numeric(par4) #degree of seasonal differencing
par5 <- as.numeric(par5) #seasonal period
par6 <- as.numeric(par6) #degree (p) of the non-seasonal AR(p) polynomial
par7 <- as.numeric(par7) #degree (q) of the non-seasonal MA(q) polynomial
par8 <- as.numeric(par8) #degree (P) of the seasonal AR(P) polynomial
par9 <- as.numeric(par9) #degree (Q) of the seasonal MA(Q) polynomial
armaGR <- function(arima.out, names, n){
try1 <- arima.out$coef
try2 <- sqrt(diag(arima.out$var.coef))
try.data.frame <- data.frame(matrix(NA,ncol=4,nrow=length(names)))
dimnames(try.data.frame) <- list(names,c('coef','std','tstat','pv'))
try.data.frame[,1] <- try1
for(i in 1:length(try2)) try.data.frame[which(rownames(try.data.frame)==names(try2)[i]),2] <- try2[i]
try.data.frame[,3] <- try.data.frame[,1] / try.data.frame[,2]
try.data.frame[,4] <- round((1-pt(abs(try.data.frame[,3]),df=n-(length(try2)+1)))*2,5)
vector <- rep(NA,length(names))
vector[is.na(try.data.frame[,4])] <- 0
maxi <- which.max(try.data.frame[,4])
continue <- max(try.data.frame[,4],na.rm=TRUE) > .05
vector[maxi] <- 0
list(summary=try.data.frame,next.vector=vector,continue=continue)
}
arimaSelect <- function(series, order=c(13,0,0), seasonal=list(order=c(2,0,0),period=12), include.mean=F){
nrc <- order[1]+order[3]+seasonal$order[1]+seasonal$order[3]
coeff <- matrix(NA, nrow=nrc*2, ncol=nrc)
pval <- matrix(NA, nrow=nrc*2, ncol=nrc)
mylist <- rep(list(NULL), nrc)
names <- NULL
if(order[1] > 0) names <- paste('ar',1:order[1],sep='')
if(order[3] > 0) names <- c( names , paste('ma',1:order[3],sep='') )
if(seasonal$order[1] > 0) names <- c(names, paste('sar',1:seasonal$order[1],sep=''))
if(seasonal$order[3] > 0) names <- c(names, paste('sma',1:seasonal$order[3],sep=''))
arima.out <- arima(series, order=order, seasonal=seasonal, include.mean=include.mean, method='ML')
mylist[[1]] <- arima.out
last.arma <- armaGR(arima.out, names, length(series))
mystop <- FALSE
i <- 1
coeff[i,] <- last.arma[[1]][,1]
pval [i,] <- last.arma[[1]][,4]
i <- 2
aic <- arima.out$aic
while(!mystop){
mylist[[i]] <- arima.out
arima.out <- arima(series, order=order, seasonal=seasonal, include.mean=include.mean, method='ML', fixed=last.arma$next.vector)
aic <- c(aic, arima.out$aic)
last.arma <- armaGR(arima.out, names, length(series))
mystop <- !last.arma$continue
coeff[i,] <- last.arma[[1]][,1]
pval [i,] <- last.arma[[1]][,4]
i <- i+1
}
list(coeff, pval, mylist, aic=aic)
}
arimaSelectplot <- function(arimaSelect.out,noms,choix){
noms <- names(arimaSelect.out[[3]][[1]]$coef)
coeff <- arimaSelect.out[[1]]
k <- min(which(is.na(coeff[,1])))-1
coeff <- coeff[1:k,]
pval <- arimaSelect.out[[2]][1:k,]
aic <- arimaSelect.out$aic[1:k]
coeff[coeff==0] <- NA
n <- ncol(coeff)
if(missing(choix)) choix <- k
layout(matrix(c(1,1,1,2,
3,3,3,2,
3,3,3,4,
5,6,7,7),nr=4),
widths=c(10,35,45,15),
heights=c(30,30,15,15))
couleurs <- rainbow(75)[1:50]#(50)
ticks <- pretty(coeff)
par(mar=c(1,1,3,1))
plot(aic,k:1-.5,type='o',pch=21,bg='blue',cex=2,axes=F,lty=2,xpd=NA)
points(aic[choix],k-choix+.5,pch=21,cex=4,bg=2,xpd=NA)
title('aic',line=2)
par(mar=c(3,0,0,0))
plot(0,axes=F,xlab='',ylab='',xlim=range(ticks),ylim=c(.1,1))
rect(xleft = min(ticks) + (0:49)/50*(max(ticks)-min(ticks)),
xright = min(ticks) + (1:50)/50*(max(ticks)-min(ticks)),
ytop = rep(1,50),
ybottom= rep(0,50),col=couleurs,border=NA)
axis(1,ticks)
rect(xleft=min(ticks),xright=max(ticks),ytop=1,ybottom=0)
text(mean(coeff,na.rm=T),.5,'coefficients',cex=2,font=2)
par(mar=c(1,1,3,1))
image(1:n,1:k,t(coeff[k:1,]),axes=F,col=couleurs,zlim=range(ticks))
for(i in 1:n) for(j in 1:k) if(!is.na(coeff[j,i])) {
if(pval[j,i]<.01) symb = 'green'
else if( (pval[j,i]<.05) & (pval[j,i]>=.01)) symb = 'orange'
else if( (pval[j,i]<.1) & (pval[j,i]>=.05)) symb = 'red'
else symb = 'black'
polygon(c(i+.5 ,i+.2 ,i+.5 ,i+.5),
c(k-j+0.5,k-j+0.5,k-j+0.8,k-j+0.5),
col=symb)
if(j==choix) {
rect(xleft=i-.5,
xright=i+.5,
ybottom=k-j+1.5,
ytop=k-j+.5,
lwd=4)
text(i,
k-j+1,
round(coeff[j,i],2),
cex=1.2,
font=2)
}
else{
rect(xleft=i-.5,xright=i+.5,ybottom=k-j+1.5,ytop=k-j+.5)
text(i,k-j+1,round(coeff[j,i],2),cex=1.2,font=1)
}
}
axis(3,1:n,noms)
par(mar=c(0.5,0,0,0.5))
plot(0,axes=F,xlab='',ylab='',type='n',xlim=c(0,8),ylim=c(-.2,.8))
cols <- c('green','orange','red','black')
niv <- c('0','0.01','0.05','0.1')
for(i in 0:3){
polygon(c(1+2*i ,1+2*i ,1+2*i-.5 ,1+2*i),
c(.4 ,.7 , .4 , .4),
col=cols[i+1])
text(2*i,0.5,niv[i+1],cex=1.5)
}
text(8,.5,1,cex=1.5)
text(4,0,'p-value',cex=2)
box()
residus <- arimaSelect.out[[3]][[choix]]$res
par(mar=c(1,2,4,1))
acf(residus,main='')
title('acf',line=.5)
par(mar=c(1,2,4,1))
pacf(residus,main='')
title('pacf',line=.5)
par(mar=c(2,2,4,1))
qqnorm(residus,main='')
title('qq-norm',line=.5)
qqline(residus)
residus
}
if (par2 == 0) x <- log(x)
if (par2 != 0) x <- x^par2
(selection <- arimaSelect(x, order=c(par6,par3,par7), seasonal=list(order=c(par8,par4,par9), period=par5)))
bitmap(file='test1.png')
resid <- arimaSelectplot(selection)
dev.off()
resid
bitmap(file='test2.png')
acf(resid,length(resid)/2, main='Residual Autocorrelation Function')
dev.off()
bitmap(file='test3.png')
pacf(resid,length(resid)/2, main='Residual Partial Autocorrelation Function')
dev.off()
bitmap(file='test4.png')
cpgram(resid, main='Residual Cumulative Periodogram')
dev.off()
bitmap(file='test5.png')
hist(resid, main='Residual Histogram', xlab='values of Residuals')
dev.off()
bitmap(file='test6.png')
densityplot(~resid,col='black',main='Residual Density Plot', xlab='values of Residuals')
dev.off()
bitmap(file='test7.png')
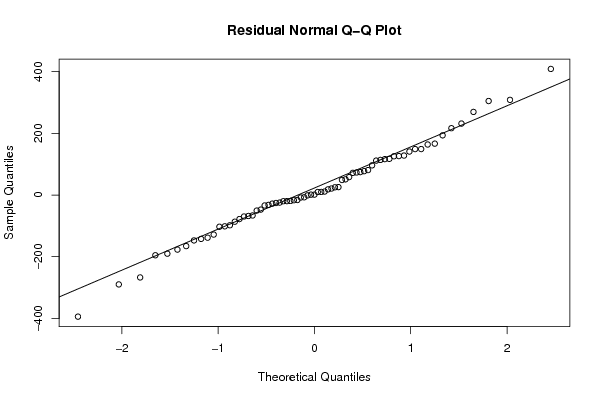
qqnorm(resid, main='Residual Normal Q-Q Plot')
qqline(resid)
dev.off()
ncols <- length(selection[[1]][1,])
nrows <- length(selection[[2]][,1])-1
load(file='createtable')
a<-table.start()
a<-table.row.start(a)
a<-table.element(a,'ARIMA Parameter Estimation and Backward Selection', ncols+1,TRUE)
a<-table.row.end(a)
a<-table.row.start(a)
a<-table.element(a,'Iteration', header=TRUE)
for (i in 1:ncols) {
a<-table.element(a,names(selection[[3]][[1]]$coef)[i],header=TRUE)
}
a<-table.row.end(a)
for (j in 1:nrows) {
a<-table.row.start(a)
mydum <- 'Estimates ('
mydum <- paste(mydum,j)
mydum <- paste(mydum,')')
a<-table.element(a,mydum, header=TRUE)
for (i in 1:ncols) {
a<-table.element(a,round(selection[[1]][j,i],4))
}
a<-table.row.end(a)
a<-table.row.start(a)
a<-table.element(a,'(p-val)', header=TRUE)
for (i in 1:ncols) {
mydum <- '('
mydum <- paste(mydum,round(selection[[2]][j,i],4),sep='')
mydum <- paste(mydum,')')
a<-table.element(a,mydum)
}
a<-table.row.end(a)
}
a<-table.end(a)
table.save(a,file='mytable.tab')
a<-table.start()
a<-table.row.start(a)
a<-table.element(a,'Estimated ARIMA Residuals', 1,TRUE)
a<-table.row.end(a)
a<-table.row.start(a)
a<-table.element(a,'Value', 1,TRUE)
a<-table.row.end(a)
for (i in (par4*par5+par3):length(resid)) {
a<-table.row.start(a)
a<-table.element(a,resid[i])
a<-table.row.end(a)
}
a<-table.end(a)
table.save(a,file='mytable1.tab')