Free Statistics

of Irreproducible Research!

Author's title

Author*The author of this computation has been verified*
R Software Modulerwasp_arimabackwardselection.wasp
Title produced by softwareARIMA Backward Selection
Date of computationWed, 29 Dec 2010 18:49:41 +0000
Cite this page as followsStatistical Computations at FreeStatistics.org, Office for Research Development and Education, URL https://freestatistics.org/blog/index.php?v=date/2010/Dec/29/t1293648473rmhaf6nakhdqecn.htm/, Retrieved Fri, 03 May 2024 10:32:40 +0000
Statistical Computations at FreeStatistics.org, Office for Research Development and Education, URL https://freestatistics.org/blog/index.php?pk=117028, Retrieved Fri, 03 May 2024 10:32:40 +0000
QR Codes:

Original text written by user:
IsPrivate?No (this computation is public)
User-defined keywords
Estimated Impact112
Family? (F = Feedback message, R = changed R code, M = changed R Module, P = changed Parameters, D = changed Data)
-     [Univariate Data Series] [data set] [2008-12-01 19:54:57] [b98453cac15ba1066b407e146608df68]
- RMP   [Standard Deviation-Mean Plot] [Unemployment] [2010-11-29 10:34:47] [b98453cac15ba1066b407e146608df68]
- RMP     [ARIMA Backward Selection] [Unemployment] [2010-11-29 17:10:28] [b98453cac15ba1066b407e146608df68]
- R PD      [ARIMA Backward Selection] [ARIMA model1] [2010-12-29 18:46:32] [a7c91bc614e4e21e8b9c8593f39a36f1]
-               [ARIMA Backward Selection] [ARIMA Model2] [2010-12-29 18:49:41] [062de5fc17e30860c0960288bdb996a8] [Current]
Feedback Forum

Post a new message
Dataseries X:
621
587
655
517
646
657
382
345
625
654
606
510
614
647
580
614
636
388
356
639
753
611
639
630
586
695
552
619
681
421
307
754
690
644
643
608
651
691
627
634
731
475
337
803
722
590
724
627
696
825
677
656
785
412
352
839
729
696
641
695
638
762
635
721
854
418
367
824
687
601
676
740
691
683
594
729
731
386
331
706
715
657
653
642
643
718
654
632
731
392
344
792
852
649
629
685
617
715
715
629
916
531
357
917
828
708
858
775
785
1006
789
734
906
532
387
991
841
892
782
813
793
978
775
797
946
594
438
1022
868
795


Summary of computational transaction
Raw Inputview raw input (R code)
Raw Outputview raw output of R engine
Computing time18 seconds
R Server'Sir Ronald Aylmer Fisher' @ 193.190.124.24

\begin{tabular}{lllllllll}
\hline
Summary of computational transaction \tabularnewline
Raw Input & view raw input (R code)  \tabularnewline
Raw Output & view raw output of R engine  \tabularnewline
Computing time & 18 seconds \tabularnewline
R Server & 'Sir Ronald Aylmer Fisher' @ 193.190.124.24 \tabularnewline
\hline
\end{tabular}
%Source: https://freestatistics.org/blog/index.php?pk=117028&T=0

[TABLE]
[ROW][C]Summary of computational transaction[/C][/ROW]
[ROW][C]Raw Input[/C][C]view raw input (R code) [/C][/ROW]
[ROW][C]Raw Output[/C][C]view raw output of R engine [/C][/ROW]
[ROW][C]Computing time[/C][C]18 seconds[/C][/ROW]
[ROW][C]R Server[/C][C]'Sir Ronald Aylmer Fisher' @ 193.190.124.24[/C][/ROW]
[/TABLE]
Source: https://freestatistics.org/blog/index.php?pk=117028&T=0

Globally Unique Identifier (entire table): ba.freestatistics.org/blog/index.php?pk=117028&T=0

As an alternative you can also use a QR Code:  

The GUIDs for individual cells are displayed in the table below:

Summary of computational transaction
Raw Inputview raw input (R code)
Raw Outputview raw output of R engine
Computing time18 seconds
R Server'Sir Ronald Aylmer Fisher' @ 193.190.124.24


ARIMA Parameter Estimation and Backward Selection
Iterationar1ar2ar3ma1sar1sar2sma1
Estimates ( 1 )0.784-0.15680.3168-0.6929-1.0472-0.50330.7089
(p-val)(0 )(0.1842 )(0.0021 )(0 )(0 )(0 )(2e-04 )
Estimates ( 2 )0.759900.2133-0.75-0.023-0.1243-0.5048
(p-val)(0 )(NA )(0.0185 )(0 )(0.9323 )(0.4544 )(0.0675 )
Estimates ( 3 )0.761600.2121-0.7520-0.1152-0.525
(p-val)(0 )(NA )(0.0169 )(0 )(NA )(0.3745 )(1e-04 )
Estimates ( 4 )0.749800.2198-0.737300-0.5554
(p-val)(0 )(NA )(0.0136 )(0 )(NA )(NA )(0 )
Estimates ( 5 )NANANANANANANA
(p-val)(NA )(NA )(NA )(NA )(NA )(NA )(NA )
Estimates ( 6 )NANANANANANANA
(p-val)(NA )(NA )(NA )(NA )(NA )(NA )(NA )
Estimates ( 7 )NANANANANANANA
(p-val)(NA )(NA )(NA )(NA )(NA )(NA )(NA )
Estimates ( 8 )NANANANANANANA
(p-val)(NA )(NA )(NA )(NA )(NA )(NA )(NA )
Estimates ( 9 )NANANANANANANA
(p-val)(NA )(NA )(NA )(NA )(NA )(NA )(NA )
Estimates ( 10 )NANANANANANANA
(p-val)(NA )(NA )(NA )(NA )(NA )(NA )(NA )
Estimates ( 11 )NANANANANANANA
(p-val)(NA )(NA )(NA )(NA )(NA )(NA )(NA )
Estimates ( 12 )NANANANANANANA
(p-val)(NA )(NA )(NA )(NA )(NA )(NA )(NA )
Estimates ( 13 )NANANANANANANA
(p-val)(NA )(NA )(NA )(NA )(NA )(NA )(NA )

\begin{tabular}{lllllllll}
\hline
ARIMA Parameter Estimation and Backward Selection \tabularnewline
Iteration & ar1 & ar2 & ar3 & ma1 & sar1 & sar2 & sma1 \tabularnewline
Estimates ( 1 ) & 0.784 & -0.1568 & 0.3168 & -0.6929 & -1.0472 & -0.5033 & 0.7089 \tabularnewline
(p-val) & (0 ) & (0.1842 ) & (0.0021 ) & (0 ) & (0 ) & (0 ) & (2e-04 ) \tabularnewline
Estimates ( 2 ) & 0.7599 & 0 & 0.2133 & -0.75 & -0.023 & -0.1243 & -0.5048 \tabularnewline
(p-val) & (0 ) & (NA ) & (0.0185 ) & (0 ) & (0.9323 ) & (0.4544 ) & (0.0675 ) \tabularnewline
Estimates ( 3 ) & 0.7616 & 0 & 0.2121 & -0.752 & 0 & -0.1152 & -0.525 \tabularnewline
(p-val) & (0 ) & (NA ) & (0.0169 ) & (0 ) & (NA ) & (0.3745 ) & (1e-04 ) \tabularnewline
Estimates ( 4 ) & 0.7498 & 0 & 0.2198 & -0.7373 & 0 & 0 & -0.5554 \tabularnewline
(p-val) & (0 ) & (NA ) & (0.0136 ) & (0 ) & (NA ) & (NA ) & (0 ) \tabularnewline
Estimates ( 5 ) & NA & NA & NA & NA & NA & NA & NA \tabularnewline
(p-val) & (NA ) & (NA ) & (NA ) & (NA ) & (NA ) & (NA ) & (NA ) \tabularnewline
Estimates ( 6 ) & NA & NA & NA & NA & NA & NA & NA \tabularnewline
(p-val) & (NA ) & (NA ) & (NA ) & (NA ) & (NA ) & (NA ) & (NA ) \tabularnewline
Estimates ( 7 ) & NA & NA & NA & NA & NA & NA & NA \tabularnewline
(p-val) & (NA ) & (NA ) & (NA ) & (NA ) & (NA ) & (NA ) & (NA ) \tabularnewline
Estimates ( 8 ) & NA & NA & NA & NA & NA & NA & NA \tabularnewline
(p-val) & (NA ) & (NA ) & (NA ) & (NA ) & (NA ) & (NA ) & (NA ) \tabularnewline
Estimates ( 9 ) & NA & NA & NA & NA & NA & NA & NA \tabularnewline
(p-val) & (NA ) & (NA ) & (NA ) & (NA ) & (NA ) & (NA ) & (NA ) \tabularnewline
Estimates ( 10 ) & NA & NA & NA & NA & NA & NA & NA \tabularnewline
(p-val) & (NA ) & (NA ) & (NA ) & (NA ) & (NA ) & (NA ) & (NA ) \tabularnewline
Estimates ( 11 ) & NA & NA & NA & NA & NA & NA & NA \tabularnewline
(p-val) & (NA ) & (NA ) & (NA ) & (NA ) & (NA ) & (NA ) & (NA ) \tabularnewline
Estimates ( 12 ) & NA & NA & NA & NA & NA & NA & NA \tabularnewline
(p-val) & (NA ) & (NA ) & (NA ) & (NA ) & (NA ) & (NA ) & (NA ) \tabularnewline
Estimates ( 13 ) & NA & NA & NA & NA & NA & NA & NA \tabularnewline
(p-val) & (NA ) & (NA ) & (NA ) & (NA ) & (NA ) & (NA ) & (NA ) \tabularnewline
\hline
\end{tabular}
%Source: https://freestatistics.org/blog/index.php?pk=117028&T=1

[TABLE]
[ROW][C]ARIMA Parameter Estimation and Backward Selection[/C][/ROW]
[ROW][C]Iteration[/C][C]ar1[/C][C]ar2[/C][C]ar3[/C][C]ma1[/C][C]sar1[/C][C]sar2[/C][C]sma1[/C][/ROW]
[ROW][C]Estimates ( 1 )[/C][C]0.784[/C][C]-0.1568[/C][C]0.3168[/C][C]-0.6929[/C][C]-1.0472[/C][C]-0.5033[/C][C]0.7089[/C][/ROW]
[ROW][C](p-val)[/C][C](0 )[/C][C](0.1842 )[/C][C](0.0021 )[/C][C](0 )[/C][C](0 )[/C][C](0 )[/C][C](2e-04 )[/C][/ROW]
[ROW][C]Estimates ( 2 )[/C][C]0.7599[/C][C]0[/C][C]0.2133[/C][C]-0.75[/C][C]-0.023[/C][C]-0.1243[/C][C]-0.5048[/C][/ROW]
[ROW][C](p-val)[/C][C](0 )[/C][C](NA )[/C][C](0.0185 )[/C][C](0 )[/C][C](0.9323 )[/C][C](0.4544 )[/C][C](0.0675 )[/C][/ROW]
[ROW][C]Estimates ( 3 )[/C][C]0.7616[/C][C]0[/C][C]0.2121[/C][C]-0.752[/C][C]0[/C][C]-0.1152[/C][C]-0.525[/C][/ROW]
[ROW][C](p-val)[/C][C](0 )[/C][C](NA )[/C][C](0.0169 )[/C][C](0 )[/C][C](NA )[/C][C](0.3745 )[/C][C](1e-04 )[/C][/ROW]
[ROW][C]Estimates ( 4 )[/C][C]0.7498[/C][C]0[/C][C]0.2198[/C][C]-0.7373[/C][C]0[/C][C]0[/C][C]-0.5554[/C][/ROW]
[ROW][C](p-val)[/C][C](0 )[/C][C](NA )[/C][C](0.0136 )[/C][C](0 )[/C][C](NA )[/C][C](NA )[/C][C](0 )[/C][/ROW]
[ROW][C]Estimates ( 5 )[/C][C]NA[/C][C]NA[/C][C]NA[/C][C]NA[/C][C]NA[/C][C]NA[/C][C]NA[/C][/ROW]
[ROW][C](p-val)[/C][C](NA )[/C][C](NA )[/C][C](NA )[/C][C](NA )[/C][C](NA )[/C][C](NA )[/C][C](NA )[/C][/ROW]
[ROW][C]Estimates ( 6 )[/C][C]NA[/C][C]NA[/C][C]NA[/C][C]NA[/C][C]NA[/C][C]NA[/C][C]NA[/C][/ROW]
[ROW][C](p-val)[/C][C](NA )[/C][C](NA )[/C][C](NA )[/C][C](NA )[/C][C](NA )[/C][C](NA )[/C][C](NA )[/C][/ROW]
[ROW][C]Estimates ( 7 )[/C][C]NA[/C][C]NA[/C][C]NA[/C][C]NA[/C][C]NA[/C][C]NA[/C][C]NA[/C][/ROW]
[ROW][C](p-val)[/C][C](NA )[/C][C](NA )[/C][C](NA )[/C][C](NA )[/C][C](NA )[/C][C](NA )[/C][C](NA )[/C][/ROW]
[ROW][C]Estimates ( 8 )[/C][C]NA[/C][C]NA[/C][C]NA[/C][C]NA[/C][C]NA[/C][C]NA[/C][C]NA[/C][/ROW]
[ROW][C](p-val)[/C][C](NA )[/C][C](NA )[/C][C](NA )[/C][C](NA )[/C][C](NA )[/C][C](NA )[/C][C](NA )[/C][/ROW]
[ROW][C]Estimates ( 9 )[/C][C]NA[/C][C]NA[/C][C]NA[/C][C]NA[/C][C]NA[/C][C]NA[/C][C]NA[/C][/ROW]
[ROW][C](p-val)[/C][C](NA )[/C][C](NA )[/C][C](NA )[/C][C](NA )[/C][C](NA )[/C][C](NA )[/C][C](NA )[/C][/ROW]
[ROW][C]Estimates ( 10 )[/C][C]NA[/C][C]NA[/C][C]NA[/C][C]NA[/C][C]NA[/C][C]NA[/C][C]NA[/C][/ROW]
[ROW][C](p-val)[/C][C](NA )[/C][C](NA )[/C][C](NA )[/C][C](NA )[/C][C](NA )[/C][C](NA )[/C][C](NA )[/C][/ROW]
[ROW][C]Estimates ( 11 )[/C][C]NA[/C][C]NA[/C][C]NA[/C][C]NA[/C][C]NA[/C][C]NA[/C][C]NA[/C][/ROW]
[ROW][C](p-val)[/C][C](NA )[/C][C](NA )[/C][C](NA )[/C][C](NA )[/C][C](NA )[/C][C](NA )[/C][C](NA )[/C][/ROW]
[ROW][C]Estimates ( 12 )[/C][C]NA[/C][C]NA[/C][C]NA[/C][C]NA[/C][C]NA[/C][C]NA[/C][C]NA[/C][/ROW]
[ROW][C](p-val)[/C][C](NA )[/C][C](NA )[/C][C](NA )[/C][C](NA )[/C][C](NA )[/C][C](NA )[/C][C](NA )[/C][/ROW]
[ROW][C]Estimates ( 13 )[/C][C]NA[/C][C]NA[/C][C]NA[/C][C]NA[/C][C]NA[/C][C]NA[/C][C]NA[/C][/ROW]
[ROW][C](p-val)[/C][C](NA )[/C][C](NA )[/C][C](NA )[/C][C](NA )[/C][C](NA )[/C][C](NA )[/C][C](NA )[/C][/ROW]
[/TABLE]
Source: https://freestatistics.org/blog/index.php?pk=117028&T=1

Globally Unique Identifier (entire table): ba.freestatistics.org/blog/index.php?pk=117028&T=1

As an alternative you can also use a QR Code:  

The GUIDs for individual cells are displayed in the table below:

ARIMA Parameter Estimation and Backward Selection
Iterationar1ar2ar3ma1sar1sar2sma1
Estimates ( 1 )0.784-0.15680.3168-0.6929-1.0472-0.50330.7089
(p-val)(0 )(0.1842 )(0.0021 )(0 )(0 )(0 )(2e-04 )
Estimates ( 2 )0.759900.2133-0.75-0.023-0.1243-0.5048
(p-val)(0 )(NA )(0.0185 )(0 )(0.9323 )(0.4544 )(0.0675 )
Estimates ( 3 )0.761600.2121-0.7520-0.1152-0.525
(p-val)(0 )(NA )(0.0169 )(0 )(NA )(0.3745 )(1e-04 )
Estimates ( 4 )0.749800.2198-0.737300-0.5554
(p-val)(0 )(NA )(0.0136 )(0 )(NA )(NA )(0 )
Estimates ( 5 )NANANANANANANA
(p-val)(NA )(NA )(NA )(NA )(NA )(NA )(NA )
Estimates ( 6 )NANANANANANANA
(p-val)(NA )(NA )(NA )(NA )(NA )(NA )(NA )
Estimates ( 7 )NANANANANANANA
(p-val)(NA )(NA )(NA )(NA )(NA )(NA )(NA )
Estimates ( 8 )NANANANANANANA
(p-val)(NA )(NA )(NA )(NA )(NA )(NA )(NA )
Estimates ( 9 )NANANANANANANA
(p-val)(NA )(NA )(NA )(NA )(NA )(NA )(NA )
Estimates ( 10 )NANANANANANANA
(p-val)(NA )(NA )(NA )(NA )(NA )(NA )(NA )
Estimates ( 11 )NANANANANANANA
(p-val)(NA )(NA )(NA )(NA )(NA )(NA )(NA )
Estimates ( 12 )NANANANANANANA
(p-val)(NA )(NA )(NA )(NA )(NA )(NA )(NA )
Estimates ( 13 )NANANANANANANA
(p-val)(NA )(NA )(NA )(NA )(NA )(NA )(NA )


Estimated ARIMA Residuals
Value
0.509998367559882
-5.83861435556603
50.7401396172694
-66.6523698970494
87.3788671183601
-19.7222289005516
-231.355555233216
-36.8249845205366
250.893410325925
157.604759879530
2.62460424818053
6.84993391170138
62.1003232953745
-53.0357221799291
41.7488451071568
-91.3276809751777
15.8472620113748
8.29344431693822
-73.6726368733742
-72.1271707455806
189.767085012853
-19.0680080876556
26.4871789013301
-19.707959640777
-6.53173961246478
25.4593130604125
12.7221330531653
18.5211838992006
17.6656382000063
39.4400657818936
-37.0417926258737
-31.7977182169798
146.582181244879
10.2982043015525
-71.0503287745686
37.7246576432817
-8.38116446131255
37.4524109473796
114.264802474362
24.1693681834529
-1.60666249608002
24.7058622049878
-129.466819527396
-49.8861892201089
79.8024314043562
-16.6293727436626
54.5962970179285
-87.8232830485763
42.6664086500562
-68.5578533110792
-14.0740319748650
-41.6016863514363
61.1115031492251
96.838149537181
-42.1113128731367
-11.8638092022194
13.1334738323523
-63.9222097863117
-88.9324668371032
-10.9070875716224
70.1376083366991
43.7461650782145
-64.6995604925067
-61.7457181870656
27.0296494249702
-64.2773644789892
-51.4720898005542
-34.935571461837
-77.6774494542305
26.6919689517317
52.1871714030104
8.23590907544548
-24.1880137862291
-23.3628398354680
7.4993792441382
51.9214834878105
-42.3063424397726
-5.99008220976075
-17.2146575256715
17.6530559976730
57.6611564365489
154.588354666898
10.4004787047179
-31.8634601174063
-4.55398509841194
-58.7103368941886
-23.7133913191185
61.7328406014465
-36.9955599422118
160.706336424630
107.466579489177
3.12860407460009
94.0739120214266
-5.17813684709028
19.9289619029859
147.021934386144
31.4924871503866
83.2988208254049
196.660055620566
29.2004326079535
-24.1025239651829
-63.1867413023351
-62.4080446631491
-77.4147029561705
51.9781808204319
-36.2449548832913
139.719971765040
-61.5975841103381
8.9940477852017
-28.4853366310521
33.4901495740192
-31.6261607162531
18.9330450372255
10.1996411842640
32.6519333655236
-11.6570909701233
41.5046400088208
-35.2345990160276
-58.6261000148588

\begin{tabular}{lllllllll}
\hline
Estimated ARIMA Residuals \tabularnewline
Value \tabularnewline
0.509998367559882 \tabularnewline
-5.83861435556603 \tabularnewline
50.7401396172694 \tabularnewline
-66.6523698970494 \tabularnewline
87.3788671183601 \tabularnewline
-19.7222289005516 \tabularnewline
-231.355555233216 \tabularnewline
-36.8249845205366 \tabularnewline
250.893410325925 \tabularnewline
157.604759879530 \tabularnewline
2.62460424818053 \tabularnewline
6.84993391170138 \tabularnewline
62.1003232953745 \tabularnewline
-53.0357221799291 \tabularnewline
41.7488451071568 \tabularnewline
-91.3276809751777 \tabularnewline
15.8472620113748 \tabularnewline
8.29344431693822 \tabularnewline
-73.6726368733742 \tabularnewline
-72.1271707455806 \tabularnewline
189.767085012853 \tabularnewline
-19.0680080876556 \tabularnewline
26.4871789013301 \tabularnewline
-19.707959640777 \tabularnewline
-6.53173961246478 \tabularnewline
25.4593130604125 \tabularnewline
12.7221330531653 \tabularnewline
18.5211838992006 \tabularnewline
17.6656382000063 \tabularnewline
39.4400657818936 \tabularnewline
-37.0417926258737 \tabularnewline
-31.7977182169798 \tabularnewline
146.582181244879 \tabularnewline
10.2982043015525 \tabularnewline
-71.0503287745686 \tabularnewline
37.7246576432817 \tabularnewline
-8.38116446131255 \tabularnewline
37.4524109473796 \tabularnewline
114.264802474362 \tabularnewline
24.1693681834529 \tabularnewline
-1.60666249608002 \tabularnewline
24.7058622049878 \tabularnewline
-129.466819527396 \tabularnewline
-49.8861892201089 \tabularnewline
79.8024314043562 \tabularnewline
-16.6293727436626 \tabularnewline
54.5962970179285 \tabularnewline
-87.8232830485763 \tabularnewline
42.6664086500562 \tabularnewline
-68.5578533110792 \tabularnewline
-14.0740319748650 \tabularnewline
-41.6016863514363 \tabularnewline
61.1115031492251 \tabularnewline
96.838149537181 \tabularnewline
-42.1113128731367 \tabularnewline
-11.8638092022194 \tabularnewline
13.1334738323523 \tabularnewline
-63.9222097863117 \tabularnewline
-88.9324668371032 \tabularnewline
-10.9070875716224 \tabularnewline
70.1376083366991 \tabularnewline
43.7461650782145 \tabularnewline
-64.6995604925067 \tabularnewline
-61.7457181870656 \tabularnewline
27.0296494249702 \tabularnewline
-64.2773644789892 \tabularnewline
-51.4720898005542 \tabularnewline
-34.935571461837 \tabularnewline
-77.6774494542305 \tabularnewline
26.6919689517317 \tabularnewline
52.1871714030104 \tabularnewline
8.23590907544548 \tabularnewline
-24.1880137862291 \tabularnewline
-23.3628398354680 \tabularnewline
7.4993792441382 \tabularnewline
51.9214834878105 \tabularnewline
-42.3063424397726 \tabularnewline
-5.99008220976075 \tabularnewline
-17.2146575256715 \tabularnewline
17.6530559976730 \tabularnewline
57.6611564365489 \tabularnewline
154.588354666898 \tabularnewline
10.4004787047179 \tabularnewline
-31.8634601174063 \tabularnewline
-4.55398509841194 \tabularnewline
-58.7103368941886 \tabularnewline
-23.7133913191185 \tabularnewline
61.7328406014465 \tabularnewline
-36.9955599422118 \tabularnewline
160.706336424630 \tabularnewline
107.466579489177 \tabularnewline
3.12860407460009 \tabularnewline
94.0739120214266 \tabularnewline
-5.17813684709028 \tabularnewline
19.9289619029859 \tabularnewline
147.021934386144 \tabularnewline
31.4924871503866 \tabularnewline
83.2988208254049 \tabularnewline
196.660055620566 \tabularnewline
29.2004326079535 \tabularnewline
-24.1025239651829 \tabularnewline
-63.1867413023351 \tabularnewline
-62.4080446631491 \tabularnewline
-77.4147029561705 \tabularnewline
51.9781808204319 \tabularnewline
-36.2449548832913 \tabularnewline
139.719971765040 \tabularnewline
-61.5975841103381 \tabularnewline
8.9940477852017 \tabularnewline
-28.4853366310521 \tabularnewline
33.4901495740192 \tabularnewline
-31.6261607162531 \tabularnewline
18.9330450372255 \tabularnewline
10.1996411842640 \tabularnewline
32.6519333655236 \tabularnewline
-11.6570909701233 \tabularnewline
41.5046400088208 \tabularnewline
-35.2345990160276 \tabularnewline
-58.6261000148588 \tabularnewline
\hline
\end{tabular}
%Source: https://freestatistics.org/blog/index.php?pk=117028&T=2

[TABLE]
[ROW][C]Estimated ARIMA Residuals[/C][/ROW]
[ROW][C]Value[/C][/ROW]
[ROW][C]0.509998367559882[/C][/ROW]
[ROW][C]-5.83861435556603[/C][/ROW]
[ROW][C]50.7401396172694[/C][/ROW]
[ROW][C]-66.6523698970494[/C][/ROW]
[ROW][C]87.3788671183601[/C][/ROW]
[ROW][C]-19.7222289005516[/C][/ROW]
[ROW][C]-231.355555233216[/C][/ROW]
[ROW][C]-36.8249845205366[/C][/ROW]
[ROW][C]250.893410325925[/C][/ROW]
[ROW][C]157.604759879530[/C][/ROW]
[ROW][C]2.62460424818053[/C][/ROW]
[ROW][C]6.84993391170138[/C][/ROW]
[ROW][C]62.1003232953745[/C][/ROW]
[ROW][C]-53.0357221799291[/C][/ROW]
[ROW][C]41.7488451071568[/C][/ROW]
[ROW][C]-91.3276809751777[/C][/ROW]
[ROW][C]15.8472620113748[/C][/ROW]
[ROW][C]8.29344431693822[/C][/ROW]
[ROW][C]-73.6726368733742[/C][/ROW]
[ROW][C]-72.1271707455806[/C][/ROW]
[ROW][C]189.767085012853[/C][/ROW]
[ROW][C]-19.0680080876556[/C][/ROW]
[ROW][C]26.4871789013301[/C][/ROW]
[ROW][C]-19.707959640777[/C][/ROW]
[ROW][C]-6.53173961246478[/C][/ROW]
[ROW][C]25.4593130604125[/C][/ROW]
[ROW][C]12.7221330531653[/C][/ROW]
[ROW][C]18.5211838992006[/C][/ROW]
[ROW][C]17.6656382000063[/C][/ROW]
[ROW][C]39.4400657818936[/C][/ROW]
[ROW][C]-37.0417926258737[/C][/ROW]
[ROW][C]-31.7977182169798[/C][/ROW]
[ROW][C]146.582181244879[/C][/ROW]
[ROW][C]10.2982043015525[/C][/ROW]
[ROW][C]-71.0503287745686[/C][/ROW]
[ROW][C]37.7246576432817[/C][/ROW]
[ROW][C]-8.38116446131255[/C][/ROW]
[ROW][C]37.4524109473796[/C][/ROW]
[ROW][C]114.264802474362[/C][/ROW]
[ROW][C]24.1693681834529[/C][/ROW]
[ROW][C]-1.60666249608002[/C][/ROW]
[ROW][C]24.7058622049878[/C][/ROW]
[ROW][C]-129.466819527396[/C][/ROW]
[ROW][C]-49.8861892201089[/C][/ROW]
[ROW][C]79.8024314043562[/C][/ROW]
[ROW][C]-16.6293727436626[/C][/ROW]
[ROW][C]54.5962970179285[/C][/ROW]
[ROW][C]-87.8232830485763[/C][/ROW]
[ROW][C]42.6664086500562[/C][/ROW]
[ROW][C]-68.5578533110792[/C][/ROW]
[ROW][C]-14.0740319748650[/C][/ROW]
[ROW][C]-41.6016863514363[/C][/ROW]
[ROW][C]61.1115031492251[/C][/ROW]
[ROW][C]96.838149537181[/C][/ROW]
[ROW][C]-42.1113128731367[/C][/ROW]
[ROW][C]-11.8638092022194[/C][/ROW]
[ROW][C]13.1334738323523[/C][/ROW]
[ROW][C]-63.9222097863117[/C][/ROW]
[ROW][C]-88.9324668371032[/C][/ROW]
[ROW][C]-10.9070875716224[/C][/ROW]
[ROW][C]70.1376083366991[/C][/ROW]
[ROW][C]43.7461650782145[/C][/ROW]
[ROW][C]-64.6995604925067[/C][/ROW]
[ROW][C]-61.7457181870656[/C][/ROW]
[ROW][C]27.0296494249702[/C][/ROW]
[ROW][C]-64.2773644789892[/C][/ROW]
[ROW][C]-51.4720898005542[/C][/ROW]
[ROW][C]-34.935571461837[/C][/ROW]
[ROW][C]-77.6774494542305[/C][/ROW]
[ROW][C]26.6919689517317[/C][/ROW]
[ROW][C]52.1871714030104[/C][/ROW]
[ROW][C]8.23590907544548[/C][/ROW]
[ROW][C]-24.1880137862291[/C][/ROW]
[ROW][C]-23.3628398354680[/C][/ROW]
[ROW][C]7.4993792441382[/C][/ROW]
[ROW][C]51.9214834878105[/C][/ROW]
[ROW][C]-42.3063424397726[/C][/ROW]
[ROW][C]-5.99008220976075[/C][/ROW]
[ROW][C]-17.2146575256715[/C][/ROW]
[ROW][C]17.6530559976730[/C][/ROW]
[ROW][C]57.6611564365489[/C][/ROW]
[ROW][C]154.588354666898[/C][/ROW]
[ROW][C]10.4004787047179[/C][/ROW]
[ROW][C]-31.8634601174063[/C][/ROW]
[ROW][C]-4.55398509841194[/C][/ROW]
[ROW][C]-58.7103368941886[/C][/ROW]
[ROW][C]-23.7133913191185[/C][/ROW]
[ROW][C]61.7328406014465[/C][/ROW]
[ROW][C]-36.9955599422118[/C][/ROW]
[ROW][C]160.706336424630[/C][/ROW]
[ROW][C]107.466579489177[/C][/ROW]
[ROW][C]3.12860407460009[/C][/ROW]
[ROW][C]94.0739120214266[/C][/ROW]
[ROW][C]-5.17813684709028[/C][/ROW]
[ROW][C]19.9289619029859[/C][/ROW]
[ROW][C]147.021934386144[/C][/ROW]
[ROW][C]31.4924871503866[/C][/ROW]
[ROW][C]83.2988208254049[/C][/ROW]
[ROW][C]196.660055620566[/C][/ROW]
[ROW][C]29.2004326079535[/C][/ROW]
[ROW][C]-24.1025239651829[/C][/ROW]
[ROW][C]-63.1867413023351[/C][/ROW]
[ROW][C]-62.4080446631491[/C][/ROW]
[ROW][C]-77.4147029561705[/C][/ROW]
[ROW][C]51.9781808204319[/C][/ROW]
[ROW][C]-36.2449548832913[/C][/ROW]
[ROW][C]139.719971765040[/C][/ROW]
[ROW][C]-61.5975841103381[/C][/ROW]
[ROW][C]8.9940477852017[/C][/ROW]
[ROW][C]-28.4853366310521[/C][/ROW]
[ROW][C]33.4901495740192[/C][/ROW]
[ROW][C]-31.6261607162531[/C][/ROW]
[ROW][C]18.9330450372255[/C][/ROW]
[ROW][C]10.1996411842640[/C][/ROW]
[ROW][C]32.6519333655236[/C][/ROW]
[ROW][C]-11.6570909701233[/C][/ROW]
[ROW][C]41.5046400088208[/C][/ROW]
[ROW][C]-35.2345990160276[/C][/ROW]
[ROW][C]-58.6261000148588[/C][/ROW]
[/TABLE]
Source: https://freestatistics.org/blog/index.php?pk=117028&T=2

Globally Unique Identifier (entire table): ba.freestatistics.org/blog/index.php?pk=117028&T=2

As an alternative you can also use a QR Code:  

The GUIDs for individual cells are displayed in the table below:

Estimated ARIMA Residuals
Value
0.509998367559882
-5.83861435556603
50.7401396172694
-66.6523698970494
87.3788671183601
-19.7222289005516
-231.355555233216
-36.8249845205366
250.893410325925
157.604759879530
2.62460424818053
6.84993391170138
62.1003232953745
-53.0357221799291
41.7488451071568
-91.3276809751777
15.8472620113748
8.29344431693822
-73.6726368733742
-72.1271707455806
189.767085012853
-19.0680080876556
26.4871789013301
-19.707959640777
-6.53173961246478
25.4593130604125
12.7221330531653
18.5211838992006
17.6656382000063
39.4400657818936
-37.0417926258737
-31.7977182169798
146.582181244879
10.2982043015525
-71.0503287745686
37.7246576432817
-8.38116446131255
37.4524109473796
114.264802474362
24.1693681834529
-1.60666249608002
24.7058622049878
-129.466819527396
-49.8861892201089
79.8024314043562
-16.6293727436626
54.5962970179285
-87.8232830485763
42.6664086500562
-68.5578533110792
-14.0740319748650
-41.6016863514363
61.1115031492251
96.838149537181
-42.1113128731367
-11.8638092022194
13.1334738323523
-63.9222097863117
-88.9324668371032
-10.9070875716224
70.1376083366991
43.7461650782145
-64.6995604925067
-61.7457181870656
27.0296494249702
-64.2773644789892
-51.4720898005542
-34.935571461837
-77.6774494542305
26.6919689517317
52.1871714030104
8.23590907544548
-24.1880137862291
-23.3628398354680
7.4993792441382
51.9214834878105
-42.3063424397726
-5.99008220976075
-17.2146575256715
17.6530559976730
57.6611564365489
154.588354666898
10.4004787047179
-31.8634601174063
-4.55398509841194
-58.7103368941886
-23.7133913191185
61.7328406014465
-36.9955599422118
160.706336424630
107.466579489177
3.12860407460009
94.0739120214266
-5.17813684709028
19.9289619029859
147.021934386144
31.4924871503866
83.2988208254049
196.660055620566
29.2004326079535
-24.1025239651829
-63.1867413023351
-62.4080446631491
-77.4147029561705
51.9781808204319
-36.2449548832913
139.719971765040
-61.5975841103381
8.9940477852017
-28.4853366310521
33.4901495740192
-31.6261607162531
18.9330450372255
10.1996411842640
32.6519333655236
-11.6570909701233
41.5046400088208
-35.2345990160276
-58.6261000148588


Parameters (Session):
par1 = 12 ;
Parameters (R input):
par1 = FALSE ; par2 = 1 ; par3 = 0 ; par4 = 1 ; par5 = 12 ; par6 = 3 ; par7 = 1 ; par8 = 2 ; par9 = 1 ;
R code (references can be found in the software module):
library(lattice)
if (par1 == 'TRUE') par1 <- TRUE
if (par1 == 'FALSE') par1 <- FALSE
par2 <- as.numeric(par2) #Box-Cox lambda transformation parameter
par3 <- as.numeric(par3) #degree of non-seasonal differencing
par4 <- as.numeric(par4) #degree of seasonal differencing
par5 <- as.numeric(par5) #seasonal period
par6 <- as.numeric(par6) #degree (p) of the non-seasonal AR(p) polynomial
par7 <- as.numeric(par7) #degree (q) of the non-seasonal MA(q) polynomial
par8 <- as.numeric(par8) #degree (P) of the seasonal AR(P) polynomial
par9 <- as.numeric(par9) #degree (Q) of the seasonal MA(Q) polynomial
armaGR <- function(arima.out, names, n){
try1 <- arima.out$coef
try2 <- sqrt(diag(arima.out$var.coef))
try.data.frame <- data.frame(matrix(NA,ncol=4,nrow=length(names)))
dimnames(try.data.frame) <- list(names,c('coef','std','tstat','pv'))
try.data.frame[,1] <- try1
for(i in 1:length(try2)) try.data.frame[which(rownames(try.data.frame)==names(try2)[i]),2] <- try2[i]
try.data.frame[,3] <- try.data.frame[,1] / try.data.frame[,2]
try.data.frame[,4] <- round((1-pt(abs(try.data.frame[,3]),df=n-(length(try2)+1)))*2,5)
vector <- rep(NA,length(names))
vector[is.na(try.data.frame[,4])] <- 0
maxi <- which.max(try.data.frame[,4])
continue <- max(try.data.frame[,4],na.rm=TRUE) > .05
vector[maxi] <- 0
list(summary=try.data.frame,next.vector=vector,continue=continue)
}
arimaSelect <- function(series, order=c(13,0,0), seasonal=list(order=c(2,0,0),period=12), include.mean=F){
nrc <- order[1]+order[3]+seasonal$order[1]+seasonal$order[3]
coeff <- matrix(NA, nrow=nrc*2, ncol=nrc)
pval <- matrix(NA, nrow=nrc*2, ncol=nrc)
mylist <- rep(list(NULL), nrc)
names <- NULL
if(order[1] > 0) names <- paste('ar',1:order[1],sep='')
if(order[3] > 0) names <- c( names , paste('ma',1:order[3],sep='') )
if(seasonal$order[1] > 0) names <- c(names, paste('sar',1:seasonal$order[1],sep=''))
if(seasonal$order[3] > 0) names <- c(names, paste('sma',1:seasonal$order[3],sep=''))
arima.out <- arima(series, order=order, seasonal=seasonal, include.mean=include.mean, method='ML')
mylist[[1]] <- arima.out
last.arma <- armaGR(arima.out, names, length(series))
mystop <- FALSE
i <- 1
coeff[i,] <- last.arma[[1]][,1]
pval [i,] <- last.arma[[1]][,4]
i <- 2
aic <- arima.out$aic
while(!mystop){
mylist[[i]] <- arima.out
arima.out <- arima(series, order=order, seasonal=seasonal, include.mean=include.mean, method='ML', fixed=last.arma$next.vector)
aic <- c(aic, arima.out$aic)
last.arma <- armaGR(arima.out, names, length(series))
mystop <- !last.arma$continue
coeff[i,] <- last.arma[[1]][,1]
pval [i,] <- last.arma[[1]][,4]
i <- i+1
}
list(coeff, pval, mylist, aic=aic)
}
arimaSelectplot <- function(arimaSelect.out,noms,choix){
noms <- names(arimaSelect.out[[3]][[1]]$coef)
coeff <- arimaSelect.out[[1]]
k <- min(which(is.na(coeff[,1])))-1
coeff <- coeff[1:k,]
pval <- arimaSelect.out[[2]][1:k,]
aic <- arimaSelect.out$aic[1:k]
coeff[coeff==0] <- NA
n <- ncol(coeff)
if(missing(choix)) choix <- k
layout(matrix(c(1,1,1,2,
3,3,3,2,
3,3,3,4,
5,6,7,7),nr=4),
widths=c(10,35,45,15),
heights=c(30,30,15,15))
couleurs <- rainbow(75)[1:50]#(50)
ticks <- pretty(coeff)
par(mar=c(1,1,3,1))
plot(aic,k:1-.5,type='o',pch=21,bg='blue',cex=2,axes=F,lty=2,xpd=NA)
points(aic[choix],k-choix+.5,pch=21,cex=4,bg=2,xpd=NA)
title('aic',line=2)
par(mar=c(3,0,0,0))
plot(0,axes=F,xlab='',ylab='',xlim=range(ticks),ylim=c(.1,1))
rect(xleft = min(ticks) + (0:49)/50*(max(ticks)-min(ticks)),
xright = min(ticks) + (1:50)/50*(max(ticks)-min(ticks)),
ytop = rep(1,50),
ybottom= rep(0,50),col=couleurs,border=NA)
axis(1,ticks)
rect(xleft=min(ticks),xright=max(ticks),ytop=1,ybottom=0)
text(mean(coeff,na.rm=T),.5,'coefficients',cex=2,font=2)
par(mar=c(1,1,3,1))
image(1:n,1:k,t(coeff[k:1,]),axes=F,col=couleurs,zlim=range(ticks))
for(i in 1:n) for(j in 1:k) if(!is.na(coeff[j,i])) {
if(pval[j,i]<.01) symb = 'green'
else if( (pval[j,i]<.05) & (pval[j,i]>=.01)) symb = 'orange'
else if( (pval[j,i]<.1) & (pval[j,i]>=.05)) symb = 'red'
else symb = 'black'
polygon(c(i+.5 ,i+.2 ,i+.5 ,i+.5),
c(k-j+0.5,k-j+0.5,k-j+0.8,k-j+0.5),
col=symb)
if(j==choix) {
rect(xleft=i-.5,
xright=i+.5,
ybottom=k-j+1.5,
ytop=k-j+.5,
lwd=4)
text(i,
k-j+1,
round(coeff[j,i],2),
cex=1.2,
font=2)
}
else{
rect(xleft=i-.5,xright=i+.5,ybottom=k-j+1.5,ytop=k-j+.5)
text(i,k-j+1,round(coeff[j,i],2),cex=1.2,font=1)
}
}
axis(3,1:n,noms)
par(mar=c(0.5,0,0,0.5))
plot(0,axes=F,xlab='',ylab='',type='n',xlim=c(0,8),ylim=c(-.2,.8))
cols <- c('green','orange','red','black')
niv <- c('0','0.01','0.05','0.1')
for(i in 0:3){
polygon(c(1+2*i ,1+2*i ,1+2*i-.5 ,1+2*i),
c(.4 ,.7 , .4 , .4),
col=cols[i+1])
text(2*i,0.5,niv[i+1],cex=1.5)
}
text(8,.5,1,cex=1.5)
text(4,0,'p-value',cex=2)
box()
residus <- arimaSelect.out[[3]][[choix]]$res
par(mar=c(1,2,4,1))
acf(residus,main='')
title('acf',line=.5)
par(mar=c(1,2,4,1))
pacf(residus,main='')
title('pacf',line=.5)
par(mar=c(2,2,4,1))
qqnorm(residus,main='')
title('qq-norm',line=.5)
qqline(residus)
residus
}
if (par2 == 0) x <- log(x)
if (par2 != 0) x <- x^par2
(selection <- arimaSelect(x, order=c(par6,par3,par7), seasonal=list(order=c(par8,par4,par9), period=par5)))
bitmap(file='test1.png')
resid <- arimaSelectplot(selection)
dev.off()
resid
bitmap(file='test2.png')
acf(resid,length(resid)/2, main='Residual Autocorrelation Function')
dev.off()
bitmap(file='test3.png')
pacf(resid,length(resid)/2, main='Residual Partial Autocorrelation Function')
dev.off()
bitmap(file='test4.png')
cpgram(resid, main='Residual Cumulative Periodogram')
dev.off()
bitmap(file='test5.png')
hist(resid, main='Residual Histogram', xlab='values of Residuals')
dev.off()
bitmap(file='test6.png')
densityplot(~resid,col='black',main='Residual Density Plot', xlab='values of Residuals')
dev.off()
bitmap(file='test7.png')
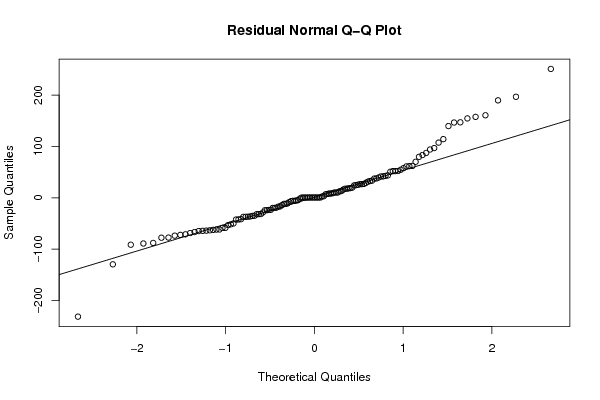
qqnorm(resid, main='Residual Normal Q-Q Plot')
qqline(resid)
dev.off()
ncols <- length(selection[[1]][1,])
nrows <- length(selection[[2]][,1])-1
load(file='createtable')
a<-table.start()
a<-table.row.start(a)
a<-table.element(a,'ARIMA Parameter Estimation and Backward Selection', ncols+1,TRUE)
a<-table.row.end(a)
a<-table.row.start(a)
a<-table.element(a,'Iteration', header=TRUE)
for (i in 1:ncols) {
a<-table.element(a,names(selection[[3]][[1]]$coef)[i],header=TRUE)
}
a<-table.row.end(a)
for (j in 1:nrows) {
a<-table.row.start(a)
mydum <- 'Estimates ('
mydum <- paste(mydum,j)
mydum <- paste(mydum,')')
a<-table.element(a,mydum, header=TRUE)
for (i in 1:ncols) {
a<-table.element(a,round(selection[[1]][j,i],4))
}
a<-table.row.end(a)
a<-table.row.start(a)
a<-table.element(a,'(p-val)', header=TRUE)
for (i in 1:ncols) {
mydum <- '('
mydum <- paste(mydum,round(selection[[2]][j,i],4),sep='')
mydum <- paste(mydum,')')
a<-table.element(a,mydum)
}
a<-table.row.end(a)
}
a<-table.end(a)
table.save(a,file='mytable.tab')
a<-table.start()
a<-table.row.start(a)
a<-table.element(a,'Estimated ARIMA Residuals', 1,TRUE)
a<-table.row.end(a)
a<-table.row.start(a)
a<-table.element(a,'Value', 1,TRUE)
a<-table.row.end(a)
for (i in (par4*par5+par3):length(resid)) {
a<-table.row.start(a)
a<-table.element(a,resid[i])
a<-table.row.end(a)
}
a<-table.end(a)
table.save(a,file='mytable1.tab')